. 2024 Apr 30:12:e17091.
doi: 10.7717/peerj.17091. eCollection 2024.

Cost-effort analysis of Baited Remote Underwater Video (BRUV) and environmental DNA (eDNA) in monitoring marine ecological communities

Affiliations

Cost-effort analysis of Baited Remote Underwater Video (BRUV) and environmental DNA (eDNA) in monitoring marine ecological communities

Alice J Clark et al. PeerJ. .

Abstract

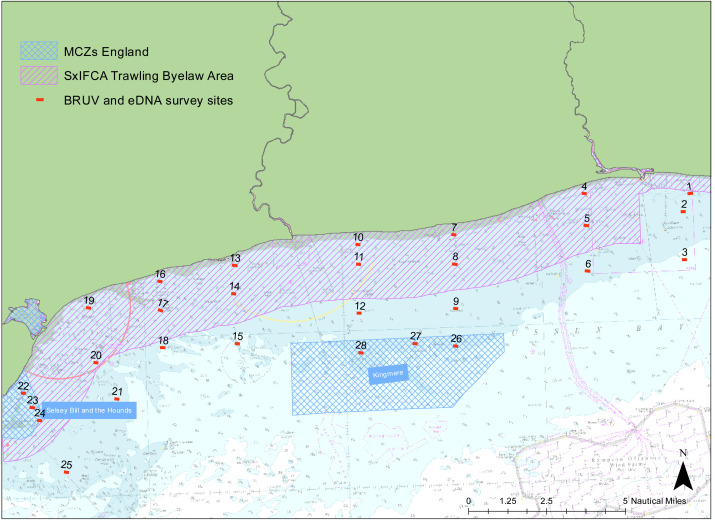
Monitoring the diversity and distribution of species in an ecosystem is essential to assess the success of restoration strategies. Implementing biomonitoring methods, which provide a comprehensive assessment of species diversity and mitigate biases in data collection, holds significant importance in biodiversity research. Additionally, ensuring that these methods are cost-efficient and require minimal effort is crucial for effective environmental monitoring. In this study we compare the efficiency of species detection, the cost and the effort of two non-destructive sampling techniques: Baited Remote Underwater Video (BRUV) and environmental DNA (eDNA) metabarcoding to survey marine vertebrate species. Comparisons were conducted along the Sussex coast upon the introduction of the Nearshore Trawling Byelaw. This Byelaw aims to boost the recovery of the dense kelp beds and the associated biodiversity that existed in the 1980s. We show that overall BRUV surveys are more affordable than eDNA, however, eDNA detects almost three times as many species as BRUV. eDNA and BRUV surveys are comparable in terms of effort required for each method, unless eDNA analysis is carried out externally, in which case eDNA requires less effort for the lead researchers. Furthermore, we show that increased eDNA replication yields more informative results on community structure. We found that using both methods in conjunction provides a more complete view of biodiversity, with BRUV data supplementing eDNA monitoring by recording species missed by eDNA and by providing additional environmental and life history metrics. The results from this study will serve as a baseline of the marine vertebrate community in Sussex Bay allowing future biodiversity monitoring research projects to understand community structure as the ecosystem recovers following the removal of trawling fishing pressure. Although this study was regional, the findings presented herein have relevance to marine biodiversity and conservation monitoring programs around the globe.

Keywords: Baseline survey; Biodiversity monitoring; Coastal ecosystem; Marine biodiversity; Population ecology.


Conflict of interest statement

Nathan R. Geraldi works for NatureMetrics.

Figures

Figure 1
Figure 1. Site map.
Map of study region showing the 28 sampled sites within Sussex Bay. A separate deployment of 3 BRUV systems was undertaken in Swanage in a kelp-dominated ecosystem for reference. The red dots and black numbers correspond to the sites sampled. Sites within the pink hashed area are within the Trawling Byelaw Area, sites within blue hashed areas are in Marine Conservation Zones (MCZs) and sites outside hashed areas are the sites in areas which have no protection.
Figure 2
Figure 2. Venn diagram of eDNA and BRUV species detections.
Environmental DNA surveys captured the majority (78/81) of the species detected by both surveys, failing to identify only three species detected by the BRUV. eDNA identified 54 species that were missed by the BRUV surveys. In contrast, BRUV surveys identified 27/81 species. Both methods identified the same 24 species belonging to 12 families. Infographic was designed by Alice Clark in collaboration with NatureMetrics.
Figure 3
Figure 3. Sample-sized based rarefaction and extrapolation curves of fish and marine vertebrates detected using BRUV and eDNA surveys.
Overall, across the 27 sites in Sussex, the observed species richness for eDNA was 78, while BRUV detected 26 species. Shaded areas represent a 95% confidence interval.
Figure 4
Figure 4. Canonical correspondence analysis of eDNA vs BRUV.
Canonical correspondence analysis (CCA) showing sampled sites clustered by sampling method. eDNA sampled sites are in blue and BRUV sampled sites are in orange. The environmental variable macroalgal percentage cover is plotted as a black vector. The CCA revealed that species and sites and structured by macroalgal percentage cover (χ2 = 0.25, F = 1.71, p = 0.008) and sampling method (χ2 = 0.34, F = 3.65, p = 0.001).
Figure 5
Figure 5. Sample-sized based rarefaction and extrapolation curves of the Valsecchi 16S assay comparing the number of replicates taken at each Sussex site.
The observed species richness (q = 0) for 1 replicate per site (21 samples) was 51, for two replicates per site (42 samples) it was 55 and for 3 replicates per site (63 samples) it was 59. Shaded area represents the 95% confidence intervals.
Figure 6
Figure 6. Canonical correspondence analysis with additional replicates.
Canonical correspondence analysis (CCA) plot of the 21 Sussex sites and the Swanage control site with three eDNA replicates taken at each site. The sites are coloured according to treatment type (inside trawling exclusion zone, MCZ Kingmere, MCZ Selsey Bill and the Hounds, outside the trawling exclusion zone and the Swanage kelp control site). The CCA revealed that species and sites are structured by depth (χ2 = 0.22, F = 2.36, p = 0.001), macroalgal percentage cover (χ2 = 0.15, F = 1.66 p = 0.006) and treatment (χ2 = 0.49, F = 1.34, p = 0.006).
Figure 7
Figure 7. Cost comparison.
Cost comparison of BRUV surveys, eDNA surveys with in-house sample analysis and eDNA surveys with external sample analysis. Costs were broken down into three categories: equipment, field work and analysis. Overall, the BRUV survey was the most affordable biomonitoring technique, and eDNA with external sample analysis was the most expensive.

References

    1. Afzali SF, Bourdages H, Laporte M, Mérot C, Normandeau E, Audet C, Bernatchez L. Comparing environmental metabarcoding and trawling survey of demersal fish communities in the Gulf of St. Lawrence, Canada. Environmental DNA. 2021;3:22–42. doi: 10.1002/edn3.111. - DOI
    1. Alexander JB, Bunce M, White N, Wilkinson SP, Adam AAS, Berry T, Stat M, Thomas L, Newman SJ, Dugal L, Richards ZT. Development of a multi-assay approach for monitoring coral diversity using eDNA metabarcoding. Coral Reefs. 2020;39:159–171. doi: 10.1007/s00338-019-01875-9. - DOI
    1. Alfaro-Cordova E, Ortiz-Alvarez C, Alfaro-Shigueto J, Mangel JC, García O, Velez-Zuazo X. What lies beneath? Revealing biodiversity through eDNA analysis in Lobos de Afuera Islands, Peru. Latin American Journal of Aquatic Research. 2022;50:642–659. doi: 10.3856/vol50-issue4-fulltext-2782. - DOI
    1. Altschul SF, Gish W, Miller W, Myers EW, Lipman DJ. Basic local alignment search tool. Journal of Molecular Biology. 1990;215:403–410. doi: 10.1016/S0022-2836(05)80360-2. - DOI - PubMed
    1. Andersen JH, Al-Hamdani Z, Harvey ET, Kallenbach E, Murray C, Stock A. Relative impacts of multiple human stressors in estuaries and coastal waters in the North Sea–Baltic Sea transition zone. Science of the Total Environment. 2020;704:135316. doi: 10.1016/j.scitotenv.2019.135316. - DOI - PubMed

Publication types

Substances

LinkOut - more resources