. 2024 Apr 19:15:1379562.
doi: 10.3389/fpls.2024.1379562. eCollection 2024.

Comparative functional analyses of PHR1, PHL1, and PHL4 transcription factors in regulating Arabidopsis responses to phosphate starvation

Affiliations

Comparative functional analyses of PHR1, PHL1, and PHL4 transcription factors in regulating Arabidopsis responses to phosphate starvation

Zhen Wang et al. Front Plant Sci. .

Abstract

To cope with phosphate (Pi) starvation, plants trigger an array of adaptive responses to sustain their growth and development. These responses are largely controlled at transcriptional levels. In Arabidopsis (Arabidopsis thaliana), PHOSPHATE RESPONSE 1 (PHR1) is a key regulator of plant physiological and transcriptional responses to Pi starvation. PHR1 belongs to a MYB-CC-type transcription factor family which contains 15 members. In this PHR1 family, PHR1/PHR1-like 1(PHL1) and PHL2/PHL3 form two distinct modules in regulating plant development and transcriptional responses to Pi starvation. PHL4 is the most closely related member to PHR1. Previously, using the phr1phl4 mutant, we showed that PHL4 is also involved in regulating plant Pi responses. However, the precise roles of PHL1 and PHL4 in regulating plant Pi responses and their functional relationships with PHR1 have not been clearly defined. In this work, we further used the phl1phl4 and phr1phl1phl4 mutants to perform comparative phenotypic and transcriptomic analyses with phr1, phr1phl1, and phr1phl4. The results showed that both PHL1 and PHL4 act redundantly and equally with PHR1 to regulate leaf senescence, Pi starvation induced-inhibition of primary root growth, and accumulation of anthocyanins in shoots. Unlike PHR1 and PHL1, however, the role of PHL4 in maintaining Pi homeostasis is negligible. In regulating transcriptional responses to Pi starvation at genomic levels, both PHL1 and PHL4 play minor roles when acts alone, however, they act synergistically with PHR1. In regulating Pi starvation-responsive genes, PHL4 also function less than PHL1 in terms of the number of the genes it regulates and the magnitude of gene transcription it affects. Furthermore, no synergistic interaction was found between PHL1 and PHL4 in regulating plant response to Pi starvation. Therefore, our results clarified the roles of PHL1 and PHL4 in regulating plant responses to Pi starvation. In addition, this work revealed a new function of these three transcription factors in regulating flowering time.

Keywords: PHL1; PHL4; PHR1; Pi starvation responses; flowering time; functional relationship; transcriptomic analyses.


Conflict of interest statement

The authors declare that the research was conducted in the absence of any commercial or financial relationships that could be construed as a potential conflict of interest.

Figures

Figure 1
Figure 1
The phylogenetic relationship of Arabidopsis PHR1 family members and growth phenotypes of the WT and various mutants. (A) The phylogenetic tree of the PHR1 family members generated by MEGA 7 software. Multiple alignment was conducted by an online service, Clustal Omega (https://www.ebi.ac.uk/Tools/msa/clustalo/). A maximum likelihood (ML) algorithm and full-length protein sequences were used to construct the tree. (B) and (C) Up panels: Growth phenotypes of one-month (B) and 45-day-old (C) plants of the WT, phr1phl1, phr1phl4, and phr1phl1phl4 grow in soil. The senescence phenotype is indicated as yellowish leaves. Bottom panels: A close view of the rosette leaves that were arranged from the oldest to the youngest (from left to right).
Figure 2
Figure 2
PR growth of 8-day-old WT and various mutants grown on media with different amount of Pi supplementations. (A–F) The pictures showing the morphologies of the seedlings grown on the media with 300 μM, 100 μM, 50 μM, 25 μM, 10 μM, or 0 μM Pi supplementations, respectively. The Pi content in the medium is indicated at the bottom of each panel. Bars = 1 cm. (G–L) Quantification of PR length of the seedlings grown in different media. The Pi supplementation in the medium is indicated on the top of the panel. These experiments were repeated three times with similar results. Values represent means ± SD of more than ten primary roots for each genotype. Different letters above any two columns within the same chart indicate significant differences of the values between these two samples (One-way ANOVA/Tukey test, P < 0.05).
Figure 3
Figure 3
The cellular Pi content (A) and total P content (B) of 10-day-old WT and mutants grown on +Pi and –Pi media. These experiments were repeated three times with similar results. Values represent means ± SD of more than five replicates. Different letters above any two columns within the same chart indicate significant differences of the values between these two samples (One-way ANOVA/Tukey test, P < 0.05).
Figure 4
Figure 4
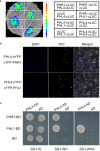
Physical interactions among PHR1, PHL1, and PHL4. (A) The interactions among PHR1, PHL1, and PHL4 tested by luciferase complementation imaging assays. (B) The interactions among PHR1, PHL1, and PHL4 tested by bimolecular fluorescence complementation assays. (C) The interactions among PHR1, PHL1, and PHL4 tested by yeast-two hybrid experiments. From left to right: the yeast cells carrying different combination of the construct grown on the double-, triple-, and quadruple-deficient selection media.
Figure 5
Figure 5
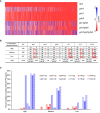
Summary of the differentially expressed genes in the WT and various mutants. (A) Heatmap showing the expression levels of the PSI genes in the WT and various mutants. The value (Log2FC) for each PSI gene in the heatmap was calculated by comparing the expression of Pi-deficient plants of each genotype to the expression of the Pi-sufficient WT. The diagram was generated using an online software, Morpheus (https://software.broadinstitute.org/morpheus/). (B) The numbers of PSR genes with different responsiveness affected in each mutant. (C) The percentages of PSR genes with different responsiveness affected in each mutant. In (B, C): PSI genes were divided into three categories according to their responsiveness to Pi starvation: “High” refers to Log2FC > 5, “Medium” refers to 2 < Log2FC ≤ 5, and “Low” refers to 1 ≤ Log2FC ≤ 2. “up” refers to the PSI genes whose expression is upregulated in the mutants; “dn” refers to the PSI genes whose expression is downregulated in the mutants.
Figure 6
Figure 6
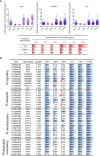
The difference of average expression levels (DAE) of mutation-affected PSI-down genes and the expression levels of some typical PSI genes in the mutants. (A) The DAE of mutation-affected PSI-down genes between the WT and each mutant. Up panel: The scatter plots showing means ± SD of DAE for each mutant. The mutant names are indicated in X-coordinate. Bottom panel: the corresponding data showing in up panel. All PSI-down genes examined were divided into three categories according to their responsiveness to Pi starvation: “High” refers to Log2FC > 5, “Medium” refers to 2 < Log2FC ≤ 5, “Low” refers to 1 ≤ Log2FC ≤ 2. (B) The expression of typical PSI genes in mutants. The third column indicates the Log2FC between Pi-sufficient and Pi-deficient WT. The fourth to ninth column shows the percentages of decreased transcription level in each mutant compared to the WT.
Figure 7
Figure 7
Further evidence for the function of PHL4. (A) The expression level of PHR genes in PHL4 OX line under +Pi condition. Values represent means ± SD of three replicates of the genes in mutants. (B, C) The GO enrichments of significantly upregulated (B) and downregulated (C) genes in PHL4 OX line under +Pi condition.

Similar articles

Cited by

References

    1. Arpat A. B., Magliano P., Wege S., Rouached H., Stefanovic A., Poirier Y. (2012). Functional expression of PHO1 to the Golgi and trans-Golgi network and its role in export of inorganic phosphate. Plant J. 71, 479–491. doi: 10.1111/j.1365-313X.2012.05004.x - DOI - PubMed
    1. Bariola P. A., Howard C. J., Taylor C. B., Verburg M. T., Jaglan V. D., Green P. J. (1994). The Arabidopsis ribonuclease gene RNS1 is tightly controlled in response to phosphate limitation. Plant J. 6, 673–685. doi: 10.1046/j.1365-313X.1994.6050673.x - DOI - PubMed
    1. Bournier M., Tissot N., Mari S., Boucherez J., Lacombe E., Briat J. F., et al. . (2013). Arabidopsis ferritin 1 (AtFer1) gene regulation by the phosphate starvation response 1 (AtPHR1) transcription factor reveals a direct molecular link between iron and phosphate homeostasis. J. Biol. Chem. 288, 22670–22680. doi: 10.1074/jbc.M113.482281 - DOI - PMC - PubMed
    1. Burleigh S. H., Harrison M. J. (1999). The down-regulation of Mt4-like genes by phosphate fertilization occurs systemically and involves phosphate translocation to the shoots. Plant Physiol. 119, 241–248. doi: 10.1104/pp.119.1.241 - DOI - PMC - PubMed
    1. Bustos R., Castrillo G., Linhares F., Puga M. I., Rubio V., Pérez-Pérez J., et al. . (2010). A central regulatory system largely controls transcriptional activation and repression responses to phosphate starvation in Arabidopsis. PloS Genet. 6, e1001102. doi: 10.1371/journal.pgen.1001102 - DOI - PMC - PubMed