

Use of Deep Learning to Evaluate Tumor Microenvironmental Features for Prediction of Colon Cancer Recurrence
- PMID: 38709069
- PMCID: PMC11114095
- DOI: 10.1158/2767-9764.CRC-24-0031
Use of Deep Learning to Evaluate Tumor Microenvironmental Features for Prediction of Colon Cancer Recurrence
Abstract
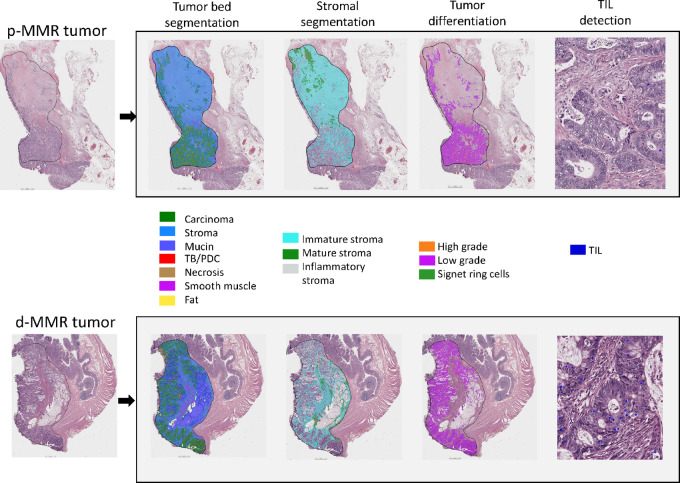
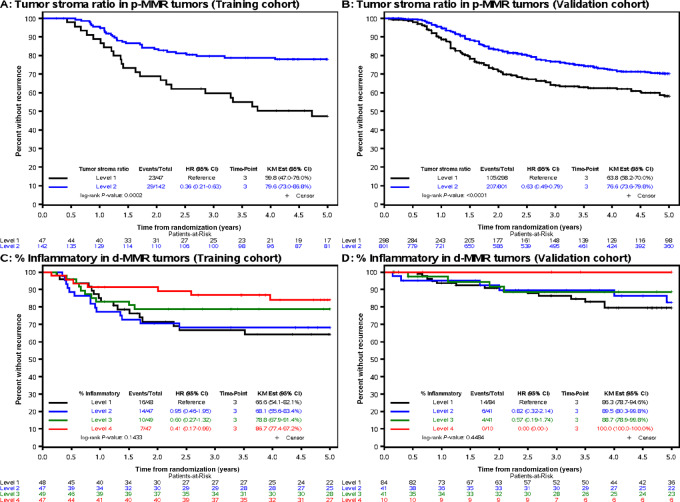
Deep learning may detect biologically important signals embedded in tumor morphologic features that confer distinct prognoses. Tumor morphologic features were quantified to enhance patient risk stratification within DNA mismatch repair (MMR) groups using deep learning. Using a quantitative segmentation algorithm (QuantCRC) that identifies 15 distinct morphologic features, we analyzed 402 resected stage III colon carcinomas [191 deficient (d)-MMR; 189 proficient (p)-MMR] from participants in a phase III trial of FOLFOX-based adjuvant chemotherapy. Results were validated in an independent cohort (176 d-MMR; 1,094 p-MMR). Association of morphologic features with clinicopathologic variables, MMR, KRAS, BRAFV600E, and time-to-recurrence (TTR) was determined. Multivariable Cox proportional hazards models were developed to predict TTR. Tumor morphologic features differed significantly by MMR status. Cancers with p-MMR had more immature desmoplastic stroma. Tumors with d-MMR had increased inflammatory stroma, epithelial tumor-infiltrating lymphocytes (TIL), high-grade histology, mucin, and signet ring cells. Stromal subtype did not differ by BRAFV600E or KRAS status. In p-MMR tumors, multivariable analysis identified tumor-stroma ratio (TSR) as the strongest feature associated with TTR [HRadj 2.02; 95% confidence interval (CI), 1.14-3.57; P = 0.018; 3-year recurrence: 40.2% vs. 20.4%; Q1 vs. Q2-4]. Among d-MMR tumors, extent of inflammatory stroma (continuous HRadj 0.98; 95% CI, 0.96-0.99; P = 0.028; 3-year recurrence: 13.3% vs. 33.4%, Q4 vs. Q1) and N stage were the most robust prognostically. Association of TSR with TTR was independently validated. In conclusion, QuantCRC can quantify morphologic differences within MMR groups in routine tumor sections to determine their relative contributions to patient prognosis, and may elucidate relevant pathophysiologic mechanisms driving prognosis.
Significance: A deep learning algorithm can quantify tumor morphologic features that may reflect underlying mechanisms driving prognosis within MMR groups. TSR was the most robust morphologic feature associated with TTR in p-MMR colon cancers. Extent of inflammatory stroma and N stage were the strongest prognostic features in d-MMR tumors. TIL density was not independently prognostic in either MMR group.
© 2024 The Authors; Published by the American Association for Cancer Research.
Figures
References
-
- Skrede O-J, De Raedt S, Kleppe A, Hveem TS, Liestøl K, Maddison J, et al. Deep learning for prediction of colorectal cancer outcome: a discovery and validation study. Lancet 2020;395:350–60. - PubMed
-
- Tizhoosh HR, Diamandis P, Campbell CJV, Safarpoor A, Kalra S, Maleki D, et al. Searching images for consensus: can AI remove observer variability in pathology? Am J Pathol 2021;191:1702–8. - PubMed
Publication types
MeSH terms
Substances
Supplementary concepts
Grants and funding
LinkOut - more resources
Full Text Sources
Research Materials
Miscellaneous
