. 2024 Jun 4;12(6):e0035424.
doi: 10.1128/spectrum.00354-24. Epub 2024 May 6.

Identification of a hemorrhagic determinant in Clostridioides difficile TcdA and Paeniclostridium sordellii TcsH

Affiliations

Identification of a hemorrhagic determinant in Clostridioides difficile TcdA and Paeniclostridium sordellii TcsH

Yangling Zheng et al. Microbiol Spectr. .

Abstract

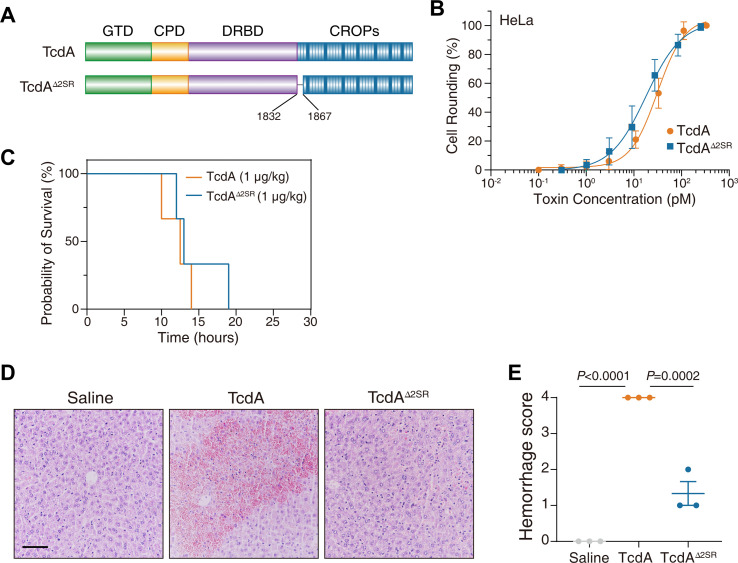
Paeniclostridium sordellii hemorrhagic toxin (TcsH) and Clostridioides difficile toxin A (TcdA) are two major members of the large clostridial toxin (LCT) family. These two toxins share ~87% similarity and are known to cause severe hemorrhagic pathology in animals. Yet, the pathogenesis of their hemorrhagic toxicity has been mysterious for decades. Here, we examined the liver injury after systemic exposure to different LCTs and found that only TcsH and TcdA induce overt hepatic hemorrhage. By investigating the chimeric and truncated toxins, we demonstrated that the enzymatic domain of TcsH alone is not sufficient to determine its potent hepatic hemorrhagic toxicity in mice. Likewise, the combined repetitive oligopeptide (CROP) domain of TcsH/TcdA alone also failed to explain their strong hemorrhagic activity in mice. Lastly, we showed that disrupting the first two short repeats of CROPs in TcsH and TcdA impaired hemorrhagic toxicity without causing overt changes in cytotoxicity and lethality. These findings lead to a deeper understanding of toxin-induced hemorrhage and the pathogenesis of LCTs and could be insightful in developing therapeutic avenues against clostridial infections.

Importance: Paeniclostridium sordellii and Clostridioides difficile infections often cause hemorrhage in the affected tissues and organs, which is mainly attributed to their hemorrhagic toxins, TcsH and TcdA. In this study, we demonstrate that TcsH and TcdA, but not other related toxins. including Clostridioides difficile toxin B and TcsL, induce severe hepatic hemorrhage in mice. We further determine that a small region in TcsH and TcdA is critical for the hemorrhagic toxicity but not cytotoxicity or lethality of these toxins. Based on these results, we propose that the hemorrhagic toxicity of TcsH and TcdA is due to an uncharacterized mechanism, such as the presence of an unknown receptor, and future studies to identify the interactive host factors are warranted.

Keywords: Clostridium difficile; Paeniclostridium sordellii; TcdA; TcsH; bacterial toxin.


Conflict of interest statement

The authors declare no conflict of interest.

Figures

Fig 1
Fig 1
TcsH and TcdA-induced hepatic hemorrhage is specific among LCTs. (A) Mice were IP injected with 1-µg/kg TcdA, 1-µg/kg TcdB, 2-µg/kg TcsH, 0.4-µg/kg TcsL, 4-µg/kg Tcnα, 500-µg/kg TpeL, or saline. The Kaplan-Meier survival curves are shown. (B) The livers were dissected from the mice 8 hours post-injection with different LCTs. Representative pictures are shown. (C) Hematoxylin and eosin-stained liver sections from the mice 8 hours post-injection with different LCTs. Representative images are shown (scale bar, 100 µm). (D) The stained sections in panel C were analyzed, and histological scores for hemorrhage were assessed. Error bars indicate mean ± SEM, n = 3 mice per group, ordinary one-way analysis of variance.
Fig 2
Fig 2
The hemorrhagic toxicity is not determined by target specificity. (A) Schematic drawing of designed chimeric toxins TcHBB, TcHLL, TcBBH, and TcBBA. (B) The sensitivities of HeLa WT cells toward TcsH, TcdB, TcsL, TcHBB, and TcHLL were measured using the cytopathic cell-rounding experiments. Error bars represent the mean ± SD, n = 6. (C) Kaplan-Meier curves show the survival of C57BL/6 WT mice intraperitoneally injected with 5-µg/kg TcHBB and 0.8-µg/kg TcHLL, respectively. (D) Mouse liver tissues were harvested 8 hours post-toxin injection and sectioned for H&E staining histopathology (scale bar, 100 µm.). (E) Histological scores for the hemorrhagic pathology in panel D were assessed. Error bars indicate mean ± SEM, n = 3 mice per group, ordinary one-way analysis of variance. CPD, cysteine protease domain; CROP, combined repetitive oligopeptide domain; DRBD, delivery and receptor-binding domain; GTD, glucosyltransferase domain; WT, wild type.
Fig 3
Fig 3
TcdB fused with TcsH or TcdA CROPs cause no hepatic hemorrhage. (A) The sensitivities of HeLa and FZD1/2/7‒/‒ cells to TcBBH were measured using the cytopathic cell-rounding experiments. (B) The sensitivities of MCF-7 WT, TMPRSS2‒/‒, and GMDS‒/‒ cells to TcBBH were measured using the cytopathic cell-rounding experiments. (C) Kaplan-Meier curves show the survival of C57BL/6 WT mice intraperitoneally injected with 2-µg/kg TcsH, 1-µg/kg TcdB, or 1-µg/kg TcBBH, respectively, Log-rank (Mantel-Cox) test. (D) Mouse liver tissues were harvested 8 hours post-toxin injection and sectioned for H&E staining histopathology (scale bar, 100 µm). (E) Histological scores for the hemorrhagic pathology in panel D were assessed. Error bars indicate mean ± SEM, n = 3 mice per group, ordinary one-way analysis of variance (ANOVA). (F) Representative fluorescence images show GFP-TcdA1832–2710 (green) binding to the MCF-7 WT but not GMDS‒/‒ cells. Cell nuclei were stained by Hoechst (blue), and the scale bar represents 50 µm. (G) The sensitivities of MCF-7 and GMDS‒/‒ cells to TcdA were measured using the cytopathic cell-rounding experiments. (H) Kaplan-Meier curves show the survival of C57BL/6 WT mice IP injected with 1-µg/kg TcdA, 1-µg/kg TcdB, or 1-µg/kg TcBBA, respectively. (I) Mouse liver tissues were harvested 8 hours post-toxin injection and were sectioned for H&E staining histopathology (scale bar, 100 µm). (J) Histological scores for the hemorrhagic pathology in panel I were assessed. Error bars indicate mean ± SEM, n = 3 mice per group, ordinary one-way ANOVA. For panels A, B, and G, error bars represent the mean ± SD, n = 6.
Fig 4
Fig 4
C-terminally truncated TcsH with partial CROPs induced hemorrhage. (A) Schematic drawing of C-terminally truncated toxins, including TcsH1-1832, TcsH1-2303, TcsH1-2415, and TcsH1-2556. (B) The change of toxin resistance in the TMPRSS2‒/‒ and GMDS‒/‒ cells were quantified and normalized to the MCF-7 WT. Error bars represent the mean ± SD, n = 6. (C) Kaplan-Meier curves show the survival of C57BL/6 WT mice IP injected with 50-µg/kg TcsH1-1832, 2-µg/kg TcsH1-2303, 2-µg/kg TcsH1-2415, 2-µg/kg TcsH1-2556, or 2-µg/kg TcsH, respectively. (D) Mouse liver tissues were harvested 8 hours post-toxin injection and sectioned for H&E staining histopathology (scale bar, 100 µm). (E) Histological scores for the hemorrhagic pathology in panel D were assessed. Error bars indicate mean ± SEM, n = 3 mice per group, ordinary one-way ANOVA.
Fig 5
Fig 5
Disruption of the first two SRs in TcsH impairs hemorrhagic toxicity. (A) Schematic drawing of TcsH∆2SR, an internally deleted TcsH mutant. (B) The sensitivities of MCF-7 WT, TMPRSS2‒/‒, and GMDS‒/‒ cells to TcsH∆2SR were measured using the cytopathic cell-rounding experiments. Error bars represent the mean ± SD, n = 6. (C) Kaplan-Meier curves show the survival of C57BL/6 mice IP injected with 2 μg/kg TcsH or 20 μg/kg TcsH∆2SR, respectively. (D) Mouse liver tissues were harvested 8 hours post-toxin injection and sectioned for H&E staining histopathology (scale bar, 100 µm). (E) Histological scores for the hemorrhagic pathology in panel D were assessed. Error bars indicate mean ± SEM, n = 3 mice per group, ordinary one-way ANOVA.
Fig 6
Fig 6
The ∆2SR in TcdA also dissects the hemorrhagic and lethal toxicity. (A) Schematic drawing of TcdA∆2SR, an internally deleted TcdA mutant. (B) The sensitivities of HeLa cells to TcdA and TcdA∆2SR were measured using the cytopathic cell-rounding experiments. Error bars represent the mean ± SD, n = 6. (C) Kaplan-Meier curves show the survival of C57BL/6 mice IP injected with 1-μg/kg TcdA or 1-μg/kg TcdA∆2SR, respectively. (D) Mouse liver tissues were harvested 8 hours post-toxin injection and sectioned for H&E staining histopathology (scale bar, 100 µm). (E) Histological scores for the hemorrhagic pathology in panel D were assessed. Error bars indicate mean ± SEM, n = 3 mice per group, ordinary one-way ANOVA.

Similar articles

Cited by

References

    1. Popoff MR, Bouvet P. 2009. Clostridial toxins. Future Microbiol 4:1021–1064. doi:10.2217/fmb.09.72 - DOI - PubMed
    1. Uzal FA, Navarro MA, Li J, Freedman JC, Shrestha A, McClane BA. 2018. Comparative pathogenesis of Enteric clostridial infections in humans and animals. Anaerobe 53:11–20. doi:10.1016/j.anaerobe.2018.06.002 - DOI - PMC - PubMed
    1. Nagahama M, Takehara M, Rood JI. 2019. Histotoxic clostridial infections. Microbiol Spectr 7. doi:10.1128/microbiolspec.GPP3-0024-2018 - DOI - PMC - PubMed
    1. Stevens DL, Aldape MJ, Bryant AE. 2012. Life-threatening clostridial infections. Anaerobe 18:254–259. doi:10.1016/j.anaerobe.2011.11.001 - DOI - PubMed
    1. Orrell KE, Melnyk RA. 2021. Large Clostridial toxins: mechanisms and roles in disease. Microbiol Mol Biol Rev 85:e0006421. doi:10.1128/MMBR.00064-21 - DOI - PMC - PubMed

LinkOut - more resources