

Temporal changes in temperature-related mortality in relation to the establishment of the heat-health alert system in Victoria, Australia
- PMID: 38709342
- PMCID: PMC11282152
- DOI: 10.1007/s00484-024-02691-9
Temporal changes in temperature-related mortality in relation to the establishment of the heat-health alert system in Victoria, Australia
Abstract
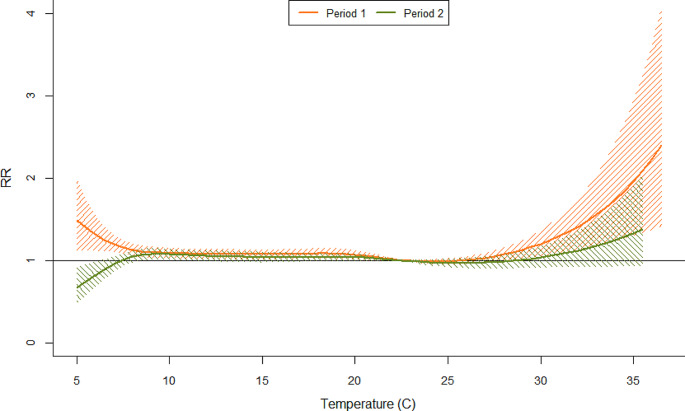
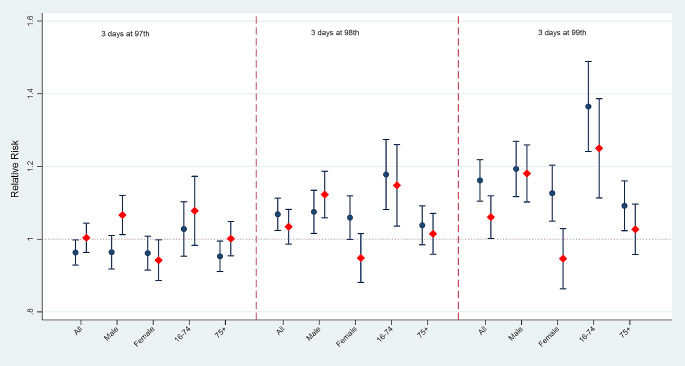
Extreme heat alerts are the most common form of weather forecasting services used in Australia, yet very limited studies have documented their effectiveness in improving health outcomes. This study aimed to examine the temporal changes in temperature-related mortality in relation to the activation of the heat-health alert and response system (HARS) in the State of Victoria, Australia. We examined the relationship between temperatures and mortality using quasi-Poisson regression and the distributed lag non-linear model (dlnm) and compared the temperature-mortality association between the two periods: period 1- prior-HARS (1992-2009) and period 2- post-HARS (2010-2019). Since the HARS heavily weights heatwave effects, we also compared the main effects of heatwave events between the two periods. The heatwaves were defined for three levels, including 3 consecutive days at 97th, 98th, and 99th percentiles. We also controlled the potential confounding effect of seasonality by including a natural cubic B-spline of the day of the year with equally spaced knots and 8 degrees of freedom per year. The exposure-response curve reveals the temperature mortality was reduced in period 2 in comparison with period 1. The relative risk ratios (RRR) of Period 2 over Period 1 were all less than one and gradually decreased from 0.86 (95% CI, 0.72-1.03) to 0.64 (95% CI, 0.33-1.22), and the differences in attributable risk percent increased from 13.2 to 25.3%. The reduction in the risk of heatwave-related deaths decreased by 3.4% (RRp1 1.068, 95% CI, 1.024-1.112 versus RRp2 1.034, 95% CI, 0.986-1.082) and 10% (RRp1 1.16, 95% CI, 1.10-1.22 versus RRp2 1.06, 95% CI, 1.002-1.119) for all groups of people. The study indicated a decrease in heat-related mortality following the operation of HARS in Victoria under extreme heat and high-intensity heatwaves conditions. Further studies could investigate the extent of changes in mortality among populations of differing socio-economic groups during the operation of the heat-health alert system.
Keywords: Australia; Extreme temperature; Heat-action plan; Mortality; Victoria.
© 2024. The Author(s).
Conflict of interest statement
The authors declare no known competing conflict of interest that might influence the content of this article.
Figures
References
-
- Australian Bureau of Statistics (2021b) Victoria 2021 Census All persons QuickStats. Australian Bureau of Statistics. https://www.abs.gov.au/census/find-census-data/quickstats/2021/2. Accessed 05/01/2024
-
- Australian Bureau of Statistics (2021a) Population: Census. Australian Bureau of Statistics. https://www.abs.gov.au/statistics/people/population/population-census/2021. Accessed 24/08/2022
-
- Australian Bureau of statistics (2019) Data by region. https://dbr.abs.gov.au/. Accessed 06/02/2019
-
- Australian Bureau of Statistics (2006) Victoria 2006 Census All persons QuickStats. Australian Bureau of Statistics. https://abs.gov.au/census/find-census-data/quickstats/2006/2#:~:text=In%.... Accessed 05/01/2024
-
- Baghi H, Noorbaloochi S, Moore JB (2007) Statistical and nonstatistical significance: implications for Health Care Researchers. Qual Manage Healthc 16 (2) - PubMed
MeSH terms
LinkOut - more resources
Full Text Sources
