. 2024 May 28;43(5):114193.
doi: 10.1016/j.celrep.2024.114193. Epub 2024 May 5.

Astrocytic Slc4a4 regulates blood-brain barrier integrity in healthy and stroke brains via a CCL2-CCR2 pathway and NO dysregulation

Affiliations

Astrocytic Slc4a4 regulates blood-brain barrier integrity in healthy and stroke brains via a CCL2-CCR2 pathway and NO dysregulation

Qi Ye et al. Cell Rep. .

Abstract

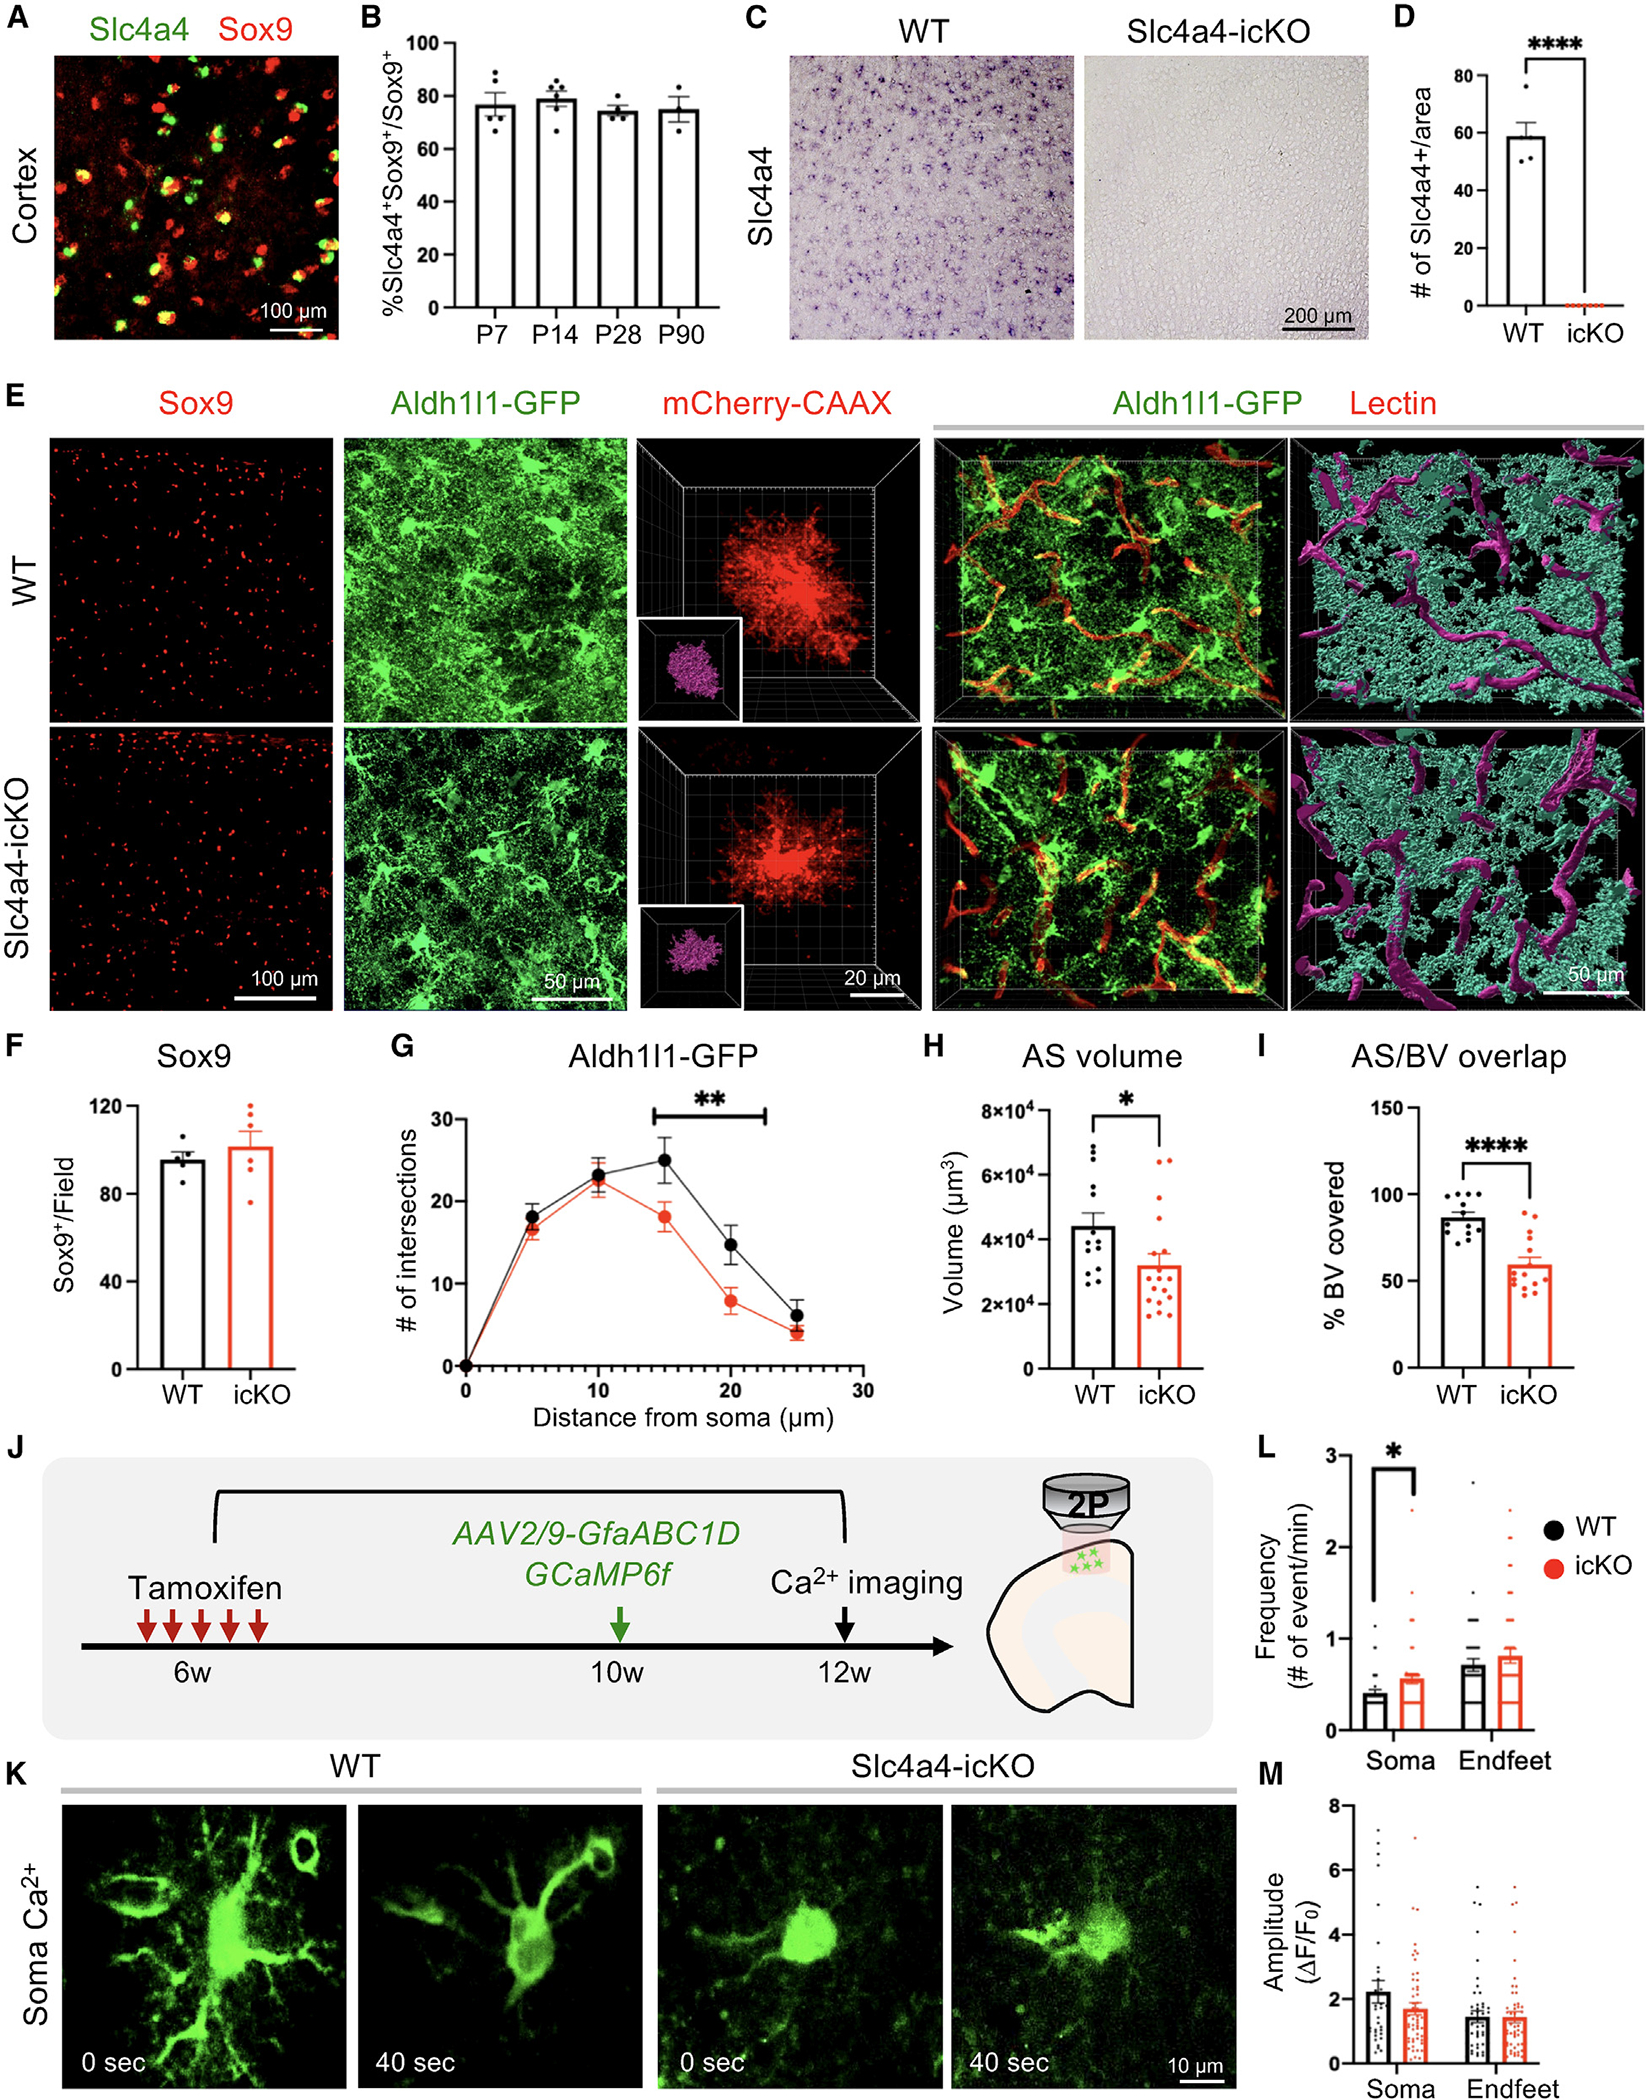
Astrocytes play vital roles in blood-brain barrier (BBB) maintenance, yet how they support BBB integrity under normal or pathological conditions remains poorly defined. Recent evidence suggests that ion homeostasis is a cellular mechanism important for BBB integrity. In the current study, we investigated the function of an astrocyte-specific pH regulator, Slc4a4, in BBB maintenance and repair. We show that astrocytic Slc4a4 is required for normal astrocyte morphological complexity and BBB function. Multi-omics analyses identified increased astrocytic secretion of CCL2 coupled with dysregulated arginine-NO metabolism after Slc4a4 deletion. Using a model of ischemic stroke, we found that loss of Slc4a4 exacerbates BBB disruption, which was rescued by pharmacological or genetic inhibition of the CCL2-CCR2 pathway in vivo. Together, our study identifies the astrocytic Slc4a4-CCL2 and endothelial CCR2 axis as a mechanism controlling BBB integrity and repair, while providing insights for a therapeutic approach against BBB-related CNS disorders.

Keywords: CCL2-CCR2; CP: Neuroscience; Slc4a4; arginine; astrocyte; blood-brain barrier; caveolin; endothelia; ischemic stroke; nitric oxide; pH regulation.


Conflict of interest statement

Declaration of interests Y.K.R. is the founder of pHLIP Inc., but the company did not fund any part of the work reported here.

Figures

Figure 1.
Figure 1.. Slc4a4 is required for morphological complexity and proper Ca2+ propagation in the adult brain
(A) Double in situ-immunofluorescence staining of Slc4a4 in astrocyte lineage (Sox9) in P28 mouse cortex. (B) Quantification of the number of Slc4a4-expressing cortical astrocytes (Slc4a4+Sox9+). Each data point represents an individual animal. n = 3–5 animals for each age. (C and D) In situ hybridization confirms the deletion of Slc4a4 in the cortex. Each data point represents an individual animal. n = 6 per genotype. (E) Representative immunofluorescence images of astrocyte markers (Sox9, Aldh1l1-GFP) in the cortex at P90. Astrocyte morphology is labeled at single-cell resolution using AAV-PhP.eB-GfaABC1D-mCherry-CAAX. Blood vessels were labeled by td-tomato lectin (red). Astrocyte-blood vessel interactions were reconstructed using IMARIS. (F) Quantification of the number of Sox9+ cells in the cortex at P90. Each dot indicates an individual animal. (G) Overall complexity of astrocytes (Aldh1l1-GFP) was measured by Sholl analysis. n = 24–36 cells collected from 4–6 mice per genotype. **p < 0.01 by two-way ANOVA. (H) Astrocyte volume was reconstructed and quantified using IMARIS software. Each dot represents an individual astrocyte. n = 14–18 astrocytes collected from 4 mice per group. (I) Quantification of blood vessel area covered by astrocytes after IMARIS 3D reconstruction. Each dot represents an individual section. n = 13–17 sections collected from 4–5 mice per genotype. ****p < 0.0001 by Student’s t test. (J) Schematic of measuring astrocytic spontaneous Ca2+ signaling. (K) Representative images of astrocytic soma spontaneous Ca2+ activity. (L and M) Quantification of frequency (L) and amplitude (M) of GCaMP6f signal events in astrocyte soma and endfeet. Each dot represents an individual cell. n = 30–40 cells collected from 6–8 mice of each genotype. *p < 0.05 by Student’s t test. All data are presented as mean ± SEM.
Figure 2.
Figure 2.. Loss of Slc4a4 results in hyper-vascularization coupled with BBB leakage
(A) Blood vessel phenotype in the cortex at P90 was examined by in vivo lectin labeling and immunofluorescence staining of vasculature marker CD31. Astrocytic endfeet were labeled by AQP4. (B) Quantification of blood vessel volume from IMARIS 3D reconstruction. Each dot represents an individual section. n = 9 sections and collected from n = 3–4 animals per genotype. *p < 0.05 by Student’s t test. (C) A histogram of average blood diameter measurements in each genotype. n = 35–60 vessels collected from 4–5 animals per genotype. (D) qRT-PCR analysis of endothelial cell markers in the cortex. Each dot represents an individual animal. n = 3–5 animals per genotype. *p < 0.05, **p < 0.01 by Student’s t test. (E) Quantification of the number of loosely wrapped endfeet structures. Each dot represents an individual animal. n = 3–5 animals per genotype. *p < 0.05 by Student’s t test. (F) BBB leakage was assessed by Evans blue (indicates albumin leakage), fluorescein isothiocyanate (FITC)-conjugated dextran (3 kDa), and EZ-Link Sulfo-NHS-Biotin (indicates small-molecule leakage). (G) Representative images of stained biotin in the cortex. Yellow arrowheads indicate leakage of EZ-Link Sulfo-NHS-Biotin into the brain. (H) Extravasated Evans blue levels were quantified by colorimetric assays. Extravasated FITC-dextran and EZ-Link Sulfo-NHS-Biotin were quantified based on intensity in brain sections. Each dot represents an individual animal. n = 6–8 per genotype. ***p < 0.001 by Student’s t test. (I) Double immunofluorescence staining of tight-junction markers (ZO-1, Claudin-5) and endothelial cell marker (CD31) in the cortex. Empty arrowheads indicate vessels missing coverage by tight-junction proteins. (J and K) Quantification of the intensity of ZO-1 and Claudin-5 colocalized with CD31. Each dot represents an individual blood vessel. n = 6–8 vessels collected from 3 animals per genotype. *p < 0.05, **p < 0.01 by Student’s t test. All data are presented as mean ± SEM.
Figure 3.
Figure 3.. Slc4a4-deficient astrocytes exhibit impaired BBB remodeling after ischemic stroke
(A) Schematics of photothrombotic ischemic stroke (PTS) in WT and Slc4a4-icKO mice. Peri-lesion is defined as a 150-mm distance from the lesion border. (B) Single or double staining of Slc4a4 (in situ) and S100b (immunostaining) in the WT cortex after PTS. (C) Extracellular pH in the stroke lesions was measured by pHLIP-ICG dye (1 mg/kg). (D) Representative images of albumin leakage (Evans blue), hemorrhage, and gross histology (H&E) at 4 or 14 dpi. (E) Evans blue levels were determined by colorimetric assays. Each dot represents an individual animal. n = 5–7 per genotype. *p < 0.05 by Student’s t test. (F) Quantification of infarct size is based on H&E staining of serial 40-mm-thick brain sections at 4 and 14 dpi. Each dot represents an individual animal. n = 4–6 per genotype per time point. *p < 0.05, ****p < 0.0001 by Student’s t test. (G) Double immunofluorescence staining of tight-junction marker Claudin-5 and caveolae marker pCav-1 with endothelial cell marker (CD31) at the peri-lesion area at 4 dpi. Empty arrowheads indicate loss of Claudin-5 (Cldn5). (H) Quantification of tight-junctional markers (Cldn5, ZO-1) and caveolae markers (Cav-1, pCav-1) based on their intensity colocalized with CD31 in immunostaining. Each dot represents an individual blood vessel. n = 7–20 blood vessels collected from 3–6 animals per genotype with at least two vessels per animal. ***p < 0.001 by Student’s t test. All data are presented as mean ± SEM.
Figure 4.
Figure 4.. Loss of astrocytic Slc4a4 dampens reactive astrogliosis and astrocyte-BBB interaction after stroke
(A) Immunostaining of reactive astrocyte markers (GFAP, S100b) at the peri-lesion area at 4 dpi. S100b+ cells are co-labeled with BrdU to indicate local astrocyte proliferation. SVZ Sox9+ cells are co-labeled with BrdU to indicate SVZ astrocyte proliferation. (B) Whole-mount images of CLARITY-cleared mice brain at 4 dpi of PTS. Astrocytes were genetically labeled with Aldh1l1-GFP (green), and blood vessels were labeled with tomato lectin (red); 40-mm-thick sections were used for further IMARIS 3D reconstruction to visualize astrocyte-blood vessel interaction. (C) Quantification of GFAP intensity from immunostaining. Each dot represents an individual animal. n = 8 per genotype, **p < 0.01 by Student’s t test. (D) Quantification of total branch volume of reactive astrocytes from GFAP immunostaining. n = 9–19 cells collected from 3–5 mice per genotype. *p < 0.05 by Student’s t test. (E) Quantification of S100b+ and S100b+ BrdU+ cell number from immunostaining. Each dot represents an individual animal. n = 8–14 per genotype. **p < 0.01, ****p < 0.0001 by Student’s t test. (F) Quantification of the number of proliferating SVZ astrocytes (BrdU+; Sox9+). Each dot represents an individual animal. n = 6–7 animals per genotype. *p < 0.05 by Student’s t test. (G and H) Quantification of blood vessel volume (G) and volume covered by astrocyte processes (H) in the peri-lesion area at 4 dpi. Each dot represents an individual animal. n = 5–14 per genotype. **p < 0.01 by Student’s t test. All data are presented as mean ± SEM.
Figure 5.
Figure 5.. Loss of Slc4a4 upregulates expression of astrocytic CCL2 and endothelial CCR2 after ischemic stroke
(A) Conditioned medium (CM) was collected from primary WT and Slc4a4 KO astrocytes and subjected to LC-MS/MS-based unbiased proteomics and cytokine/chemokine array. (B) Angiogenic factors detected from LC-MS/MS-based unbiased proteomics. (C) Cytokine/chemokines changed in the CM from WT and Slc4a4 KO astrocytes. Pooled CM from three independent cultures per genotype were used (D) CCL2 level was measured by ELISA in CM collected under either normal or oxygen-glucose-deprivation (OGD) condition cortices from uninjured and stroked (1 dpi) brains from WT and Slc4a4-icKO mice. Each dot represents CM or cortices collected from an individual animal. n = 3–5 per genotype. *p < 0.05, **p < 0.01 by Student’s t test. In vivo astrocytic CCL2 expression after stroke at 4 dpi was quantified from double immunostaining. n = 17–21 cells collected from 3–5 mice per genotype. *p < 0.05 by Student’s t test. (E) Representative images of astrocytic CCL2 expression at 4 dpi by double immunostaining of CCL2/GFAP. (F and G) Endothelial CCR2 mRNA expression was visualized by RNA scope and CD31 staining and quantified by counts of CCR2+ puncta. Each dot represents an individual blood vessel. n = 49 vessels collected from 4 mice per genotype. ****p < 0.0001 by Student’s t test. (H and I) Representative images and quantification of endothelial CCR2 expression from double immunostaining. Each dot represents an individual animal. n = 4–5 per genotype. *p < 0.05 by Student’s t test. (J) Proposed model for the Slc4a4-CCL2-CCR2 axis regulating astrocyte-endothelial interaction. All data are presented as mean ± SEM.
Figure 6.
Figure 6.. Genetic inhibition of astrocyte-derived CCL2 rescues loss of Slc4a4-induced exacerbated BBB damage after ischemic stroke
(A) Experimental scheme of the PTS induction in temporally controlled astrocyte-specific conditional null alleles. Brains were then harvested and analyzed at 4 dpi. (B) Quantification of infarct size based on 2,3,5-triphenyltetrazolium chloride staining of serial 1-mm-thick brain sections at 4 dpi. Each dot represents an individual animal. n = 3–6 animals per group. ***p < 0.001, ****p < 0.0001 by two-way ANOVA. (C) Evans blue levels were determined by colorimetric assays. Each dot represents an individual animal. n = 3–4 per genotype. *p < 0.05, ***p < 0.001 by two-way ANOVA (D) Representative images of Evans blue leakage, endothelial junctional marker expression (Claudin-5+; CD31+), and endothelial pCav-1 at the peri-lesion area. Reactive astrocyte and blood vessel interactions were visualized and reconstructed by double fluorescence staining of S100b and CD31. (E) Quantification of CD31 intensity at the peri-lesion area. Each dot represents each individual animal. n = 3–9 animals per group. *p < 0.05, **p < 0.01 by two-way ANOVA. (F) Quantification of Claudin-5 intensity colocalized with CD31 at the peri-lesion area. Each dot represents each individual blood vessel. n = 5–16 blood vessels per animal collected from 5–6 animals per group. **p < 0.01, ****p < 0.0001 by two-way ANOVA. (G) Quantification pCav-1 intensity colocalized with CD31 at peri-lesion area. n = 28–55 blood vessels collected from N = 5–6 animals per group. ***p < 0.001, ****p < 0.0001 by two-way ANOVA. (H) Quantification of blood vessel area covered by astrocytes using IMARIS 3D reconstruction at the peri-lesion area. Each dot represents an individual section. n = 4–11 images collected from 4–5 animals per group. *p < 0.05, ****p < 0.0001 by two-way ANOVA. All data are presented as mean ± SEM.
Figure 7.
Figure 7.. Astrocytic CCL2 dysregulation by the loss of Slc4a4 is partially attributable to arginine metabolism dysregulation
(A and B) WT and Slc4a4-icKO mice were intraperitoneally injected with a pan-NOS inhibitor (L-NMMA, 10 mg/kg) from 1 to 3 dpi. Brains were harvested at 4 dpi for analysis of cortical arginine metabolites. Each dot represents an individual animal. n = 4–7 animals per group. *p < 0.05, **p < 0.01, ***p < 0.001 by one-way ANOVA. (C) Total NO levels in stroked cortices were measured by the total concentration of nitrite and nitrate using a colorimetric assay. Each dot represents an individual animal. n = 3–4 animals per group. *p < 0.05 by one-way ANOVA. (D) Quantification of infarct size based on 2,3,5-triphenyltetrazolium chloride staining of serial 1-mm-thick brain sections from stroked brains at 4 dpi. Data are presented as mean ± SEM. Each dot represents an individual animal. n = 3 animals per group. *p < 0.05 by two-way ANOVA. (E) Representative images of Evans blue, Claudin-5 colocalized with CD31, and pCav-1 colocalized with CD31 at the peri-lesion area in the brain. (F) Quantification of Evans blue leakage by colorimetric assay at 4 dpi. Each dot represents an individual animal. n = 3 animals per group. **p < 0.01, ***p < 0.010 by two-way ANOVA. (G and H) Quantification of (G) Claudin-5 colocalized with CD31, and (H) pCav-1 colocalized with CD31 at the peri-lesion area at 4 dpi. Each data point represents an individual blood vessel. n = 11–56 vessels collected from 3–5 animals per group. *p < 0.05, **p < 0.01, ****p < 0.0001 by one-way ANOVA. (I) In vivo astrocytic CCL2 expression after stroke at 4 dpi was quantified from double immunostaining. Each dot represents an individual animal. n = 4–7 mice per genotype. *p < 0.05, ****p < 0.0001 by Student’s t test. All data are presented as mean ± SEM.

Update of

References

    1. Daneman R, and Engelhardt B (2017). Brain barriers in health and disease. Neurobiol. Dis. 107, 1–3. 10.1016/j.nbd.2017.05.008. - DOI - PubMed
    1. Ronaldson PT, and Davis TP (2012). Blood-brain barrier integrity and glial support: mechanisms that can be targeted for novel therapeutic approaches in stroke. Curr. Pharmaceut. Des. 18, 3624–3644. 10.2174/138161212802002625. - DOI - PMC - PubMed
    1. Gorelick PB (2019). The global burden of stroke: persistent and disabling. Lancet Neurol. 18, 417–418. 10.1016/S1474-4422(19)30030-4. - DOI - PubMed
    1. Hankey GJ (2017). Stroke. Lancet (London, England) 389, 641–654. 10.1016/S0140-6736(16)30962-X. - DOI - PubMed
    1. Biswas S, Cottarelli A, and Agalliu D (2020). Neuronal and glial regulation of CNS angiogenesis and barriergenesis. Development 147, dev182279. 10.1242/dev.182279. - DOI - PMC - PubMed