. 2024 May 6;26(Supplement_3):iii1-iii53.
doi: 10.1093/neuonc/noae047.

CBTRUS Statistical Report: American Brain Tumor Association & NCI Neuro-Oncology Branch Adolescent and Young Adult Primary Brain and Other Central Nervous System Tumors Diagnosed in the United States in 2016-2020

Affiliations

CBTRUS Statistical Report: American Brain Tumor Association & NCI Neuro-Oncology Branch Adolescent and Young Adult Primary Brain and Other Central Nervous System Tumors Diagnosed in the United States in 2016-2020

Mackenzie Price et al. Neuro Oncol. .

Abstract

Recent analyses have shown that, whereas cancer survival overall has been improving, it has not improved for adolescents and young adults ages 15-39 years (AYA). The clinical care of AYA with primary brain and other central nervous system (CNS) tumors (BT) is complicated by the fact that the histopathologies of such tumors in AYA differ from their histopathologies in either children (ages 0-14 years) or older adults (ages 40+ years). The present report, as an update to a 2016 publication from the Central Brain Tumor Registry of the United States and the American Brain Tumor Association, provides in-depth analyses of the epidemiology of primary BT in AYA in the United States and is the first to provide biomolecular marker-specific statistics and prevalence by histopathology for both primary malignant and non-malignant BT in AYA. Between 2016 and 2020, the annual average age-specific incidence rate (AASIR) of primary malignant and non-malignant BT in AYA was 12.00 per 100,000 population, an average of 12,848 newly diagnosed cases per year. During the same period, an average of 1,018 AYA deaths per year were caused by primary malignant BT, representing an annual average age-specific mortality rate of 0.96 per 100,000 population. When primary BT were categorized by histopathology, pituitary tumors were the most common (36.6%), with an AASIR of 4.34 per 100,000 population. Total incidence increased with age overall; when stratified by sex, the incidence was higher in females than males at all ages. Incidence rates for all primary BT combined and for non-malignant tumors only were highest for non-Hispanic American Indian/Alaska Native individuals, whereas malignant tumors were more frequent in non-Hispanic White individuals, compared with other racial/ethnic groups. On the basis of histopathology, the most common molecularly defined tumor was diffuse glioma (an AASIR of 1.51 per 100,000). Primary malignant BT are the second most common cause of cancer death in the AYA population. Incidence rates of primary BT overall, as well as specific histopathologies, vary significantly by age. Accordingly, an accurate statistical assessment of primary BT in the AYA population is vital for better understanding the impact of these tumors on the US population and to serve as a reference for afflicted individuals, for researchers investigating new therapies, and for clinicians treating these patients.


Figures

Fig. 1
Fig. 1
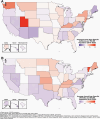
2016–2020 Average Annual Age-Specific Incidence and Mortalitya for Primary Brain and Other CNS Tumors in AYA Ages 15–39 Yearsb
Fig. 2
Fig. 2
2016–2020 Average Annual Age-Specific (A) Incidence and (B) Mortalitya due to Primary Brain and Other CNS Tumors in AYA Ages 15–39 Yearsb, by Central Cancer Registry
Fig. 3
Fig. 3
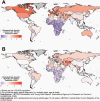
2020 Country- and Age-Specific (A) Incidence and (B) Mortalitya due to Malignant Primary Brain and Other CNS Tumors in AYA Ages 15–39 Yearsb
Fig. 4
Fig. 4
2016–2020 Distributiona of All Primary Brain and Other CNS Tumors in AYA Ages 15–39 Years (5-Year Total=64,238; Annual Average Case Count=12,848), by (A) Tumor Site and (B) Histopathology
Fig. 5
Fig. 5
2016–2020 Distributiona of (A) Malignant and (B) Non-Malignant Primary Brain and Other CNS Tumors in AYA Ages 15–39 Years (5-Year Total=64,238; Annual Average Case Count=12,848), by Histopathology
Fig. 6
Fig. 6
2016–2020 Age-Specific Incidence Ratesa with 95% CIs for All (A) Malignant and (B) Non-Malignant Primary Brain and Other CNS Tumor Histopathologies in AYA Ages 15–39 Years, by Sex
Fig. 7
Fig. 7
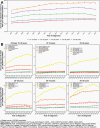
2016–2020 Age-Specific Incidence Ratesa and Incidence Rate Ratios with 95% CIs for Selected Primary Brain and Other CNS Tumor Histopathologies in AYA Ages 15–39 Years, by Sex
Fig. 8
Fig. 8
2016–2020 Age-Specific Incidence Ratesa and Incidence Rate Ratios with 95% CIs by Race/Ethnicity for Selected Primary Brain and Other CNS Tumor Histopathologies in AYA Ages 15–39 Years
Fig. 9
Fig. 9
2016–2020 Age-Specific Incidence Ratesa and Incidence Rate Ratios with 95% CIs by Urbanicity for Selected Primary Brain and Other CNS Tumor Histopathologies in AYA Ages 15–39 Years
Fig. 10
Fig. 10
2018–2020 Frequency of IDH Mutationsa in AYA Ages 15–39 Years, by WHO Grade for Selected Astrocytoma Histopathologiesb
Fig. 11
Fig. 11
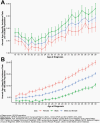
2004–2019 Trends by AYA Age Group at Diagnosis for (A) Annual Average Age-Specific Incidence Ratesa of All Primary Brain and Other CNS Tumors; and (B) Annual Average Age-Specific Incidence Rates and Annual Percent Change for the Five Most Common Primary Brain and Other CNS Tumor Histopathologies
Fig. 12
Fig. 12
2004–2019 Annual Age-Specific Incidence Ratea Trends and Annual Percent Change for All Malignant and Non-Malignant Primary Brain and Other CNS Tumors in AYA Ages 15–39 Years, Compared with Other Common Cancers
Fig. 13
Fig. 13
2004–2019 Average Annual Age-Specific Incidence Ratea Trends and Annual Percent Change for All Primary Brain and Other CNS Tumors in AYA Ages 15–39 Years, by Race/Ethnicity Group
Fig. 14
Fig. 14
2016–2020 Crude Mortality Ratesa for Malignant Primary Brain and Other CNS Tumors in AYA Ages 15–39 Years at Death, by Sex and Age at Death
Fig. 15
Fig. 15
1969–2019 Annual Average Age-Specific Mortality Ratesa and Mortality Trends for Malignant Primary Brain and Other CNS Tumors in AYA Ages 15–39 Years at Death, Compared with Other Common AYA Cancers
Fig. 16
Fig. 16
1969–2019 Annual Average Age-Specific Mortality Ratesa and Mortality Trends for Malignant Primary Brain and Other CNS Tumors in AYA Ages 15–39 Years at Death, by Age Group at Death
Fig. 17
Fig. 17
2016–2020 Annual Average Age-Specific Incidence Ratesa and Annual Average Case Counts for the Primary Brain and Other CNS Tumors and other Common Cancers in AYA Ages 15–39 Years, Overall and by Age Group at Diagnosis
Fig. 18
Fig. 18
2016–2020 Annual Average Age-Specific Mortality Ratesa and Annual Average Death Counts for the Top Five Causes of Death Among AYA Ages 15–39 Years at Death, Overall, and by AYA Age Group at Death
Fig. 19
Fig. 19
2001–2019 (A) Kaplan-Meier Survival Curve for the Five Most Common Malignant Histopathologies in AYA Ages 15–39 Years at Diagnosis and (B) Hazard Ratios and 95% CIs for Sex, and Race/Ethnicity for the Five Most Common Histopathologies in AYA Ages 15–39 Years
Fig. 20
Fig. 20
2024 Estimated US Cases of (A) the Eight Most Prevalent Cancers in Children and Adolescents, and (B) by the Ten Most Prevalent Primary Brain and Other CNS Histopathologies in AYA Ages 15–39 Years in 2024
Fig. 21
Fig. 21
Pediatric Brain Tumor Cases as a Proportion of (A) AYA Living with a Brain or Other CNS Tumor in 2024 and (B) AYA Deaths Due to a Primary Brain or Other CNS Tumor

References

    1. Ostrom QT, Price M, Neff C, et al.CBTRUS Statistical Report: Primary Brain and Other Central Nervous System Tumors Diagnosed in the United States in 2016-2020. Neuro Oncol. 2023; 25(Supplement_4):iv1-iv99. - PMC - PubMed
    1. Howlader N, Noone A, Krapcho M, et al.SEER Cancer Statistics Review, 1975-2012, National Cancer Institute. Bethesda, MD, http://seer.cancer.gov/csr/1975_2012/, based on November 2014 SEER data submission, posted to the SEER web site, April 2015. 2015.
    1. Bleyer A, Barr R, Hayes-Lattin B, et al.The distinctive biology of cancer in adolescents and young adults. Nat. Rev. Cancer. 2008; 8(4):288-298. - PubMed
    1. Tricoli JV, Seibel NL, Blair DG, Albritton K, Hayes-Lattin B.. Unique characteristics of adolescent and young adult acute lymphoblastic leukemia, breast cancer, and colon cancer. J. Natl. Cancer Inst. 2011; 103(8):628-635. - PMC - PubMed
    1. Ostrom QT, Price M, Ryan K, et al.CBTRUS Statistical Report: Pediatric Brain Tumor Foundation Childhood and Adolescent Primary Brain and Other Central Nervous System Tumors Diagnosed in the United States in 2014-2018. Neuro Oncol. 2022; 24(Suppl 3):iii1-iii38. - PMC - PubMed

Publication types