

Comparing fatal crash risk factors by age and crash type by using machine learning techniques
- PMID: 38709785
- PMCID: PMC11073736
- DOI: 10.1371/journal.pone.0302171
Comparing fatal crash risk factors by age and crash type by using machine learning techniques
Abstract
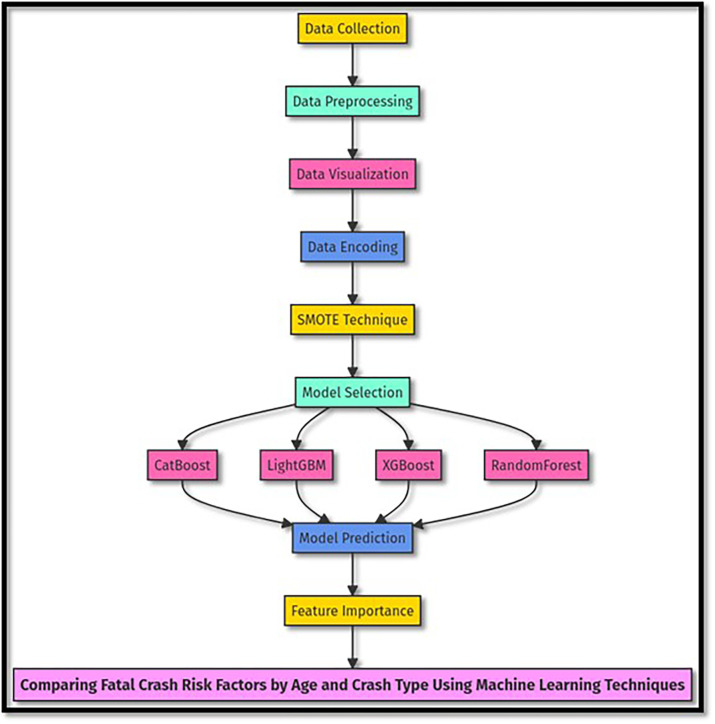
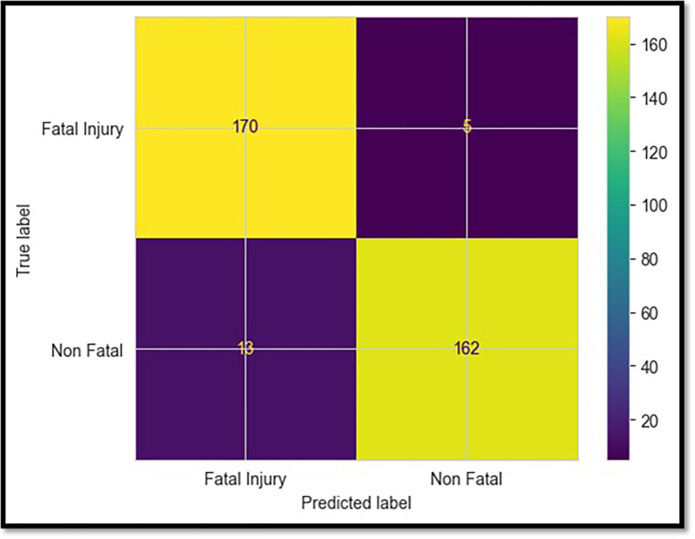
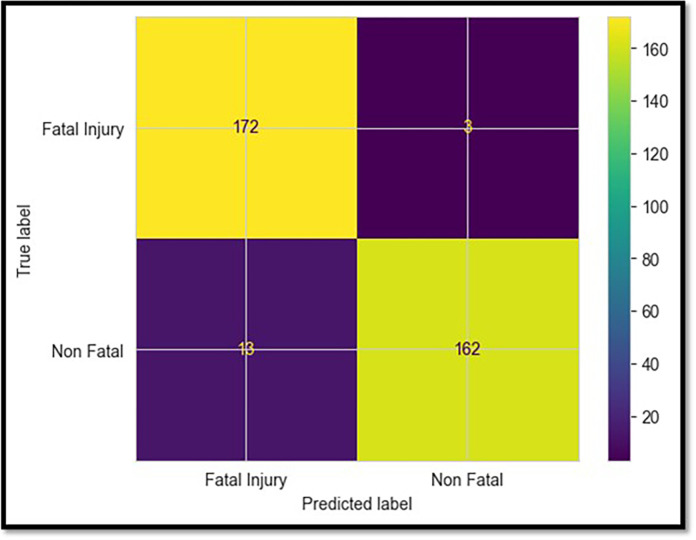
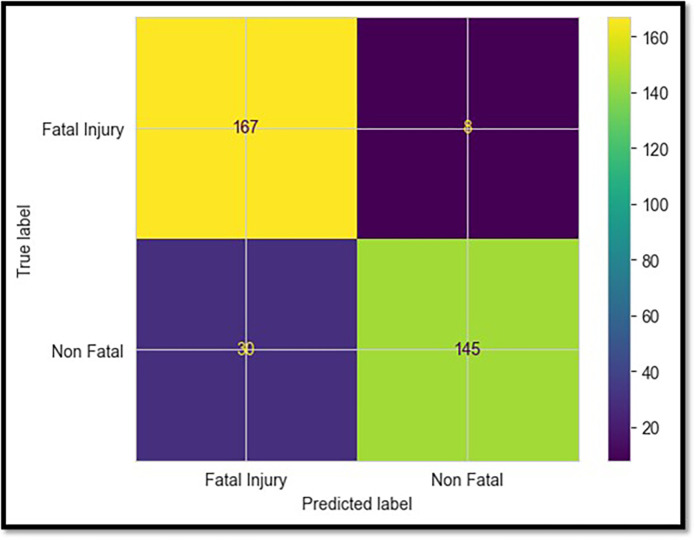
This study aims to use machine learning methods to examine the causative factors of significant crashes, focusing on accident type and driver's age. In this study, a wide-ranging data set from Jeddah city is employed to look into various factors, such as whether the driver was male or female, where the vehicle was situated, the prevailing weather conditions, and the efficiency of four machine learning algorithms, specifically XGBoost, Catboost, LightGBM and RandomForest. The results show that the XGBoost Model (accuracy of 95.4%), the CatBoost model (94% accuracy), and the LightGBM model (94.9% accuracy) were superior to the random forest model with 89.1% accuracy. It is worth noting that the LightGBM had the highest accuracy of all models. This shows various subtle changes in models, illustrating the need for more analyses while assessing vehicle accidents. Machine learning is also a transforming tool in traffic safety analysis while providing vital guidelines for developing accurate traffic safety regulations.
Copyright: © 2024 Alshehri et al. This is an open access article distributed under the terms of the Creative Commons Attribution License, which permits unrestricted use, distribution, and reproduction in any medium, provided the original author and source are credited.
Conflict of interest statement
The authors have declared that no competing interests exist.
Figures


Similar articles
-
Age-related differences in fatal intersection crashes in the United States.Accid Anal Prev. 2017 Feb;99(Pt A):20-29. doi: 10.1016/j.aap.2016.10.030. Epub 2016 Nov 14. Accid Anal Prev. 2017. PMID: 27855312
-
Design and experiment verification of a novel analysis framework for recognition of driver injury patterns: From a multi-class classification perspective.Accid Anal Prev. 2018 Nov;120:152-164. doi: 10.1016/j.aap.2018.08.011. Epub 2018 Aug 20. Accid Anal Prev. 2018. PMID: 30138770
-
Predicting and factor analysis of rider injury severity in two-wheeled motorcycle and vehicle crash accidents based on an interpretable machine learning framework.Traffic Inj Prev. 2024;25(2):194-201. doi: 10.1080/15389588.2023.2284111. Epub 2024 Jan 2. Traffic Inj Prev. 2024. PMID: 38019553
-
Effect of driver's age and side of impact on crash severity along urban freeways: a mixed logit approach.J Safety Res. 2013 Sep;46:67-76. doi: 10.1016/j.jsr.2013.04.002. Epub 2013 May 1. J Safety Res. 2013. PMID: 23932687
-
Multivariate copula temporal modeling of intersection crash consequence metrics: A joint estimation of injury severity, crash type, vehicle damage and driver error.Accid Anal Prev. 2019 Apr;125:188-197. doi: 10.1016/j.aap.2019.01.036. Epub 2019 Feb 13. Accid Anal Prev. 2019. PMID: 30771588 Review.
References
-
- Alkahtani KF, Abdel-Aty M, Lee J (2019) A zonal level safety investigation of pedestrian crashes in Riyadh, Saudi Arabia. Int J Sustain Transp 13:255–267. 10.1080/15568318.2018.1463417 - DOI
-
- Mohammed S, Alkhereibi AH, Abulibdeh A, et al. (2023) GIS-based spatiotemporal analysis for road traffic crashes; in support of sustainable transportation Planning. Transp Res Interdiscip Perspect 20:100836. 10.1016/j.trip.2023.100836 - DOI
-
- Shaaban K, Siam A, Badran A (2021) Analysis of Traffic Crashes and Violations in a Developing Country. Transp Res Procedia 55:1689–1695. 10.1016/j.trpro.2021.07.160 - DOI
-
- Jakobsen MD, Glies Vincents Seeberg K, Møller M, et al. (2023) Influence of occupational risk factors for road traffic crashes among professional drivers: systematic review. Transp Rev 43:533–563. 10.1080/01441647.2022.2132314 - DOI
Publication types
MeSH terms
LinkOut - more resources
Full Text Sources
