. 2024 May 6;19(5):e0295971.
doi: 10.1371/journal.pone.0295971. eCollection 2024.

Annotation of nuclear lncRNAs based on chromatin interactions

Affiliations

Annotation of nuclear lncRNAs based on chromatin interactions

Saumya Agrawal et al. PLoS One. .

Abstract

The human genome is pervasively transcribed and produces a wide variety of long non-coding RNAs (lncRNAs), constituting the majority of transcripts across human cell types. Some specific nuclear lncRNAs have been shown to be important regulatory components acting locally. As RNA-chromatin interaction and Hi-C chromatin conformation data showed that chromatin interactions of nuclear lncRNAs are determined by the local chromatin 3D conformation, we used Hi-C data to identify potential target genes of lncRNAs. RNA-protein interaction data suggested that nuclear lncRNAs act as scaffolds to recruit regulatory proteins to target promoters and enhancers. Nuclear lncRNAs may therefore play a role in directing regulatory factors to locations spatially close to the lncRNA gene. We provide the analysis results through an interactive visualization web portal at https://fantom.gsc.riken.jp/zenbu/reports/#F6_3D_lncRNA.


Conflict of interest statement

The authors have declared that no competing interests exist.

Figures

Fig 1
Fig 1. Comparison between nuclear lncRNA Hi-C genomic interaction and intra-chromosomal RNA-chromatin interactions in iPSC.
(A) Cumulative distribution plot showing the degree of Hi-C interactions between the nuclear lncRNA gene and chromatin regions where the lncRNA binds. (B) The relationships among sensitivity, specificity, and degree of Hi-C interaction to identify the RNA-chromatin interaction using Hi-C genomic interactions. The x-axis represents sensitivity and y-axis represents 100%-specificity to identify RNA-chromatin interactions using Hi-C interactions. The degree of Hi-C interaction is shown next to each dot. (C) Contingency table showing enrichment of RNA-chromatin interactions in genomic regions supported by Hi-C interactions (top panel) and random interactions (lower panel) for the two degrees of Hi-C interactions calculated using the two-sided Fisher’s exact test. (D) Linear genomic distance between the lncRNA gene and its RNA-chromatin interactions in the same and different A/B. The x-axis represents the A/B compartment size, and the y-axis represents the genomic distance between the lncRNA gene and RNA-chromatin interaction. Each dot is one RNA-chromatin interaction. (E) Linear genomic distance between lncRNA gene and its RNA-chromatin interaction for the individual degree of separation based on Hi-C interactions.
Fig 2
Fig 2. Comparison between nuclear lncRNA Hi-C genomic interaction and intra-chromosomal RNA-chromatin interactions in K562.
See the caption of Fig 1 for a description of these panels.
Fig 3
Fig 3. Nuclear-lncRNAs candidate target genes.
(A) Schematic diagram showing the workflow to identify the candidate target genes of a lncRNA using Hi-C. (B) Enrichment of upregulated or downregulated genes in the target genes upon lncRNA knock-down in dermal fibroblasts calculated using the two-sided Fisher exact test. The y-axis represents log2 (Odds ratio). A positive value represents enrichment (Odds ratio >1) of upregulated genes, and in contrast, a negative value (Odds ratio <1) represents the enrichment of downregulated genes in candidate target genes due to the lncRNA knock-down (x-axis).
Fig 4
Fig 4. RBP binding nuclear lncRNAs.
(A) Enrichment of lncRNAs with RNA features U1 repeat motif count and SIRLOIN motif count in the nuclear lncRNAs. Significance was calculated using a one-tailed Fisher’s exact test. (B) nuclear-to-cytoplasmic expression ratio distribution for lncRNAs with RBP binding in eCLIP data and lncRNAs without RBPs binding. Each panel shows one cell type for which RBP eCLIP data is available. The significance of the difference in nuclear-to-cytoplasmic expression ratio between two groups of lncRNAs was determined using a one-tailed Mann-Whitney U test. The cell type and P-value of significance are shown in the title. (C) Significance of enrichment of nuclear lncRNAs with RBP binding sites whose target genes are differentially expressed upon RBP knockdown compared to lncRNAs without binding sites for the RBP. Each panel shows one cell type. The y-axis shows -log10 (P-values) calculated using the one-tailed Fisher exact test. A positive value represents enrichment (Odds ratio >1), while the negative value (Odds ratio <1) represents depletion of lncRNAs with RBP binding sites.
Fig 5
Fig 5. Steps to identify the nuclear lncRNAs that are bound to RBP that are also present at their candidate target gene promoters.
The number of lncRNAs for each category is shown in parentheses. The data used for each step are shown in blue.
Fig 6
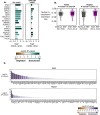
Fig 6. Hi-C and RNA-chromatin interactions for lncRNA ENSG00000272462.
(A) The top track shows the genomic location of the interaction, followed by tracks showing the Hi-C annotated interactions between lncRNA ENSG00000272462 and its candidate target genes in different cell types. (B) RNA-chromatin interactions for lncRNAs in different cell types. The colors of interaction tracks for iPSC, MM1S and K562 cell types show RNA-chromatin interactions at regions with candidate target genes and presence or absence of RBPs at the promoter of these candidate targets in K562. The number of each type of interaction for all three cell types is shown in the tables below the figure.

References

    1. Hon C-C, Ramilowski JA, Harshbarger J, Bertin N, Rackham OJL, Gough J, et al.. An atlas of human long non-coding RNAs with accurate 5’ ends. Nature. 2017;543: 199–204. doi: 10.1038/nature21374 - DOI - PMC - PubMed
    1. Holmes DS, Mayfield JE, Sander G, Bonner J. Chromosomal RNA: its properties. Science. 1972;177: 72–74. doi: 10.1126/science.177.4043.72 - DOI - PubMed
    1. Carninci P, Kasukawa T, Katayama S, Gough J, Frith MC, Maeda N, et al.. The transcriptional landscape of the mammalian genome. Science. 2005;309: 1559–1563. doi: 10.1126/science.1112014 - DOI - PubMed
    1. Kapranov P, Cheng J, Dike S, Nix DA, Duttagupta R, Willingham AT, et al.. RNA maps reveal new RNA classes and a possible function for pervasive transcription. Science. 2007;316: 1484–1488. doi: 10.1126/science.1138341 - DOI - PubMed
    1. De Hoon M, Shin JW, Carninci P. Paradigm shifts in genomics through the FANTOM projects. Mamm Genome. 2015;26: 391–402. doi: 10.1007/s00335-015-9593-8 - DOI - PMC - PubMed

Publication types