. 2024 May 6;20(5):e1011200.
doi: 10.1371/journal.pcbi.1011200. eCollection 2024 May.

Challenges of COVID-19 Case Forecasting in the US, 2020-2021

Velma K Lopez  1 Estee Y Cramer  2 Robert Pagano  3 John M Drake  4 Eamon B O'Dea  4 Madeline Adee  5 Turgay Ayer  6 Jagpreet Chhatwal  7 Ozden O Dalgic  8 Mary A Ladd  5 Benjamin P Linas  9 Peter P Mueller  7 Jade Xiao  6 Johannes Bracher  10 Alvaro J Castro Rivadeneira  2 Aaron Gerding  2 Tilmann Gneiting  11 Yuxin Huang  2 Dasuni Jayawardena  2 Abdul H Kanji  2 Khoa Le  2 Anja Mühlemann  12 Jarad Niemi  13 Evan L Ray  2 Ariane Stark  2 Yijin Wang  2 Nutcha Wattanachit  2 Martha W Zorn  2 Sen Pei  14 Jeffrey Shaman  14 Teresa K Yamana  14 Samuel R Tarasewicz  15 Daniel J Wilson  15 Sid Baccam  16 Heidi Gurung  16 Steve Stage  17 Brad Suchoski  16 Lei Gao  18 Zhiling Gu  13 Myungjin Kim  19 Xinyi Li  20 Guannan Wang  21 Lily Wang  18 Yueying Wang  22 Shan Yu  23 Lauren Gardner  24 Sonia Jindal  24 Maximilian Marshall  24 Kristen Nixon  24 Juan Dent  25 Alison L Hill  24 Joshua Kaminsky  25 Elizabeth C Lee  25 Joseph C Lemaitre  26 Justin Lessler  27 Claire P Smith  25 Shaun Truelove  25 Matt Kinsey  28 Luke C Mullany  28 Kaitlin Rainwater-Lovett  28 Lauren Shin  28 Katharine Tallaksen  28 Shelby Wilson  28 Dean Karlen  29 Lauren Castro  30 Geoffrey Fairchild  30 Isaac Michaud  30 Dave Osthus  30 Jiang Bian  31 Wei Cao  31 Zhifeng Gao  31 Juan Lavista Ferres  31 Chaozhuo Li  31 Tie-Yan Liu  31 Xing Xie  31 Shun Zhang  31 Shun Zheng  31 Matteo Chinazzi  32 Jessica T Davis  32 Kunpeng Mu  32 Ana Pastore Y Piontti  32 Alessandro Vespignani  32 Xinyue Xiong  32 Robert Walraven  33 Jinghui Chen  34 Quanquan Gu  34 Lingxiao Wang  34 Pan Xu  34 Weitong Zhang  34 Difan Zou  34 Graham Casey Gibson  30 Daniel Sheldon  2 Ajitesh Srivastava  35 Aniruddha Adiga  23 Benjamin Hurt  23 Gursharn Kaur  23 Bryan Lewis  23 Madhav Marathe  23 Akhil Sai Peddireddy  36 Przemyslaw Porebski  23 Srinivasan Venkatramanan  23 Lijing Wang  37 Pragati V Prasad  1 Jo W Walker  1 Alexander E Webber  1 Rachel B Slayton  1 Matthew Biggerstaff  1 Nicholas G Reich  2 Michael A Johansson  1
Affiliations

Challenges of COVID-19 Case Forecasting in the US, 2020-2021

Velma K Lopez et al. PLoS Comput Biol. .

Abstract

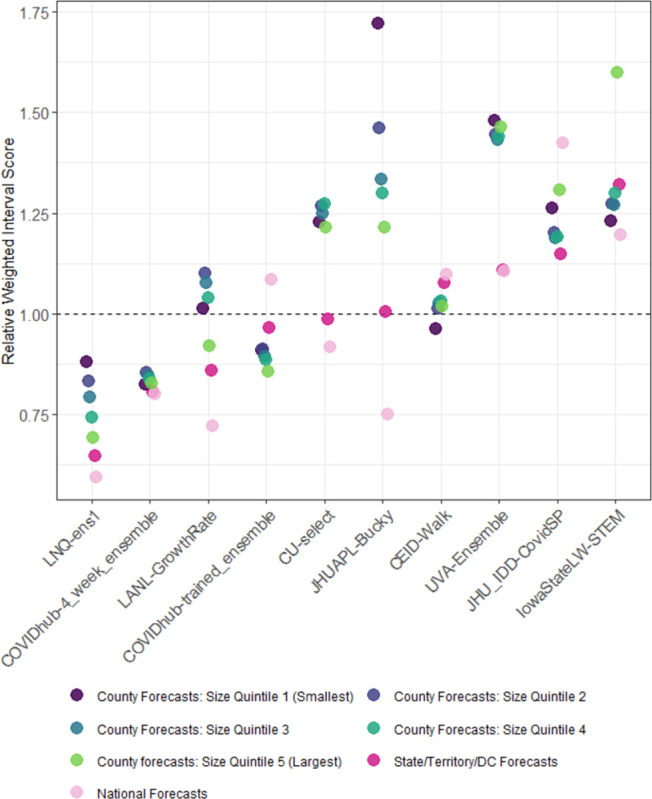
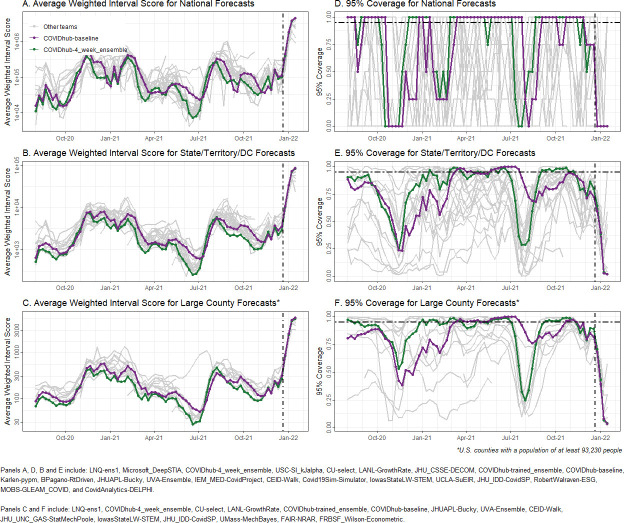
During the COVID-19 pandemic, forecasting COVID-19 trends to support planning and response was a priority for scientists and decision makers alike. In the United States, COVID-19 forecasting was coordinated by a large group of universities, companies, and government entities led by the Centers for Disease Control and Prevention and the US COVID-19 Forecast Hub (https://covid19forecasthub.org). We evaluated approximately 9.7 million forecasts of weekly state-level COVID-19 cases for predictions 1-4 weeks into the future submitted by 24 teams from August 2020 to December 2021. We assessed coverage of central prediction intervals and weighted interval scores (WIS), adjusting for missing forecasts relative to a baseline forecast, and used a Gaussian generalized estimating equation (GEE) model to evaluate differences in skill across epidemic phases that were defined by the effective reproduction number. Overall, we found high variation in skill across individual models, with ensemble-based forecasts outperforming other approaches. Forecast skill relative to the baseline was generally higher for larger jurisdictions (e.g., states compared to counties). Over time, forecasts generally performed worst in periods of rapid changes in reported cases (either in increasing or decreasing epidemic phases) with 95% prediction interval coverage dropping below 50% during the growth phases of the winter 2020, Delta, and Omicron waves. Ideally, case forecasts could serve as a leading indicator of changes in transmission dynamics. However, while most COVID-19 case forecasts outperformed a naïve baseline model, even the most accurate case forecasts were unreliable in key phases. Further research could improve forecasts of leading indicators, like COVID-19 cases, by leveraging additional real-time data, addressing performance across phases, improving the characterization of forecast confidence, and ensuring that forecasts were coherent across spatial scales. In the meantime, it is critical for forecast users to appreciate current limitations and use a broad set of indicators to inform pandemic-related decision making.


Conflict of interest statement

I have read the journal’s policy and the authors of this manuscript have the following competing interests: APP report grants from Metabiota Inc outside the submitted work. J.S. and Columbia University declare partial ownership of SK Analytics. No other authors have competing interests to declare.

Figures

Fig 1
Fig 1
Weekly incident reported COVID-19 cases per 100K population, nationally (in black) and per state/territory/DC (in gray), over time in panel A. Panel B shows a subset of COVIDhub-4_week_ensemble forecasts (in green) over time, with the median predictions represented as lines and points and the 95% prediction intervals in bands. Reported incident cases (counts per week) are shown in gray. In both plots, the black, dashed vertical line shows the date that public communication of the case forecasts was paused.
Fig 2
Fig 2. Percent of weeks with complete submissions for all sets of team forecasts, scaled, pairwise relative Weighted Interval Score (rWIS; see Methods for description), observed 95% prediction interval coverage, by geographical scale of submitted forecasts.
Teams are sorted by increasing state/territory/DC rWIS values.
Fig 3
Fig 3
Expected and observed coverage rates for central 50%, 80% and 95% prediction intervals aggregated over time and horizon for national forecasts (panel A), state/territory/DC forecasts (panel B), and the largest county forecasts (panel C). The dashed line represents optimal expected coverage. Team forecasts that had closer to nominal coverage than the COVIDhub-4_week_ensemble model at all three coverage levels are labeled on the right side of the plots.
Fig 4
Fig 4. Scaled, pairwise relative Weighted Interval Score (rWIS) (see Methods for description) by spatial scale for sets of team forecasts that submitted forecasts for the US nation, states/territories/DC, and all US counties.
WIS is averaged across all horizons. The COVIDhub-baseline model has, by definition, a rWIS of 1 (horizontal dashed line). Teams are ordered by increasing state/territory/DC rWIS with the most accurate model on the left. Points for each team are staggered horizontally to show overlapping WIS values.
Fig 5
Fig 5. Scaled, pairwise relative Weighted Interval Score (rWIS; see Methods for description) by location for national and state/territory/DC forecasts, averaged across all horizons through the entire analysis period.
National estimates are displayed first, followed by jurisdictions in alphabetical order. Team forecasts are ordered by increasing average state/territory/DC rWIS.
Fig 6
Fig 6. Forecast accuracy over time, aggregated by geographic units, forecast horizon, and prediction date.
Panels A-C show average Weighted Interval Score (WIS); panels D-F show 95% prediction interval coverage. The black, dashed vertical line in all panels shows the date that public communication of the case forecasts was paused. The black, dashed horizontal line in panels D-F shows nominal 95% prediction interval coverage. National level forecasts are presented in A and D, state/territory/DC forecasts in B and E and large county forecasts in C and F.
Fig 7
Fig 7
Estimated marginal mean Weighted Interval Score (WIS) and 95% confidence intervals for mean cases from team-specific GEE models for all 51 jurisdictions (Panel A). The 95% confidence intervals for the COVIDhub-baseline model are shown in dashed red vertical lines. Panel B presents each team’s estimated marginal mean WIS per phase, scaled to the COVIDhub-baseline model’s estimated marginal mean WIS for all epidemic phases. Teams with higher estimated marginal mean WIS values (i.e., greater than 1.0) are presented in shades of orange while teams with lower estimated marginal mean WIS (i.e., less than 1.0) are shown in shades of green. Forecasts for a team in a particular phase are marked with an asterisk (*) if the 80% confidence interval of the expected WIS outcome (normalized and on the log scale) was estimated by a model to be lower than the average expected WIS of the COVIDhub-baseline model across all phases. Panel C shows each team’s mean 95% prediction interval coverage in each epidemic phase.
Fig 8
Fig 8
Percent of forecasts with predicted increasing trajectory per epidemic phase (Panel A), predicted stable or uncertain trajectory per epidemic phase (Panel B), and predicted decreasing trajectory per epidemic phase (Panel C). In each plot, epidemic phase labels are in bold when they correspond with the predicted direction of the forecast.

References

    1. Biggerstaff M, Johansson M, Alper D, Brooks LC, Chakraborty P, Farrow DC, et al.. Results from the second year of a collaborative effort to forecast influenza seasons in the United States. Epidemics. 2018. Sep 1;24:26–33. doi: 10.1016/j.epidem.2018.02.003 - DOI - PMC - PubMed
    1. McGowan CJ, Biggerstaff M, Johansson M, Apfeldorf KM, Ben-Nun M, Brooks L, et al.. Collaborative efforts to forecast seasonal influenza in the United States, 2015–2016. Sci Rep 2019 91. 2019. Jan 24;9(1):1–13. doi: 10.1038/s41598-018-36361-9 - DOI - PMC - PubMed
    1. Reich NG, Brooks LC, Fox SJ, Kandula S, McGowan CJ, Moore E, et al.. A collaborative multiyear, multimodel assessment of seasonal influenza forecasting in the United States. Proc Natl Acad Sci U S A. 2019. Feb 19;116(8):3146–54. doi: 10.1073/pnas.1812594116 - DOI - PMC - PubMed
    1. Johansson MA, Apfeldorf KM, Dobson S, Devita J, Buczak AL, Baugher B, et al.. An open challenge to advance probabilistic forecasting for dengue epidemics. Proc Natl Acad Sci. 2019. Nov 26;116(48):24268–74. doi: 10.1073/pnas.1909865116 - DOI - PMC - PubMed
    1. Holcomb KM, Barker CM, Keyel Wadsworth Center Matteo Marcantonio AC, Childs ML, Gorris ME, Hamins-Puértolas M, et al.. Evaluation of an open forecasting challenge to assess skill of West Nile virus neuroinvasive disease prediction. 2022. Aug 26 [cited 2022 Dec 16]; Available from: https://www.researchsquare.com. - PMC - PubMed