. 2024 Jul 8;52(12):7225-7244.
doi: 10.1093/nar/gkae319.

PRMT5-mediated arginine methylation of FXR1 is essential for RNA binding in cancer cells

Affiliations

PRMT5-mediated arginine methylation of FXR1 is essential for RNA binding in cancer cells

Anitha Vijayakumar et al. Nucleic Acids Res. .

Abstract

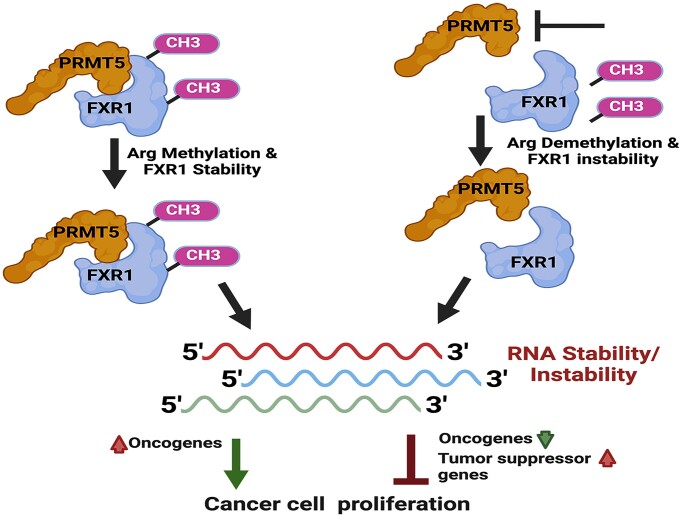
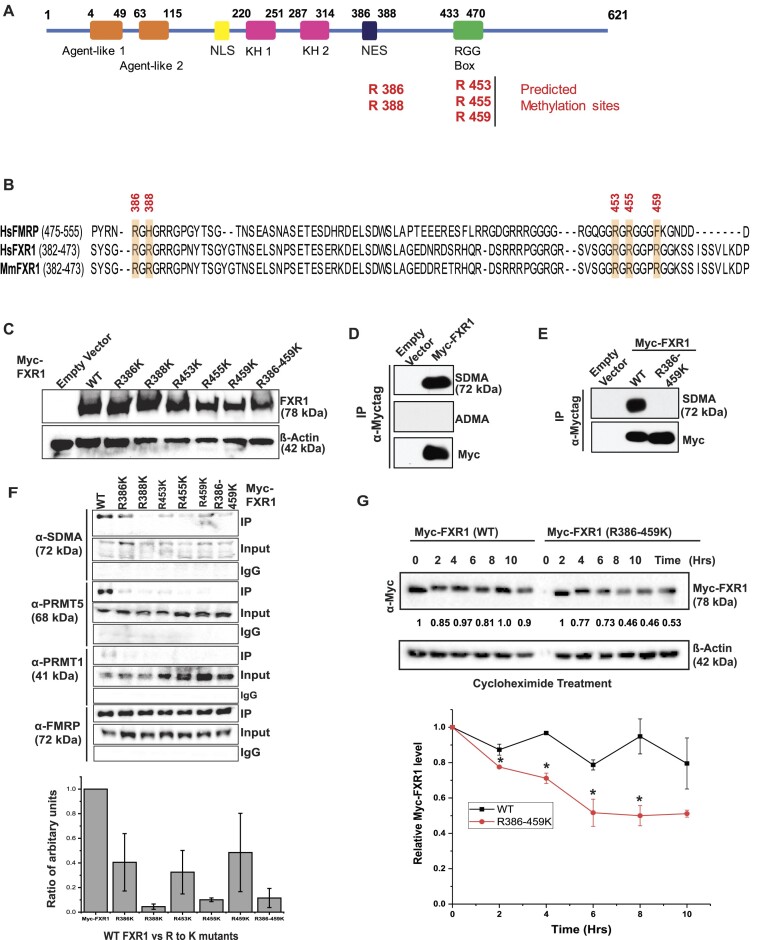
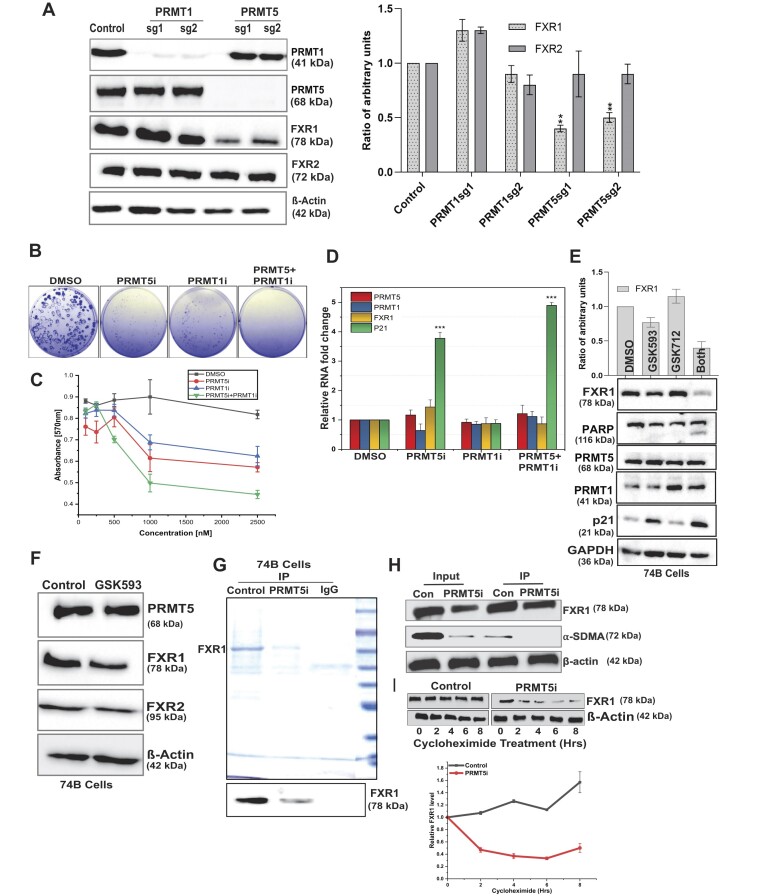
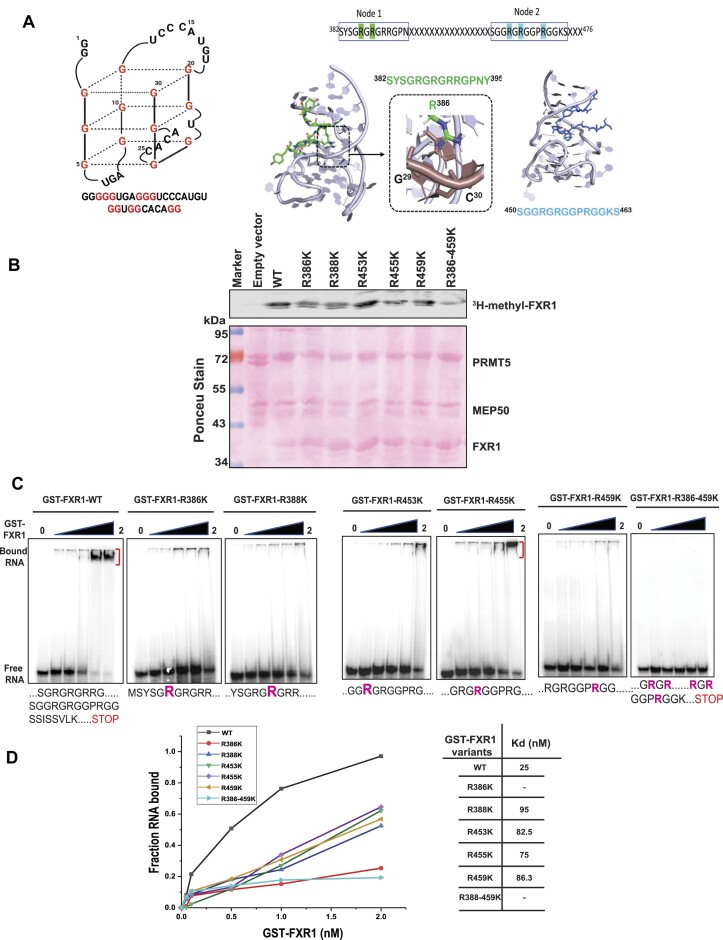
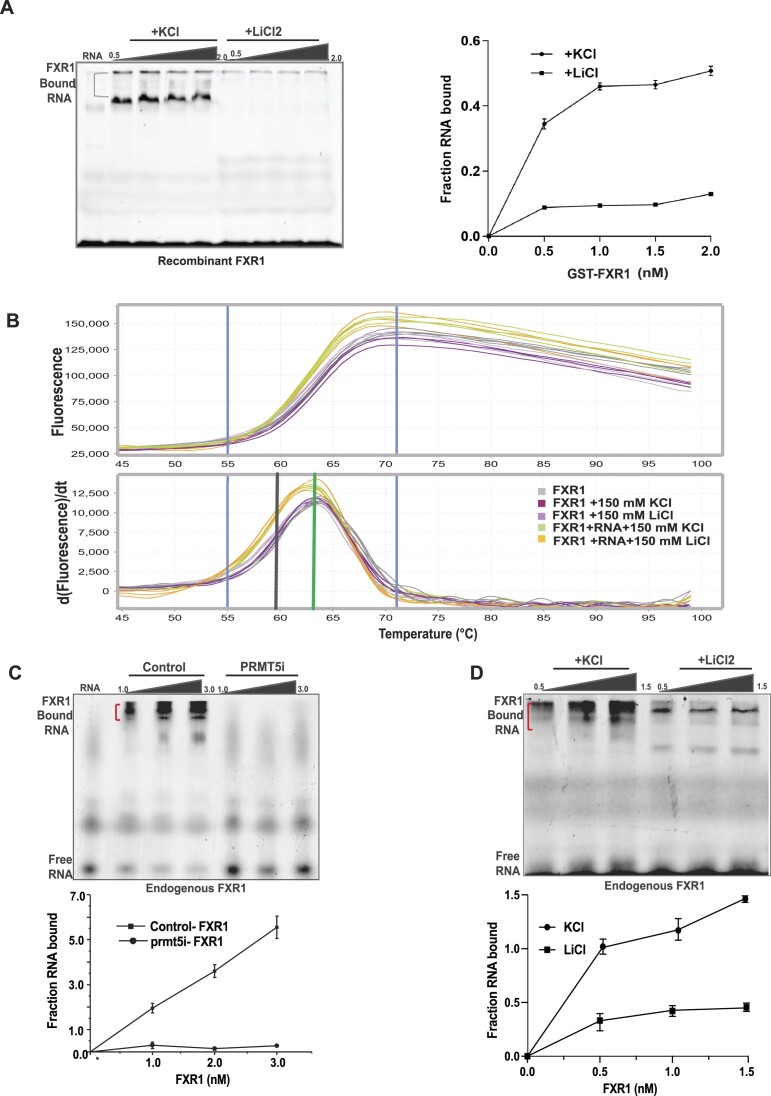
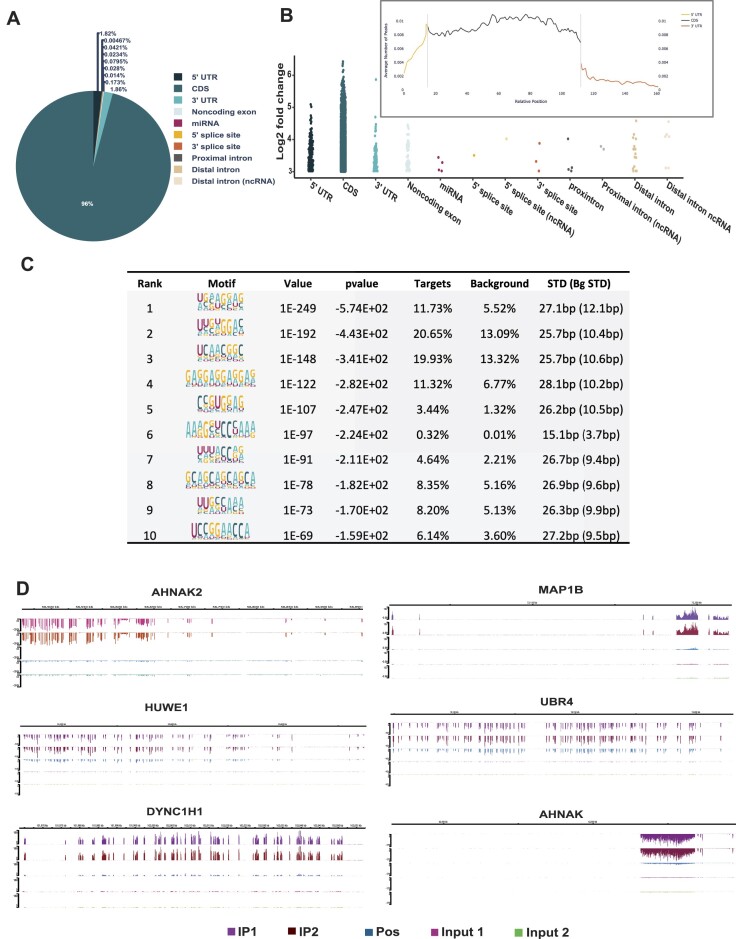
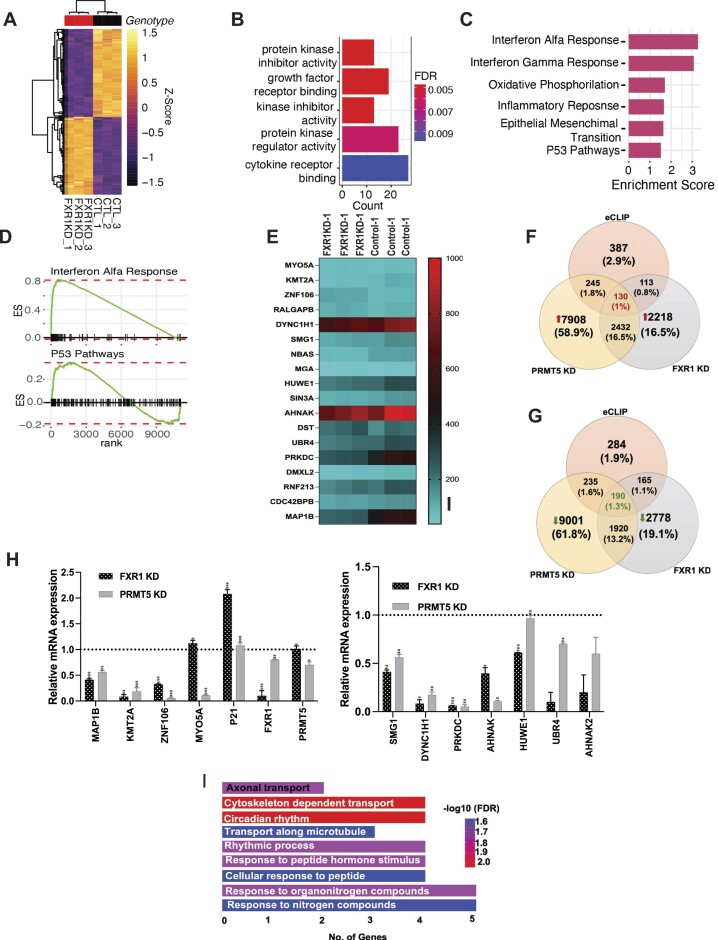
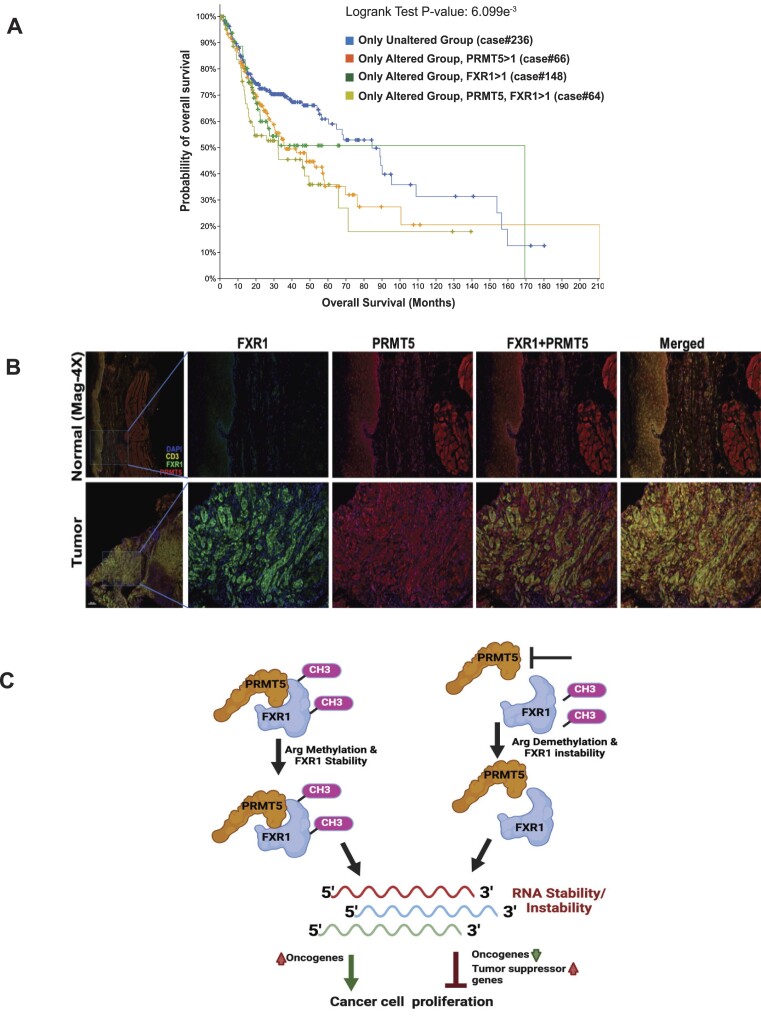
Emerging evidence indicates that arginine methylation promotes the stability of arginine-glycine-rich (RGG) motif-containing RNA-binding proteins (RBPs) and regulates gene expression. Here, we report that post-translational modification of FXR1 enhances the binding with mRNAs and is involved in cancer cell growth and proliferation. Independent point mutations in arginine residues of FXR1's nuclear export signal (R386 and R388) and RGG (R453, R455 and R459) domains prevent it from binding to RNAs that form G-quadruplex (G4) RNA structures. Disruption of G4-RNA structures by lithium chloride failed to bind with FXR1, indicating its preference for G4-RNA structure containing mRNAs. Furthermore, loss-of-function of PRMT5 inhibited FXR1 methylation both in vivo and in vitro, affecting FXR1 protein stability, inhibiting RNA-binding activity and cancer cell growth and proliferation. Finally, the enhanced crosslinking and immunoprecipitation (eCLIP) analyses reveal that FXR1 binds with the G4-enriched mRNA targets such as AHNAK, MAP1B, AHNAK2, HUWE1, DYNC1H1 and UBR4 and controls its mRNA expression in cancer cells. Our findings suggest that PRMT5-mediated FXR1 methylation is required for RNA/G4-RNA binding, which promotes gene expression in cancer cells. Thus, FXR1's structural characteristics and affinity for RNAs preferentially G4 regions provide new insights into the molecular mechanism of FXR1 in oral cancer cells.


Figures

Graphical Abstract
Graphical Abstract
Figure 1.
Figure 1.
TGFβ-induced FXR1 undergoes post-translational modification in cancer cells. (A) Western Blot analyses show protein regulation by TGF-β treatment (48 h) on A549 cells. GAPDH serves as a loading control. The bar graph on the right side depicts the quantitative value of FXR1 in panel-A western blot. N = 3. (B) Analyses of cell morphology (upper panel) and β-Gal staining (lower panel) of the A549 cells treated with TGF-β and shRNA. The upper panel depicts the quantitative pixel values of β-gal positive cells, an indicator of cellular senescence. (C) qRT-PCR of the samples mentioned above (A and B) show that TGF-β only affects the FXR1 protein and does not affect its RNA level. N = 3. ***P < 0.0005. (D) Polysome profiling of A549 cells with TGF-β treatment compared to control. DNA gel shows the RT-PCR products from serial polysome fractions from control and treated TGF-β samples and analyzed for FXR1 expression in each pulled polysome fraction. (E) A549 cells were pretreated with TGF-β or control diluent for 48 h, followed by 5 μM cycloheximide treatment for 0 to 10 h to block protein synthesis. After the treatment, the cells were harvested at the indicated time points and immunoblotted for FXR1, P21 and β-actin (loading control). (F) Quantitative analyses of FXR1 protein levels in control and TGFβ treated A549 cells followed by cycloheximide treatment. The results plotted here represent the mean ± SEM of three independent experiments. All the data were defined as mean ± SD and were analyzed by Student's t-test (n = 3). ***P < 0.0005.
Figure 2.
Figure 2.
PRMT5-mediated arginine methylation promotes PTM of FXR1. (A) The protein structure of FXR1 protein has regions marked for its different domains. The C-terminal arginine-glycine-glycine (RGG) RNA-binding domain has the methylated arginine (R) residues marked in the illustration. (B) Multiple sequence alignment of the C-terminus of human and mouse FXR1 and FMRP proteins is shown. Secondary structural elements are marked above the sequences, with α-helices depicted as cylinders and β-strands as arrows. The R residues potentially methylated inside the cell have been chosen for the mutation to lysine (K) and are highlighted (yellow). The FXR1 residue numbers are given above the sequence. The numbers in parentheses indicate the length of the sequences shown. (C) Immunoblot analyses of WT and mutant Myc-FXR1 protein expressions in HEK293T cells are shown. β-Actin serves as a loading control. (D) HEK293 cells expressing empty vector and Myc-tag FXR1 (WT) were used for IP with Myc-tag antibody and probed for SDMA, ADMA and Myc-tag antibodies. The empty vector serves as a control for Myc-FXR1. (E) HEK293 cells expressing empty vector, Myc-tag FXR1 (WT), and mutant (R386-459K) were used for IP with Myc-tag antibody and probed for SDMA and Myc-tag antibodies. (F) HEK293 cells expressing empty vector, Myc-tag FXR1 (WT), and mutants R386K, R388K, R453K, R455K and R459K were used for IP with Myc-tag antibody and probed for SDMA, PRMT5, PRMT1 and FMRP (positive control). The bottom panel depicts the quantitative value of WT and RGG mutants FXR1 protein interaction with PRMT5. N = 3. (G) A549 cells stably expressing Myc-tag FXR1 (WT) and mutant (R386-459K) were treated with 5 μM cycloheximide treatment for 0 to 10 h to block protein synthesis. After the treatment, the cells were harvested at the indicated time points and immunoblotted for FXR1 and β-actin (loading control). The bottom graph shows the relative FXR1 protein levels with time after cycloheximide treatment. All the data were defined as mean ± SD and were analyzed by Student's t-test (n = 3). *P < 0.05.
Figure 3.
Figure 3.
Genetic and small-molecule inhibition of PRMT5 reduces FXR1 and cell growth in HNSCC cells. (A) The immunoblot shows two independent guide RNA-mediated knock out (KO) of PRMT1 and PRMT5 in UMSCC74B oral cancer cells. β-Actin serves as a loading control. Quantitative protein levels of FXR1 and FXR2 from three independent experiments are shown as a bar graph (right panel). (B) The panel depicts the colony-forming efficiency from clonogenicity assays of UMSCC74B cells treated with indicated drugs and DMSO for 72 h. (C) MTT analysis of cell viability in UMSCC74B cells treated with indicated drugs and DMSO for 72 h. Data presented as the mean ± SD of three independent experiments. (D) UMSCC74B cells were treated with PRMT5i and PRMT1i (1.5 μM) for 72 h. RNA extraction followed by qRT-PCR was done to determine the relative mRNA levels of FXR1, PRMT5, PRMT1 and p21. All the data were defined as mean ± SD and were analyzed by Student's t-test (n = 3). ***P < 0.0005. (E) Immunoblot analysis of cell extracts obtained from UMSCC74B cells treated with PRMT5i and PRMT1i for 72 h. GAPDH serves as a loading control. The upper bar graph shows the quantitative analyses of FXR1 expression upon treatment. (F) Immunoblot analyses of FXR1, comparing FXR2 and PRMT5 levels in UMSCC74B cells upon PRMT5i treatment for 72 h. β-actin served as a loading control. (G) Endogenous FXR1 was purified from UMSCC74B control and PRMT5i (2 μM) treated cells using FXR1 specific antibody and mouse IgG (negative control) antibody. Purified protein fractions were analyzed by 10% SDS-PAGE followed by CBB staining. The bottom panel represents the immunoblot confirmation of FXR1 protein obtained from IP. (H) Estimating methylation status of endogenous FXR1 purified from UMSCC74B cells treated with PRMT5i (2 μM). Immunoblot was probed with FXR1 and SDMA antibody, a marker of protein methylation. (I) UMSCC74B cells were treated with and without PRMT5i for 72 h, followed by treatment with 5 μM cycloheximide for 0 to 8 h to block protein synthesis. After the treatment, the cells were harvested at the indicated time points and immunoblotted for FXR1 and β-actin (loading control). The bottom graph shows the relative FXR1 protein levels with time after cycloheximide treatment. N = 3. All the data were defined as mean ± SD and were analyzed by Student's t-test *P < 0.05.
Figure 4.
Figure 4.
Arginine residue in the NES and RGG domain of FXR1 are essential to bind with G4-RNA sequences. (A) The sequence and plausible structure of a 30-mer RNA is used for EMSA assays. The energy-minimized model of FXR1 region 382–395 is threaded on the structure of FMR1 with G4-RNA. When threaded in either direction, R386 makes strong hydrogen bonds with G4-RNA nucleotides and backbone phosphates. Node assembly to investigate G4-RNA binding of FXR1 region 382–476. Peptides from regions 382–395 and 450–463 were used to model them with G4-RNA. Interacting arginine residues that show sensitivity to methylation are highlighted. (B) In vitro methylation assay was performed with recombinant GST-FXR1 protein purified from bacterial cells and Myc beads bound with PRMT5/MEP50. The methylation assay was carried out in the presence of 3H-SAM. The binding was performed at 4°C for 4 h, incubated with or without PIP3 (20 μM), and subjected to immunoblot analyses. PRMT5.MEP50 proteins were purified from HEK293 cells. The Ponceau stain below serves as a loading control for the immunoblot above. (C) EMSA with 5′-labeled 30-mer RNA, recombinant FXR1 (S382-P476) WT, and respective arginine mutant proteins. 0.5 pmol of [y-32P] ATP-labeled RNA was mock-treated or mixed with increasing concentrations of recombinant WT and mutant FXR1 proteins and incubated at 25°C for 20 min. Free RNA and RNP complexes are shown in the figure. (D) The binding curves and affinity constants are shown for each recombinant protein-RNA complex.
Figure 5.
Figure 5.
PRMT5-dependent FXR1 methylation is required for G4-RNA binding in HNSCC. (A) EMSA was performed as mentioned above with 5′ ATTO 550 labeled 30-mer RNA using recombinant WT FXR1 protein in EMSA buffer containing 150 mM KCl/LiCl2. The RNA-protein interaction was analyzed using 10% native PAGE gel and visualized using typhoon FLA 7000 at 546 nm. The right panel shows the binding curves of EMSA. B. Protein thermal shift assay was used to screen for the effect of KCL/LiCl2 on FXR1 using Sypro Orange. Data from protein thermal shift software show the Boltzmann (upper) and derivative (lower) melt profiles of FXR1 with or without different buffers (KCL/LiCl2), and with RNA (sample used for EMSA). Data were collected as mentioned in the methods. The median derivative Tm and Boltzmann derivative Tm are represented in black and green vertical lines, respectively. (C) EMSA was performed as indicated above with endogenous FXR1 from UMSCC74B cells with and without PRMT5 inhibitor treatment. The bottom panel represents the binding curves of EMSA. (D) EMSA was performed as indicated in above in a buffer containing 150 mM KCl/ LiCl2. The bottom panel represents the binding curves of EMSA.
Figure 6.
Figure 6.
RNA binding landscape of FXR1 by eCLIP and RNA seq. (A) The pie chart depicts the distribution of the FXR1 eCLIP peaks in the human genome analyzed from two biological replicates. UTR-untranslated region; CDS coding sequence. The data was considered with the cut-off values of peak log2 fold enrichment ≥3 and P-value ≤0.001. (B) The binned FXR1 eCLIP peak coverage across all expressed genes in UMSCC74B cells. The inset represents the metagene plots of the normalized average number of peaks mapped to specific genomic regions. The 5′UTR, CDS and 3′UTR of each gene are split into 13, 100 and 70 bins, respectively. (C) Top ten most significantly enriched de novo sequence motifs in the FXR1-binding peaks using HOMER12. The percentage of peaks containing the discovered motifs and the p-values of the motifs calculated by a binomial test against the random genomic background was shown. (D) Integrated genome viewer (IGV) browser tracks the FXR1’s eCLIP peaks of top targets (based on pvalue and log2 fold change) spanning the genomic loci of AHNAK2, MAP1B, HUWE1, UBR4, DYNC1HI and AHNAK. Detailed information about all significantly enriched eCLIP peaks can be found in Supplementary Data-1.
Figure 7.
Figure 7.
FXR1 and PRMT5-dependent altered gene signatures in HNSCC cells. (A) Heat map of significantly differentially expressed genes identified between FXR1 KD and control samples. Rows show Z scores of normalized, log2-transformed values from differentially expressed genes (FDR < 0.05). Dendrograms depict Pearson correlation clustering of samples. (B) Bar plot representing the functional enrichment of FXR D1 DEGs of the top 6 genes ontology biological process (BP). The X-axis corresponds to the number of genes in the functional ontology. The Y-axis shows the top 5 functional ontologies ranked by significance. Gradient color depicts the FDR value (red = most significant, blue = least significant). (C) Bar plot representing the functional enrichment of FXR D1 DEGs of the top 6 hallmark gene set from MSigDB database (FDR < 0.05). The X-axis corresponds to the normalized enrichment score based on GSEA analysis. (D) Graphical representation of the rank-ordered gene lists for Interferon Alfa Response (NES = 3.29, FDR = 1.24e-27) and P53 Pathways (NES = 1.50, FDR = 1.27e-02) hallmark gene sets. (E) Heat map for the top FXR1 eCLIP RNA targets shows differential expression profile in UMSCC74B control and FXR1 KD cells. (F) Venn diagram represents the FXR1 eCLIP targets commonly up-regulated in both FXR1 KD and PRMT5 KD conditions. (G) Venn diagram represents the FXR1 eCLIP targets commonly down-regulated in both FXR1 KD and PRMT5 KD conditions. (H) Quantitative real-time PCR validation of top eCLIP targets having the highest fold-change and P-values compared to the size-matched input. The results plotted here represent the mean ± SEM of three independent experiments. All the data were defined as mean ± SD and were analyzed by Student's t-test (n = 3). ***P < 0.0005. (I) The bar graph represents the GO enrichment analyses of the top eighteen FXR1 eCLIP targets.
Figure 8.
Figure 8.
PRMT5-dependent FXR1 preferentially targets oncogenes and alters its expression in HNSCC. (A) Kaplan–Meier plots of overall survival of stage HNSCC patients (n = 522) stratified by FXR1 and PRMT5 mRNA expression (SD > 1). The log-rank P value and the number of cases per group are shown. (B) Optimized multiplex immunofluorescence showing the expression of FXR1 and PRMT5 in human HNSCC tumor and normal adjacent tissue samples. DAPI and CD3 staining was done for the nucleus and tumor markers. (C) Model represents the methylation dependent regulation of FXR1 and its RNA targets to promote or inhibit the tumor cell proliferation.

References

    1. Choi P.S., Thomas-Tikhonenko A.. RNA-binding proteins of COSMIC importance in cancer. J. Clin. Invest. 2021; 131:e151627. - PMC - PubMed
    1. Qin H., Ni H., Liu Y., Yuan Y., Xi T., Li X., Zheng L.. RNA-binding proteins in tumor progression. J. Hematol. Oncol. 2020; 13:90. - PMC - PubMed
    1. Gehring N.H., Wahle E., Fischer U.. Deciphering the mRNP code: RNA-bound determinants of post-transcriptional gene regulation. Trends Biochem. Sci. 2017; 42:369–382. - PubMed
    1. Glisovic T., Bachorik J.L., Yong J., Dreyfuss G.. RNA-binding proteins and post-transcriptional gene regulation. FEBS Lett. 2008; 582:1977–1986. - PMC - PubMed
    1. Pereira B., Billaud M., Almeida R.. RNA-binding proteins in cancer: old players and new actors. Trends Cancer. 2017; 3:506–528. - PubMed

MeSH terms