. 2024 May 14;121(20):e2306776121.
doi: 10.1073/pnas.2306776121. Epub 2024 May 6.

A high-fat diet promotes cancer progression by inducing gut microbiota-mediated leucine production and PMN-MDSC differentiation

Affiliations

A high-fat diet promotes cancer progression by inducing gut microbiota-mediated leucine production and PMN-MDSC differentiation

Jiewen Chen et al. Proc Natl Acad Sci U S A. .

Abstract

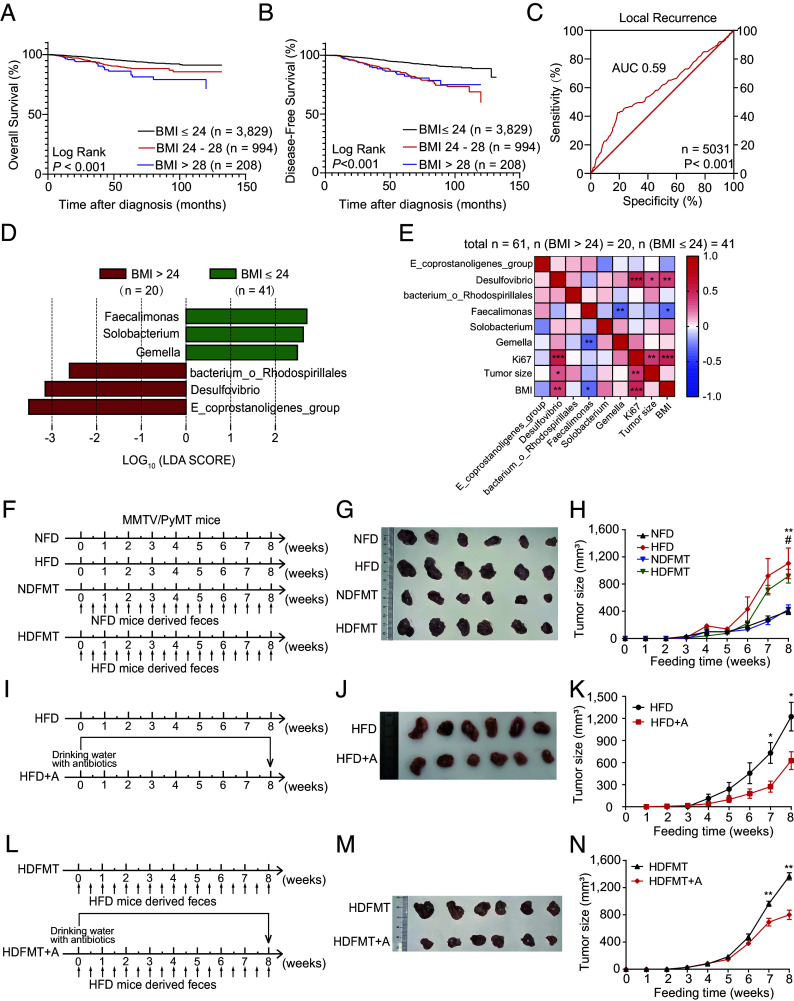
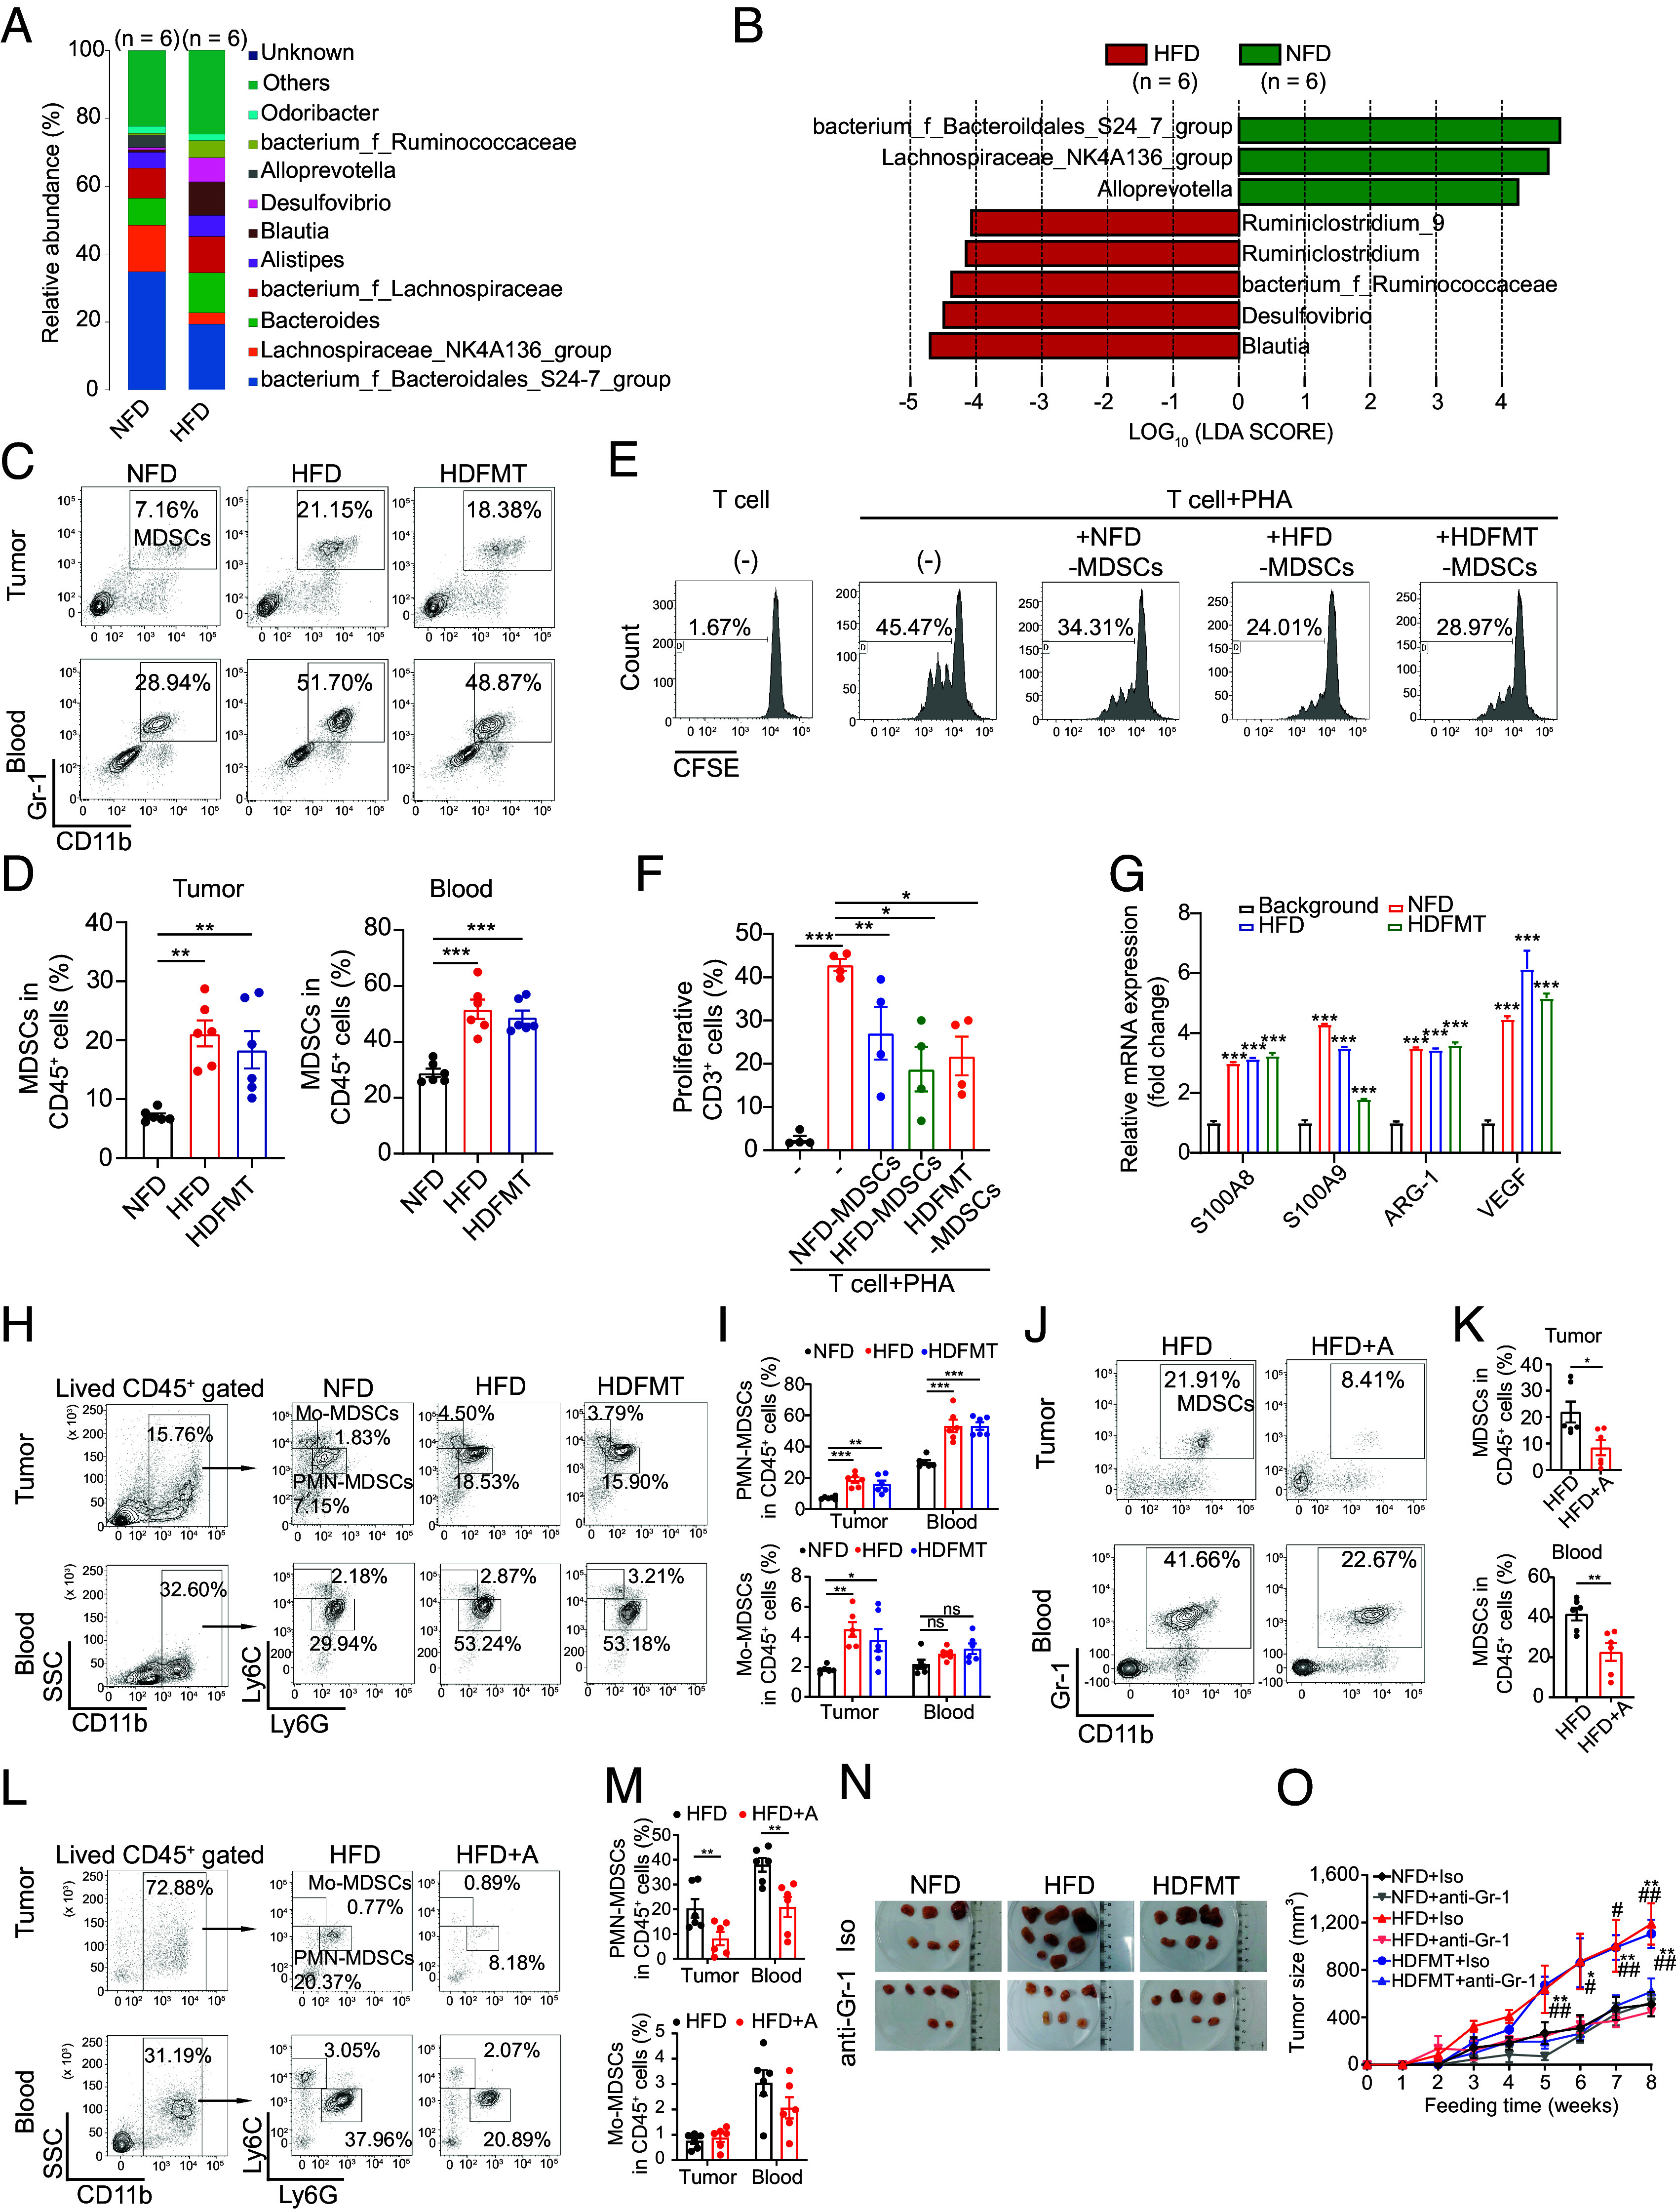
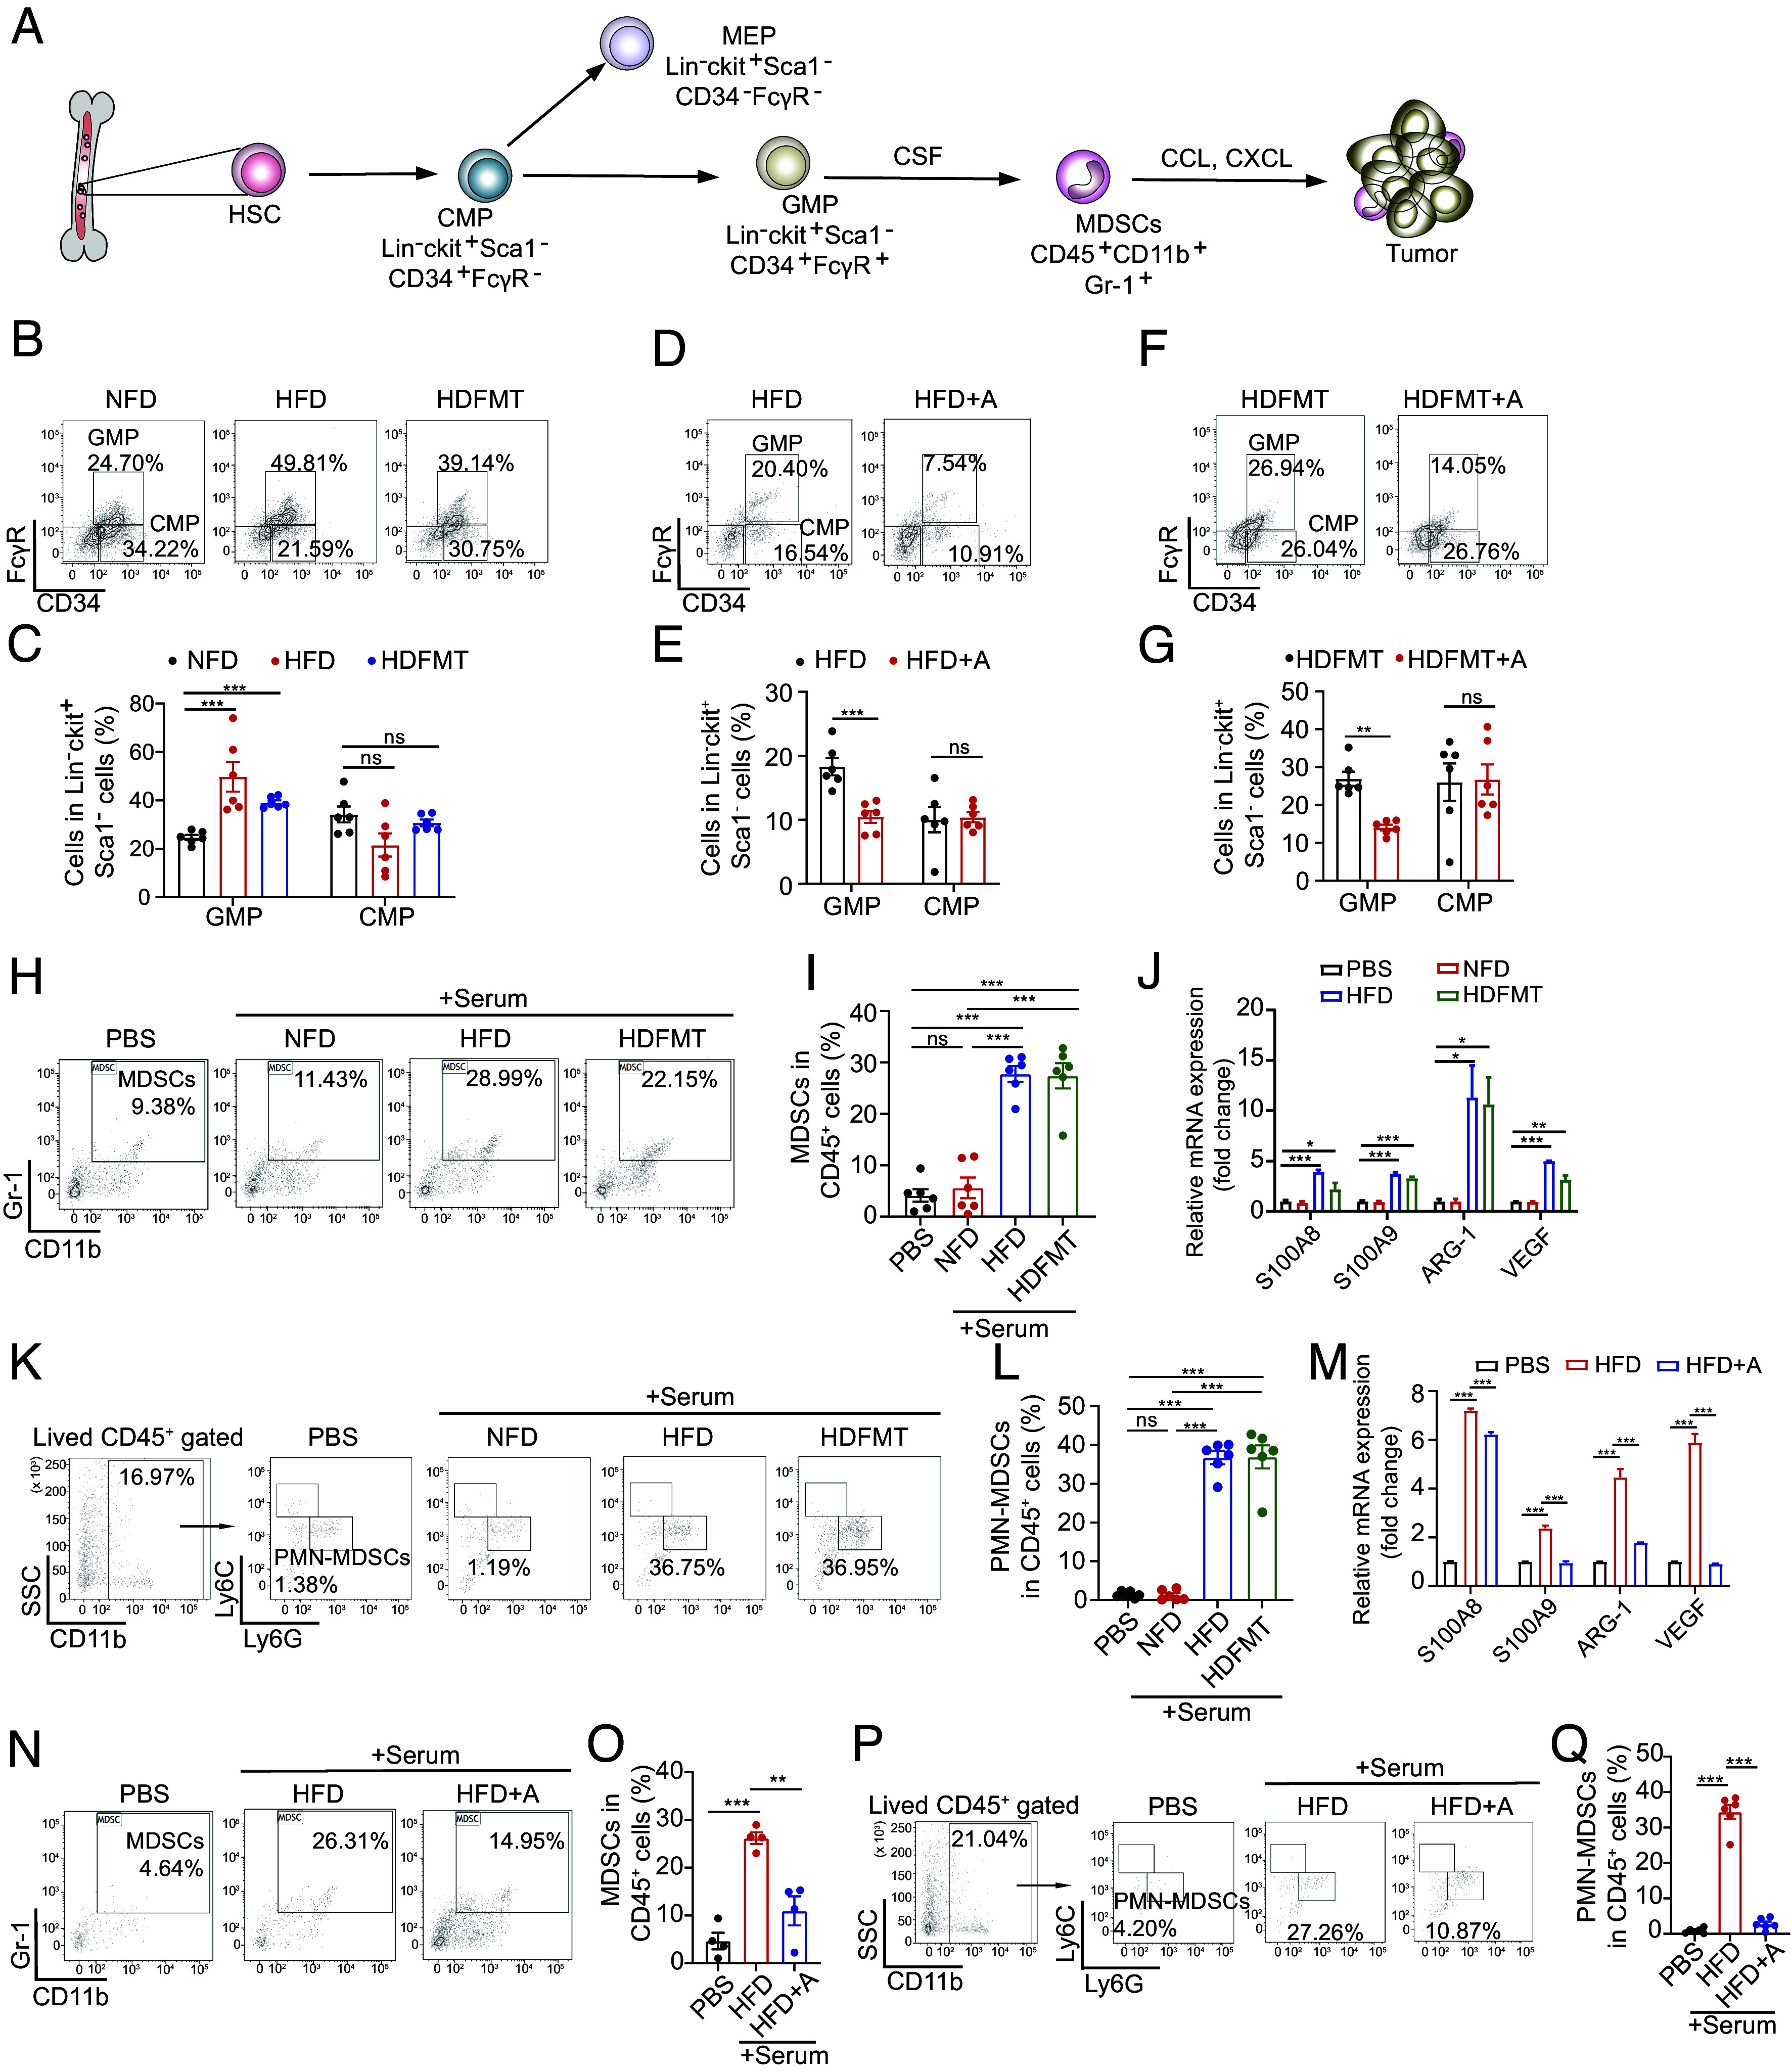
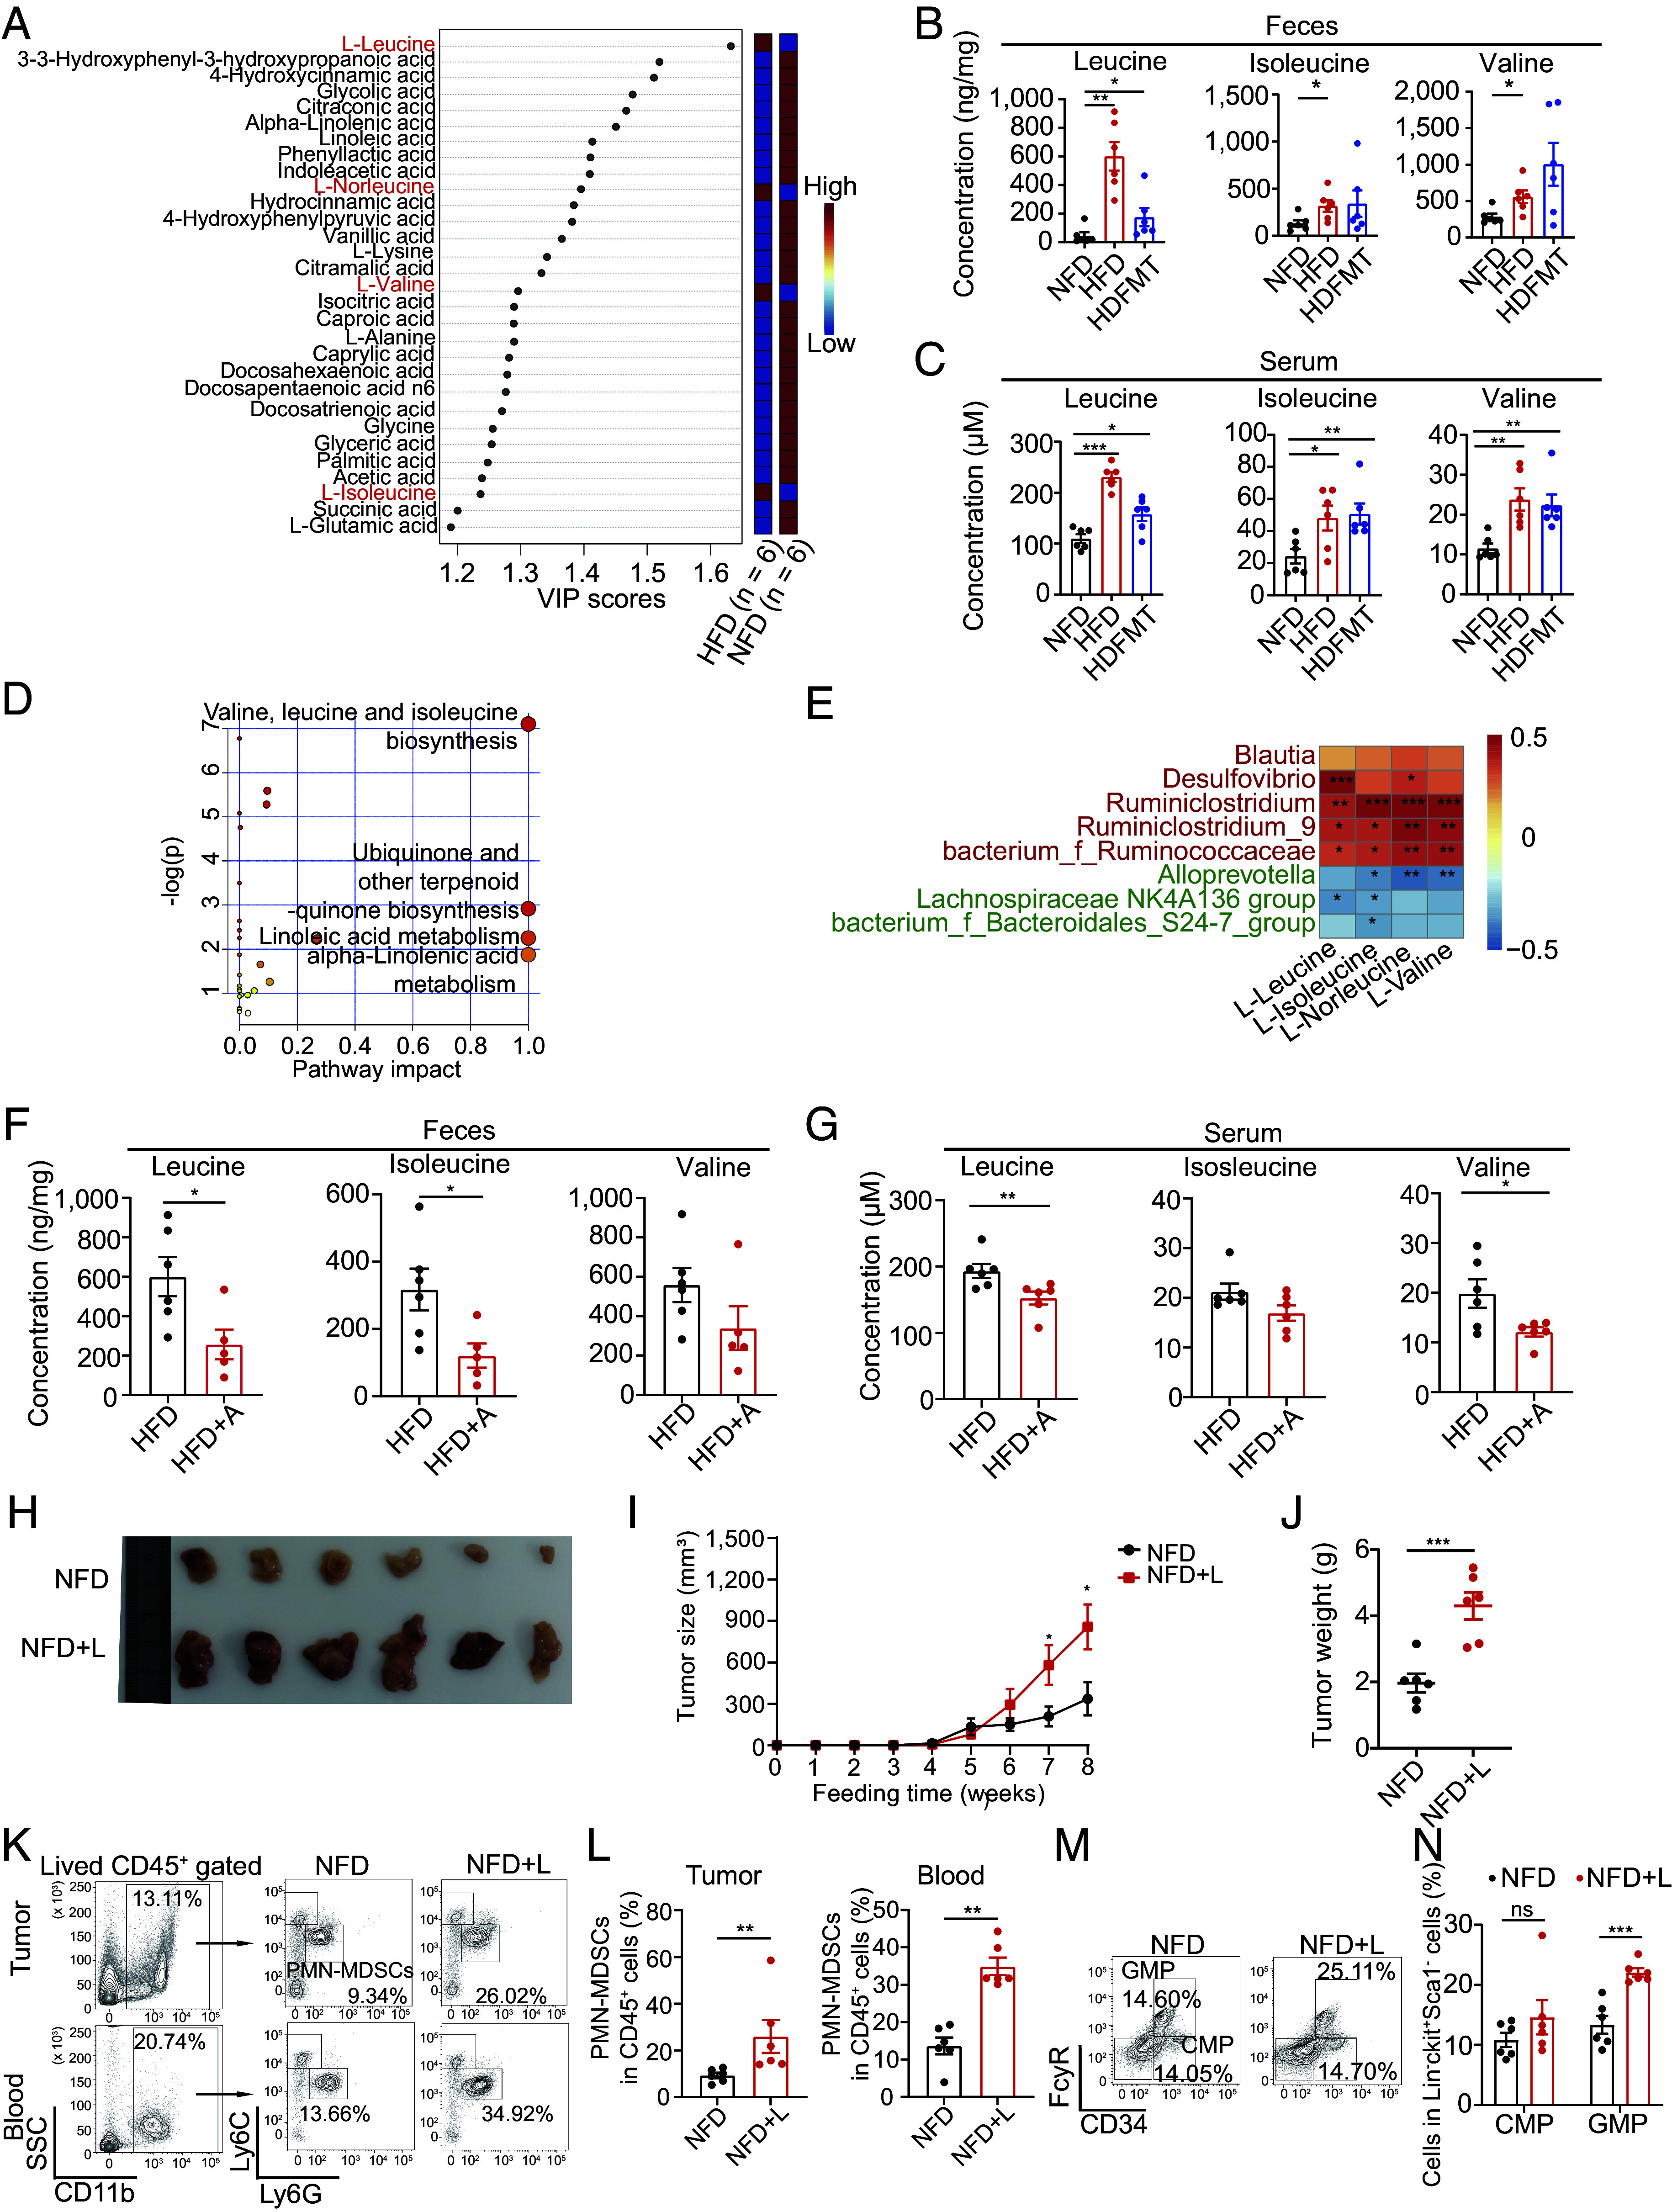
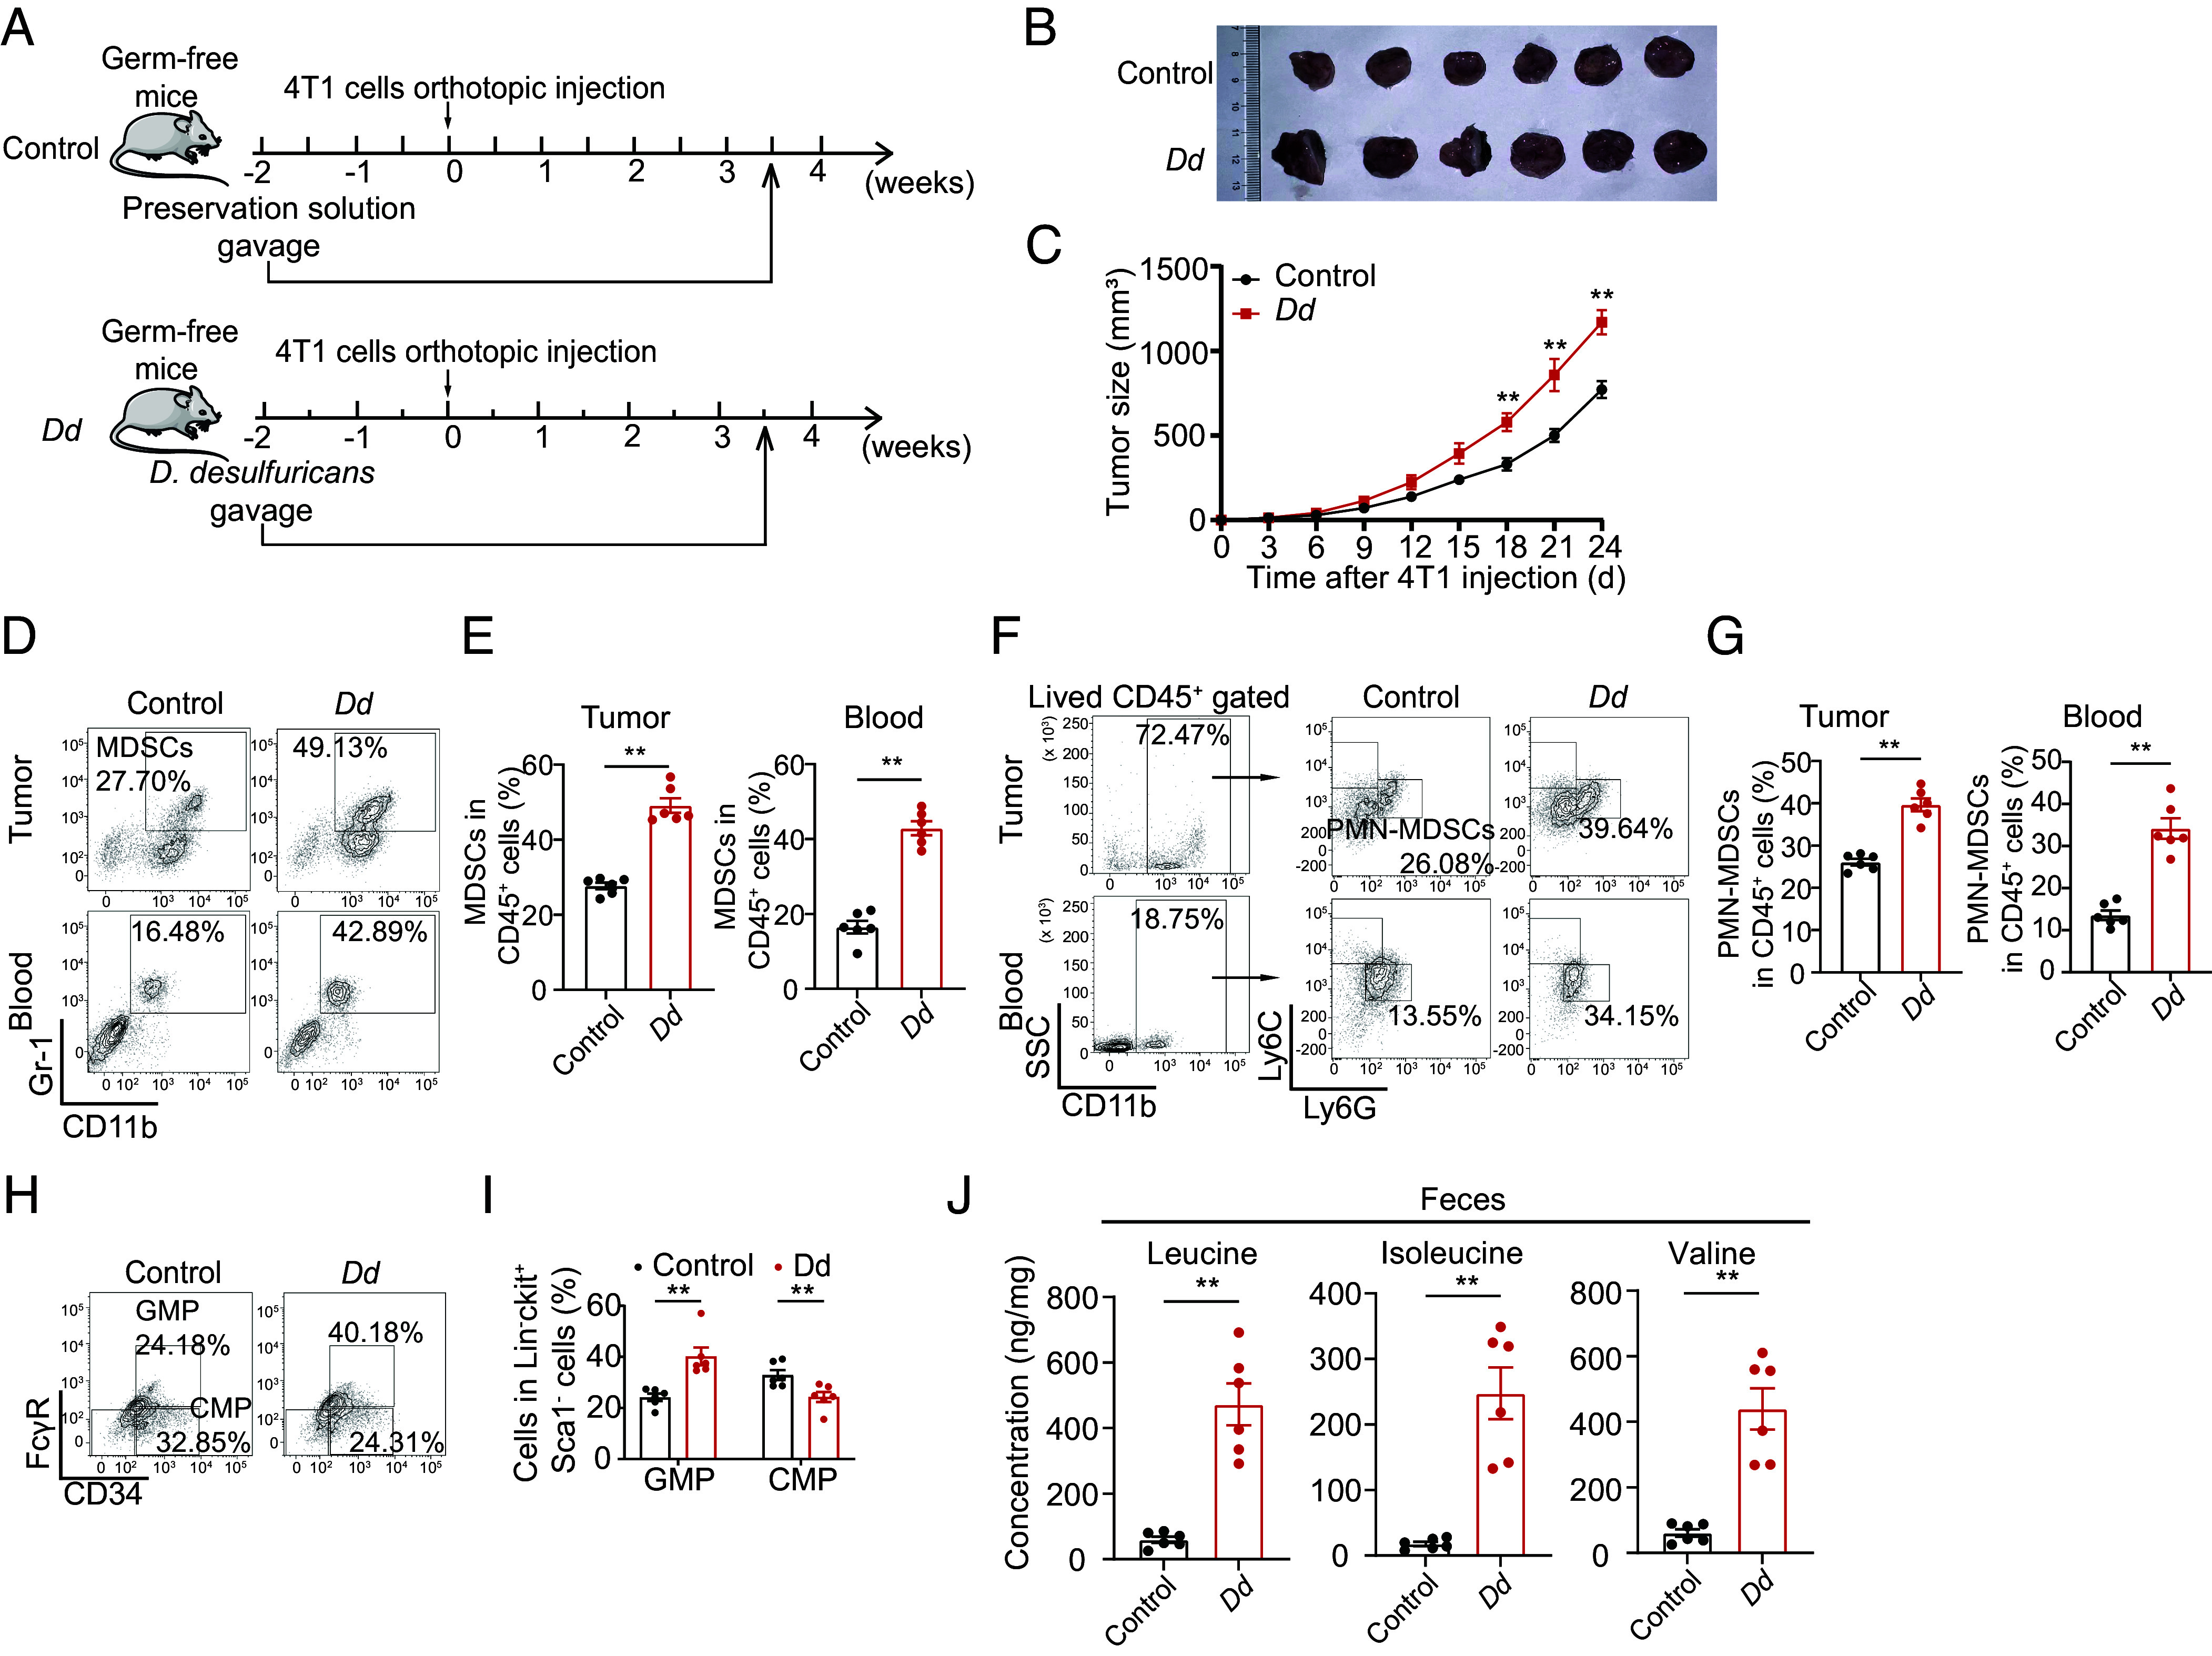
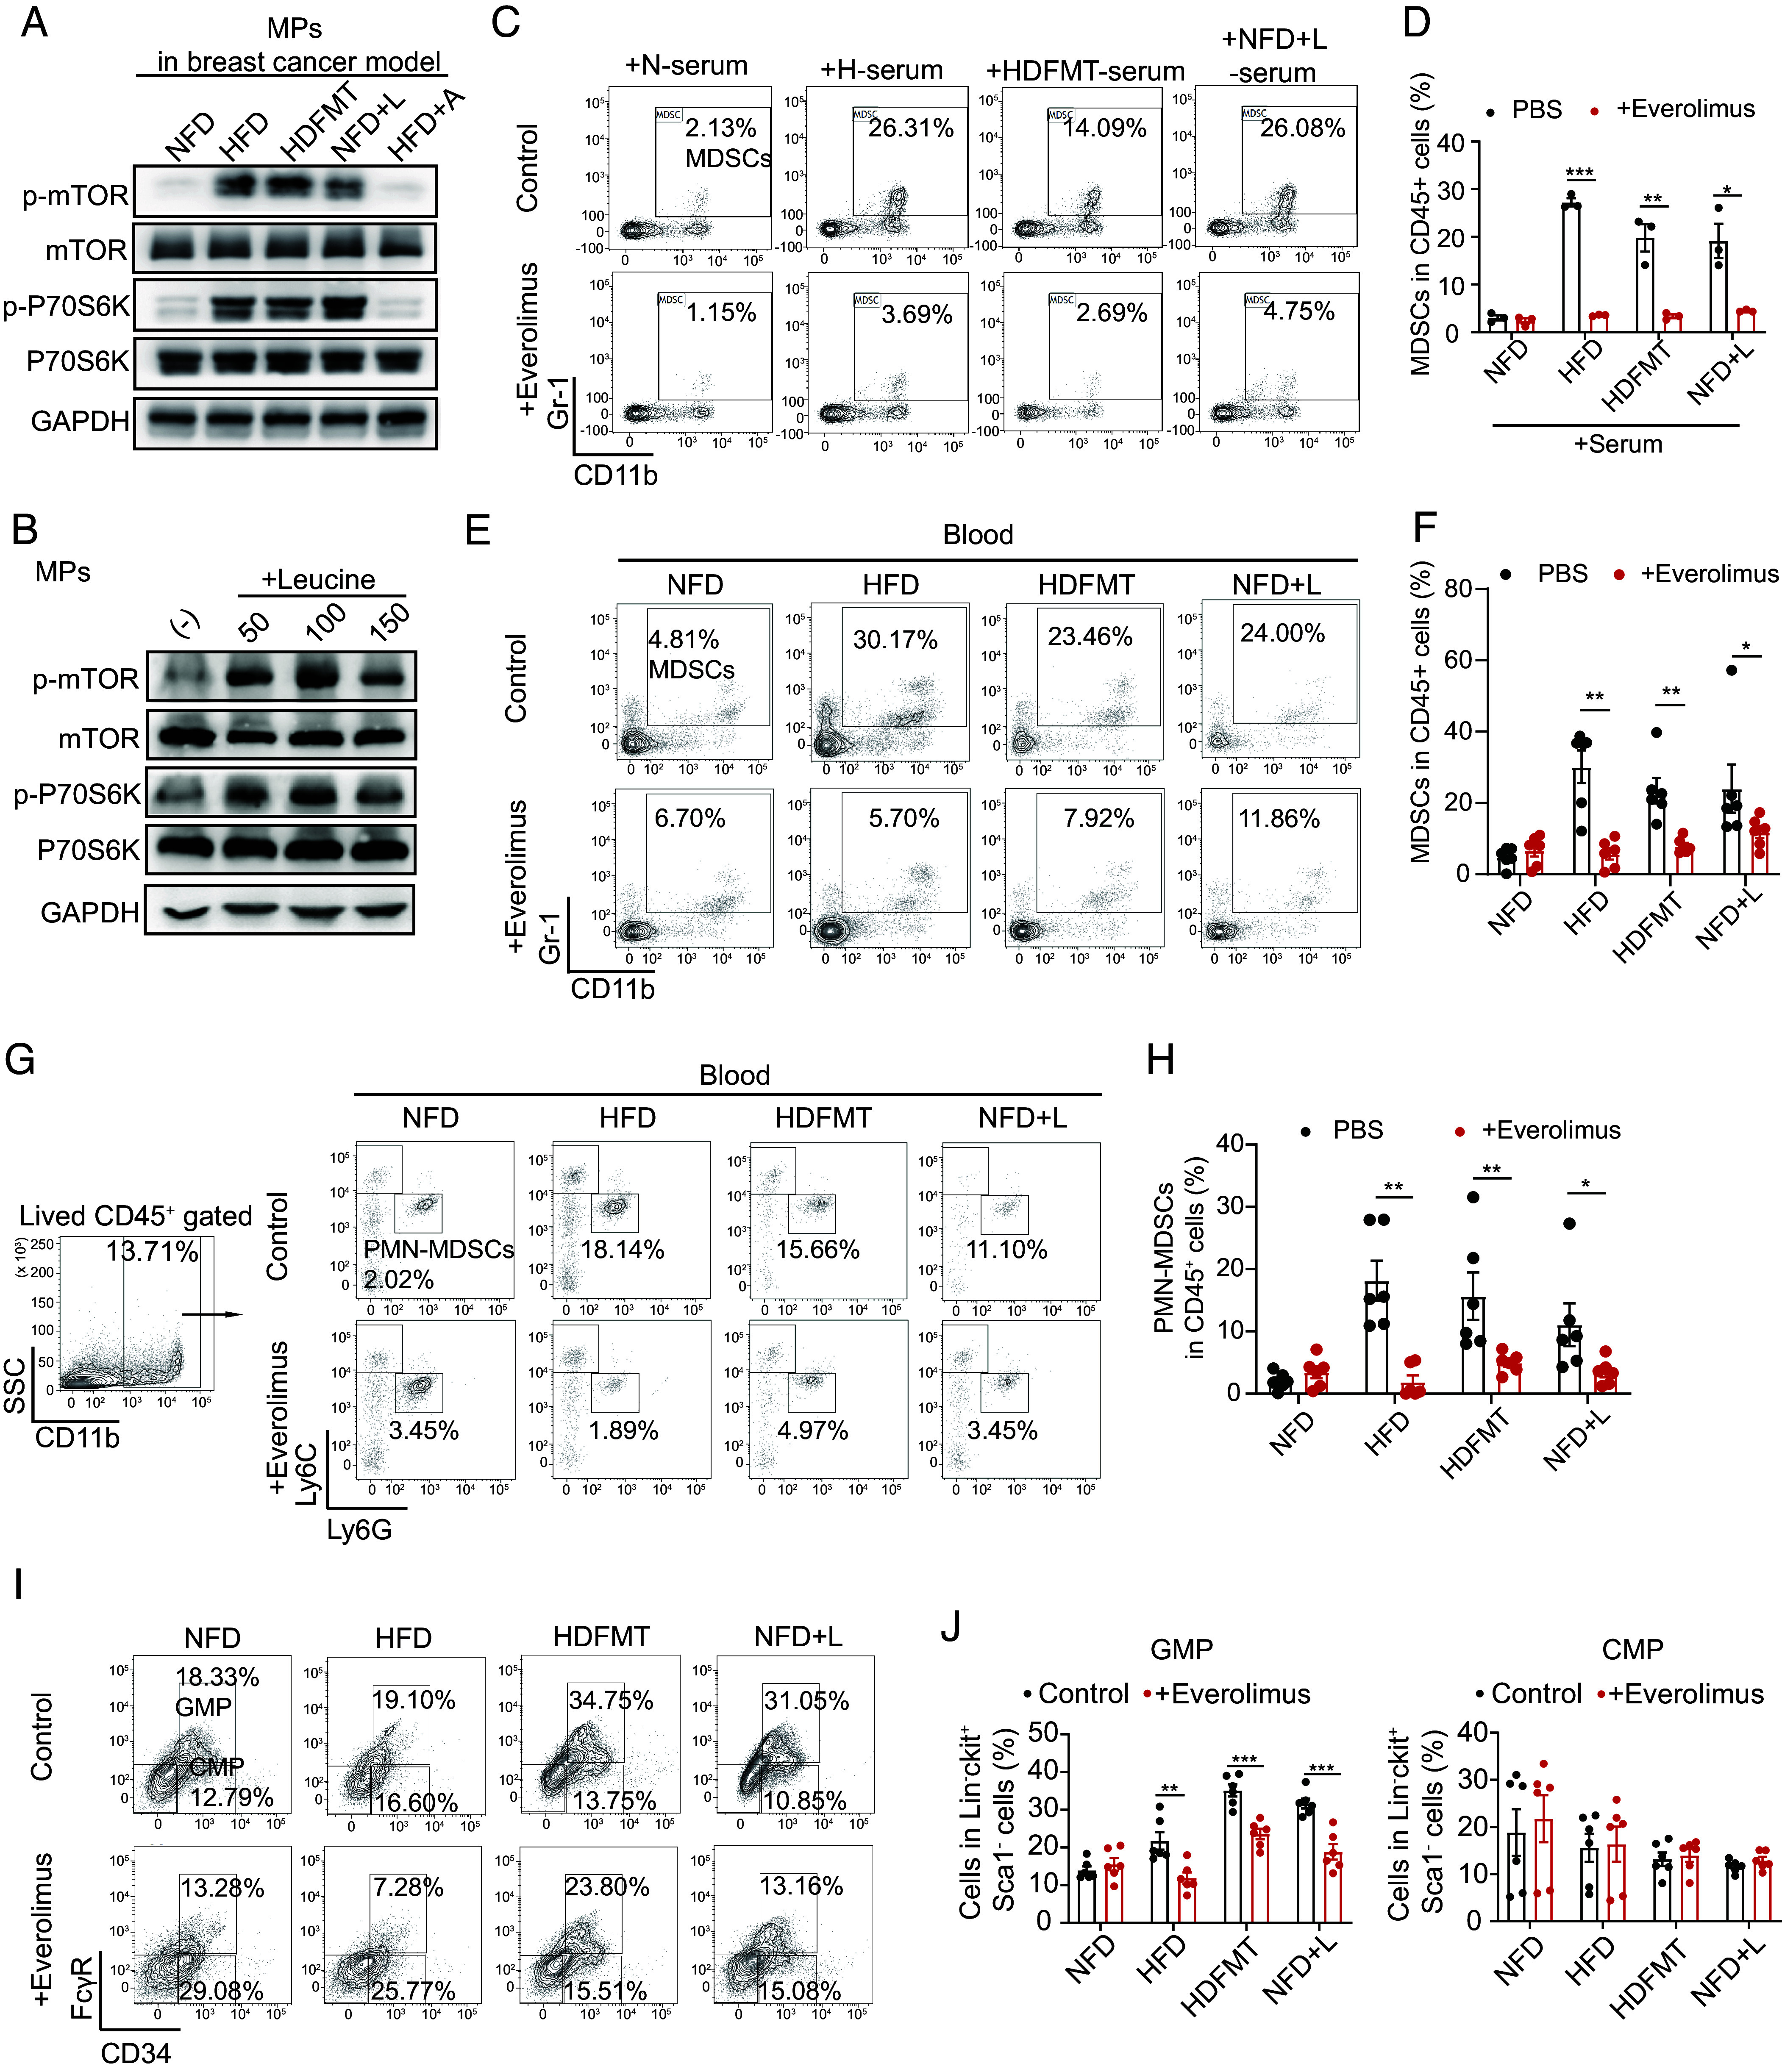
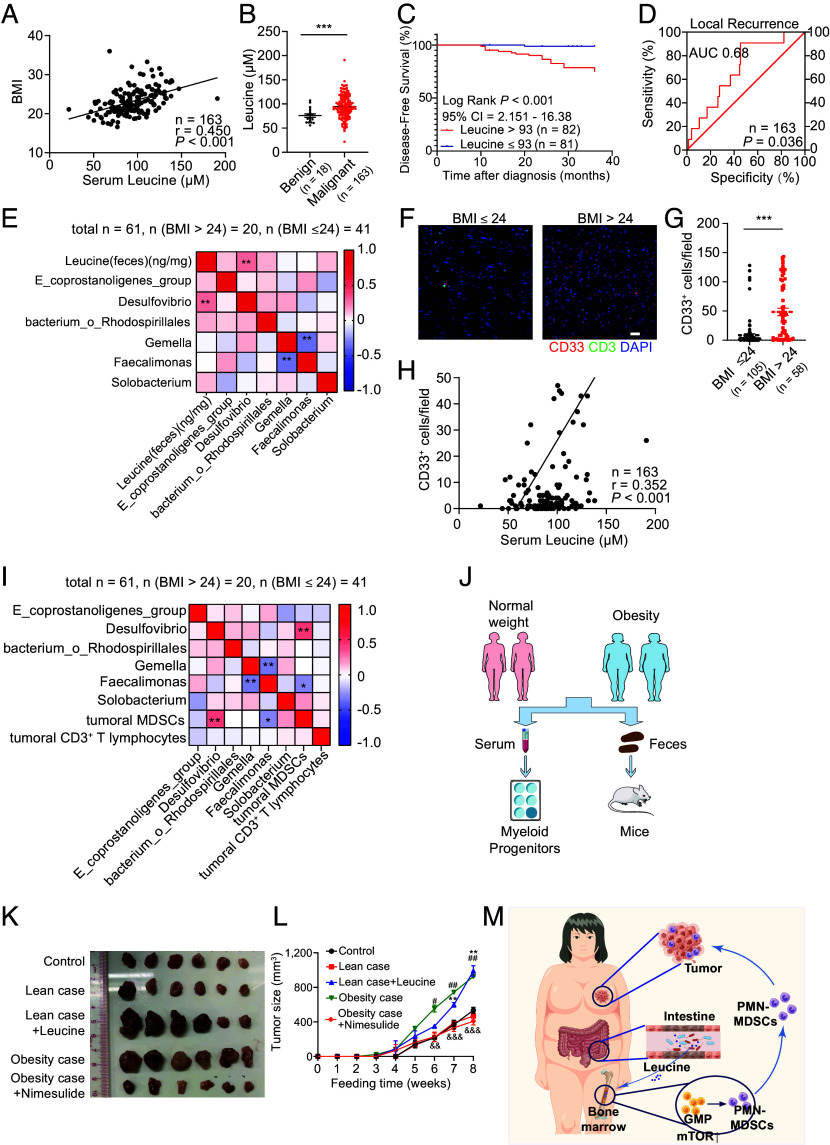
A high-fat diet (HFD) is a high-risk factor for the malignant progression of cancers through the disruption of the intestinal microbiota. However, the role of the HFD-related gut microbiota in cancer development remains unclear. This study found that obesity and obesity-related gut microbiota were associated with poor prognosis and advanced clinicopathological status in female patients with breast cancer. To investigate the impact of HFD-associated gut microbiota on cancer progression, we established various models, including HFD feeding, fecal microbiota transplantation, antibiotic feeding, and bacterial gavage, in tumor-bearing mice. HFD-related microbiota promotes cancer progression by generating polymorphonuclear myeloid-derived suppressor cells (PMN-MDSCs). Mechanistically, the HFD microbiota released abundant leucine, which activated the mTORC1 signaling pathway in myeloid progenitors for PMN-MDSC differentiation. Clinically, the elevated leucine level in the peripheral blood induced by the HFD microbiota was correlated with abundant tumoral PMN-MDSC infiltration and poor clinical outcomes in female patients with breast cancer. These findings revealed that the "gut-bone marrow-tumor" axis is involved in HFD-mediated cancer progression and opens a broad avenue for anticancer therapeutic strategies by targeting the aberrant metabolism of the gut microbiota.

Keywords: breast cancer; gut microbiota; high-fat diet; myeloid-derived suppressor cells.


Conflict of interest statement

Competing interests statement:The authors declare no competing interest.

Figures

Fig. 1.
Fig. 1.
HFD promotes tumor progression through gut microbiota dysbiosis. (A) The KM curve of OS for patients with breast cancer with BMI ≤ 24 (n = 3,829), 24 to 28 (n = 994), and >28 (n = 208). (B) The KM curve of DFS for patients with breast cancer with BMI ≤ 24 (n = 3,829), 24 to 28 (n = 994), and >28 (n = 208). (C) The ROC curve of the BMI for predicting local recurrence of patients with breast cancer (n = 5,031). (D) Linear discriminant analysis effect size (LEfSE) analysis showed statistically differential gut microbes at the genus level between patients with breast cancer with BMI > 24 (n = 20) and those with BMI ≤ 24 (n = 41). Taxa with a significant linear discriminant analysis (LDA) threshold value > 2 are shown. (E) Correlation analysis between differential gut genus and BMI index, Ki67, and tumor size (n (BMI >24) = 20, n (BMI ≤24) = 41). Red represents a positive correlation, and blue indicates a negative correlation. (F) Experimental procedure. For the normal-fat diet (NFD) and HFD model, 4-wk-old MMTV/PyMT mice were fed an NFD or HFD. For mice-derived fecal microbiota transplantation (FMT), 4-wk-old MMTV/PyMT mice were fed with feces from NFD or HFD wild type FVB mice. (G) Image of breast cancer from MMTV/PyMT mice with NFD, HFD, NFD mice-derived FMT (NDFMT), and HFD mice-derived FMT (HDFMT) (n = 6 per group). (H) Tumor growth curve of breast cancer from MMTV/PyMT mice with NFD, HFD, NDFMT, and HDFMT (n = 6 per group). (I) Experimental procedure: 4-wk-old HFD mice were treated with ampicillin (1 g/L), vancomycin (0.5 g/L), neomycin (1 g/L), and metronidazole (1 g/L), or placebo in drinking water as a control. (J) Image of breast cancer from MMTV/PyMT mice with HFD and HFD+A (n = 6 per group). (K) Tumor growth curve of breast cancer from MMTV/PyMT mice with HFD and HFD+A (n = 6 per group). (L) Experimental procedure: 4-wk-old HDFMT mice were treated with antibiotic cocktail or placebo in drinking water as a control. (M) Image of breast cancer from MMTV/PyMT mice with HDFMT and HDFMT+A (n = 6 per group). (N) Tumor growth curve of breast cancer from MMTV/PyMT mice with HDFMT and HDFMT+A (n = 6 per group). Data are presented as mean ± SEM; P values are calculated by Student’s t test or Tukey’s post hoc test. *P < 0.05; **P < 0.01; ***P < 0.001.
Fig. 2.
Fig. 2.
HFD-mediated gut microbiota dysbiosis promotes tumor progression through PMN-MDSCs. (A) Bacterial taxonomic profiling at the genus level of gut microbiota from NFD and HFD (n = 6 per group). (B) LEfSe analysis shows statistically differential gut microbes between NFD and HFD mice at the genus level. Taxa with a significant LDA threshold value > 2 are shown (n = 6 per group). (C) The percentage of MDSCs in breast tumor tissue and circulation from NFD, HFD, and HDFMT groups was determined using flow cytometry (n = 6 per group). (D) Scatter plots represent the percentage of MDSCs in breast tumor tissue (Left) and circulation (Right) (n = 6 per group). (E) MDSCs sorted from NFD, HFD, or HDFMT breast tumor tissue were cocultured with CD3+ T cells, and the proliferation of CD3+ T cells was detected using carboxyfluorescein succinimidyl ester (CFSE) staining examinations through flow cytometry. n = 4 independent experiments of MDSCs from NFD, HFD, and HDFMT mice. (F) The scatter plot represents the percentage of proliferative CD3+ T cells. n = 4 independent experiments. (G) Messenger RNA (mRNA) levels of S100A8, S100A9, ARG-1, and VEGF from sorted CD11b+ Gr-1+ cells from the background, NFD, HFD, or HDFMT breast tumor tissue were determined using qRT-PCR. All values are means ± SEM, n = 3 independent experiments. (H) The percentage of PMN-MDSCs (CD45+ CD11b+ Ly6C Ly6G+ cells) and Mo-MDSCs (CD45+ CD11b+ Ly6Chigh Ly6G cells) in breast tumor tissue and circulation from NFD, HFD and HDFMT groups was determined using flow cytometry (n = 6 per group). (I) Scatter plots represent the percentage of PMN-MDSCs (Upper) and Mo-MDSCs (Bottom) in breast tumor tissue and circulation (n = 6 per group). (J) The percentage of MDSCs in the tumor and circulation in the HFD and HFD+A groups was determined using flow cytometry (n = 6 per group). (K) Scatter plots represent the percentage of MDSCs in the tumor (Upper) and circulation (Bottom, n = 6 per group). (L) The percentage of PMN-MDSC and Mo-MDSC in breast tumor tissue and circulation from the HFD and HFD+A groups was determined using flow cytometry (n = 6 per group). (M) Scatter plots represent the percentage of PMN-MDSCs (upper) and Mo-MDSCs (button) in breast tumor tissue and circulation (n = 6 per group). (N) A representative picture of breast tumors from NFD, HFD, and HDFMT groups with anti-Isotype or anti-Gr-1 antibodies (n = 5 per group). (O) Tumor growth curve of breast cancer from NFD, HFD, and HDFMT groups with anti-Isotype or anti-Gr-1 antibody application (n = 5 per group). Data are presented as mean ± SEM; P values are calculated by Student’s t test or Tukey’s post hoc test. *P < 0.05; **P < 0.01; ***P < 0.001.
Fig. 3.
Fig. 3.
HFD-mediated microbiota dysbiosis triggers PMN-MDSC production. (A) Schematic of MDSCs generation and recruitment. (B) The percentage of CMPs and GMPs in the bone marrow of mice with breast tumor burden from NFD, HFD, and HDFMT groups was determined using flow cytometry (n = 6 per group). (C) The scatter plot represents the percentage of CMPs and GMPs in bone marrow from mice (n = 6 per group). (D) The percentage of CMPs and GMPs in the bone marrow of mice with breast tumor burden from HFD and HFD+A groups was determined using flow cytometry (n = 6 per group). (E) The scatter plot represents the percentage of CMPs and GMPs in the bone marrow of mice (n = 6 per group). (F) The percentage of CMPs and GMPs in the bone marrow of mice with breast tumor burden from HDFMT and HDFMT+A groups was determined using flow cytometry (n = 6 per group). (G) The scatter plot represents the percentage of CMPs and GMPs in the bone marrow of mice (n = 6 per group). (H) MPs were treated with phosphate-buffered saline (PBS) and sera from NFD, HFD, and HDFMT mice (breast cancer burdened). The percentage of generated MDSCs was determined by flow cytometry. (I) The scatter plot represents the percentage of generated MDSCs. n = 6 independent experiments of PBS, sera from NFD, HFD, and HDFMT mice. (J) mRNA levels of S100A8, S100A9, ARG-1, and VEGF of MPs treated with PBS, sera from NFD, HFD, and HDFMT mice (breast cancer burdened) were determined using qRT-PCR. All values are means ± SEM, n = 3 independent experiments. (K) The percentage of PMN-MDSCs induced by PBS, sera from NFD, HFD, and HDFMT mice was determined using flow cytometry. n = 6 independent experiments of PBS, sera from NFD, HFD, and HDFMT mice. (L) A scatter plot represents the percentage of generated PMN-MDSCs. n = 6 independent experiments. (M) mRNA level of S100A8, S100A9, ARG-1, and VEGF of MP cells treated with PBS, sera from HFD, and HFD+A mice (breast cancer burdened) was determined using qRT-PCR. All values are means ± SEM, n = 3 independent experiments. (N) MPs were treated with PBS and sera from HFD and HFD+A mice (breast cancer-burdened). The percentage of generated MDSCs was determined by flow cytometry. n = 6 independent experiments of PBS, sera from HFD and HFD+A mice. (O) A scatter plot represents the percentage of generated MDSCs. n = 6 independent experiments. (P) The percentage of PMN-MDSCs induced by PBS, sera from HFD and HFD+A mice was determined using flow cytometry. n = 6 independent experiments of PBS, sera from HFD and HFD+A mice. (Q) A scatter plot represents the percentage of generated PMN-MDSCs. n = 6 independent experiment. Data are presented as mean ± SEM; P values are calculated by Student’s t test or Tukey’s post hoc test. *P <0.05; **P <0.01; ***P <0.001.
Fig. 4.
Fig. 4.
HFD-mediated dominant microbes produce leucine to increase PMN-MDSC reproduction and tumor progression. (A) The variance importance in projection (VIP) score plot displays the 30 critical metabolites differentiating NFD and HFD (n = 6 per group). (B) The concentration of leucine, isoleucine, and valine in feces of NFD, HFD, and HDFMT groups (n = 6 per group). (C) The concentration of leucine, isoleucine, and valine in the serum of NFD, HFD, and HDFMT groups (n = 6 per group). (D) Metabolic pathway analysis plot drawn using MetaboAnalyst 4.0 depicts several metabolic pathway alterations induced by HFD. (E) Heatmap analysis of Spearman’s correlation of fecal BCAAs and differential genus. Red represents a positive correlation, and blue indicates a negative correlation (total: n = 12). (F) Leucine, isoleucine, and valine concentration in the feces of HFD and HFD+A groups (n = 6 per group). (G) Leucine, isoleucine, and valine concentration in the serum of HFD and HFD+A groups (n = 6 per group). (H) A representative picture of breast tumors from NFD and NFD+L groups (n = 6 per group). (I) Breast tumor growth curve from NFD and NFD+L groups (n = 6 per group). (J) A dot plot represents the average weight of breast tumors per mouse from the NFD and NFD+L groups (n = 6 per group). (K) The percentage of PMN-MDSCs in tumor and circulation in the NFD and NFD+L groups was determined using flow cytometry (n = 6 per group). (L) Scatter plots represent the percentage of PMN-MDSCs in breast tumor tissue (Left) and circulation (Right) (n = 6 per group). (M) The percentage of CMP and GMP cells in the bone marrow of mice with breast tumor burden from NFD and NFD+L groups was determined using flow cytometry (n = 6 per group). (N) The scatter plots represent the percentage of CMP and GMP cells in bone marrow from mice with breast tumor burden (n = 6 per group). Data are presented as mean ± SEM; P values are calculated by Student’s t test or Tukey’s post hoc test. *P < 0.05; **P < 0.01; ***P < 0.001.
Fig. 5.
Fig. 5.
HFD-mediated enrichment of Desulfovibrio augments PMN-MDSC production and cancer progression through leucine production. (A) Experimental procedure. For the D. desulfuricans gavage model, germfree BALB/c mice were raised in a germfree environment, fed with a NFD, and administrated by 200 μL bacterial strain preservation solution (Control) and D. desulfuricans (Dd) gavage twice weekly until dissection. At the 2-wk Dd gavage, mice were inoculated with 100 μL (1 × 10⁶ cells) 4T1 mouse breast cancer cells on the second right mammary fat pad. (B) Image of breast cancer from 4T1 bearing mice of control and Dd gavage groups (n = 6 per group). (C) Tumor growth curve of breast cancer from 4T1 bearing mice of control and Dd gavage groups (n = 6 per group). (D) The percentage of MDSCs in the tumor and circulation in the control and Dd gavage groups was determined using flow cytometry (n = 6 per group). (E) Scatter plots represent the percentage of MDSCs in the tumor (Left) and circulation (Right) (n = 6 per group). (F) The percentage of PMN-MDSCs in breast tumor tissue and circulation from the control and Dd gavage groups was determined using flow cytometry (n = 6 per group). (G) Scatter plots represent the percentage of PMN-MDSCs in breast tumor tissue (Left) and circulation (Right). n = 6 per group. (H) The percentage of CMP and GMP cells in the bone marrow of mice with breast tumor burden from control and Dd gavage groups was determined using flow cytometry (n = 6 per group). (I) The scatter plot represents the percentage of CMP and GMP cells (n = 6 per group). (J) Concentration of leucine, isoleucine, and valine in feces of control and Dd gavage groups (n = 6 per group). Data are presented as mean ± SEM; P values are calculated by Student’s t test. *P < 0.05; **P < 0.01; ***P < 0.001.
Fig. 6.
Fig. 6.
Leucine triggers MP differentiation toward PMN-MDSCs by activating the mTORC1 signaling pathway. (A) Western blotting analysis of MPs from breast tumor-bearing mice from NFD, HFD, HDFMT, NFD+L, and HFD+A groups. Target proteins were mTOR, phospho-mTOR, P70S6K, phospho-P70S6K, and GAPDH. A graph represents the experimental triplicates. (B) Western blotting analysis of MPs treated with PBS and 50, 100, and 150 μg/mL leucine. A graph represents the experimental triplicates. (C) MPs were sorted using flow cytometry and treated with PBS or serum from NFD, HFD, HDFMT, and NFD+L groups with or without everolimus for 6 d. The percentage of MDSCs differentiated from treated MPs was determined using flow cytometry. n = 6 independent experiments. (D) The scatter plot represents the percentage of generated MDSCs. All values are means ± SEM, n = 6 per group. (E) The percentage of MDSCs in circulation in the NFD, HFD, HDFMT, and NFD+L groups with or without everolimus treatment was determined using flow cytometry (n = 6 per group). (F) A scatter plot represents the percentage of MDSCs in circulation (n = 6 per group). (G) The percentage of PMN-MDSCs in circulation in the NFD, HFD, HDFMT, and NFD+L groups with or without everolimus treatment was determined by flow cytometry (n = 6 per group). (H) A scatter plot represents the percentage of PMN-MDSCs in circulation (n = 6 per group). (I) The percentage of GMPs and CMPs in the bone marrow tissue in the NFD, HFD, HDFMT, and NFD+L groups with or without everolimus treatment was determined by flow cytometry (n = 6 per group). (J) The scatter plots represent the percentage of GMPs (Left) and CMPs (Right). n = 6 per group. Data are presented as mean ± SEM; P values are calculated by Student’s t test or Tukey’s post hoc test. *P < 0.05; **P < 0.01; ***P < 0.001.
Fig. 7.
Fig. 7.
Serum leucine and HFD-related microbiota are correlated with tumoral MDSCs and advanced clinicopathological status in patients with breast cancer. (A) Spearman’s correlation analysis of serum leucine and BMI of patients with breast cancer (n = 163). (B) Concentration of serum leucine from patients with benign (n = 18) and malignant breast tumors (n = 163). (C) KM DFS curve of patients with breast cancer with a low and high level of serum leucine (n = 163). (D) The ROC curve is constructed to estimate the power of serum leucine for predicting the local recurrence of patients with breast cancer (n = 163). (E) Heatmap analysis of Spearman’s correlation of fecal leucine and differential gut taxa from patients with breast cancer (n = 61). Red represents a positive correlation, and blue indicates a negative correlation. (F) Immunofluorescence of CD33+ MDSCs and CD3+ tumor-infiltrating T lymphocytes in tumor tissue from breast cancer patients with BMI > 24 (n = 58) and ≤24 (n = 105). (Scale bar, 20 μm.) (G) A scatter plot represents the number of tumoral MDSCs (CD33+ cells) from patients with normal weight (n = 105) and overweight/obese (n = 58) patients. Total n = 163. (H) Spearman’s correlation analysis of serum leucine and tumoral CD33+ MDSCs of patients with breast cancer (n = 163). (I) Heatmap analysis of Spearman’s correlation of differential gut taxa and tumoral MDSCs and T lymphocytes of patients with breast cancer (n = 61). Red represents a positive correlation, and blue indicates a negative correlation. (J) Flow chart of patient-derived serum and feces applications. (K) Representative picture of breast tumors from mice treated with PBS, feces from lean donors (mixed with three cases), feces from lean donors + leucine, feces from obese donors (mixed with three cases), and feces from obese donors + nimesulide (n = 6 per group). (L) Growth curve of breast tumors from mice (n = 6 per group). (M) Graphical illustration of the working model. Data are presented as mean ± SEM; P values are calculated by Student’s t test or Tukey’s post hoc test. *P < 0.05; **P < 0.01; ***P < 0.001.

References

    1. Flegal K. M., Carroll M. D., Ogden C. L., Curtin L. R., Prevalence and trends in obesity among US adults, 1999–2008. JAMA 303, 235–241 (2010). - PubMed
    1. Mozaffarian D., Hao T., Rimm E. B., Willett W. C., Hu F. B., Changes in diet and lifestyle and long-term weight gain in women and men. N. Engl. J. Med. 364, 2392–2404 (2011). - PMC - PubMed
    1. Ramachandran A., Snehalatha C., Rising burden of obesity in Asia. J. Obes. 2010, 868573 (2010). - PMC - PubMed
    1. Calle E. E., Kaaks R., Overweight, obesity and cancer: Epidemiological evidence and proposed mechanisms. Nat. Rev. Cancer 4, 579–591 (2004). - PubMed
    1. van Kruijsdijk R. C., van der Wall E., Visseren F. L., Obesity and cancer: The role of dysfunctional adipose tissue. Cancer Epidemiol. Biomarkers Prev. 18, 2569–2578 (2009). - PubMed

Publication types

LinkOut - more resources