. 2024 May 6;15(1):3780.
doi: 10.1038/s41467-024-48221-4.

An adeno-associated virus variant enabling efficient ocular-directed gene delivery across species

Affiliations

An adeno-associated virus variant enabling efficient ocular-directed gene delivery across species

Shuang Luo et al. Nat Commun. .

Abstract

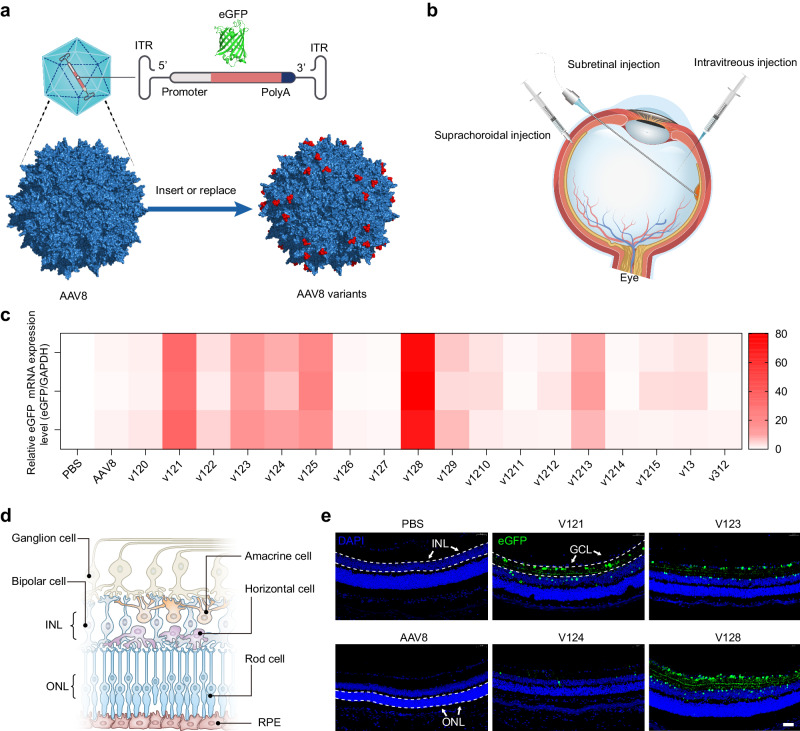
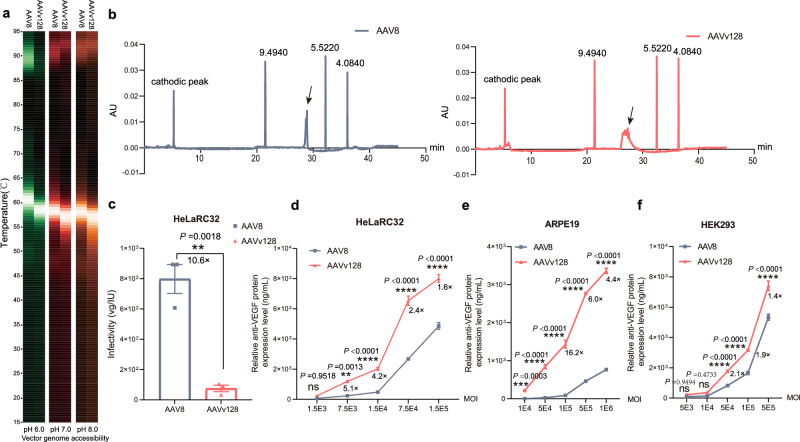
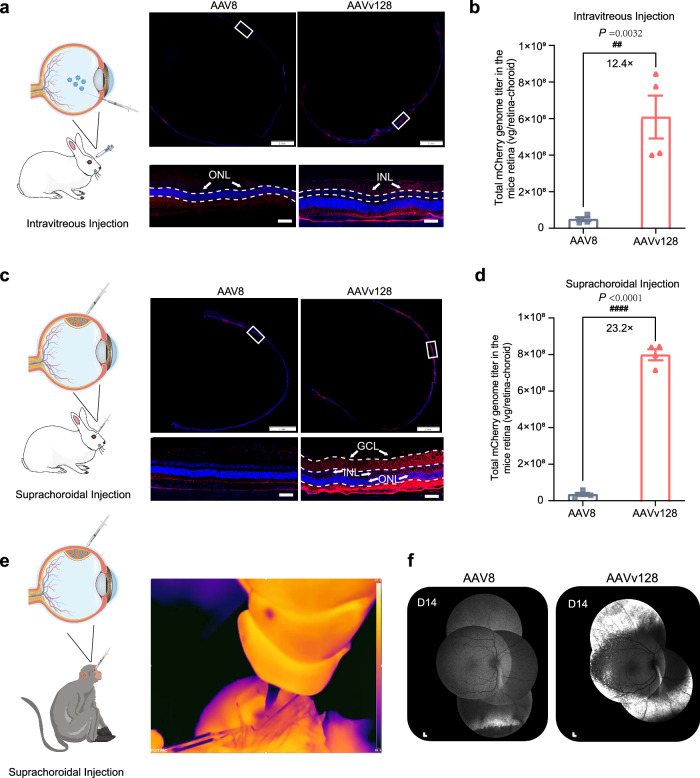
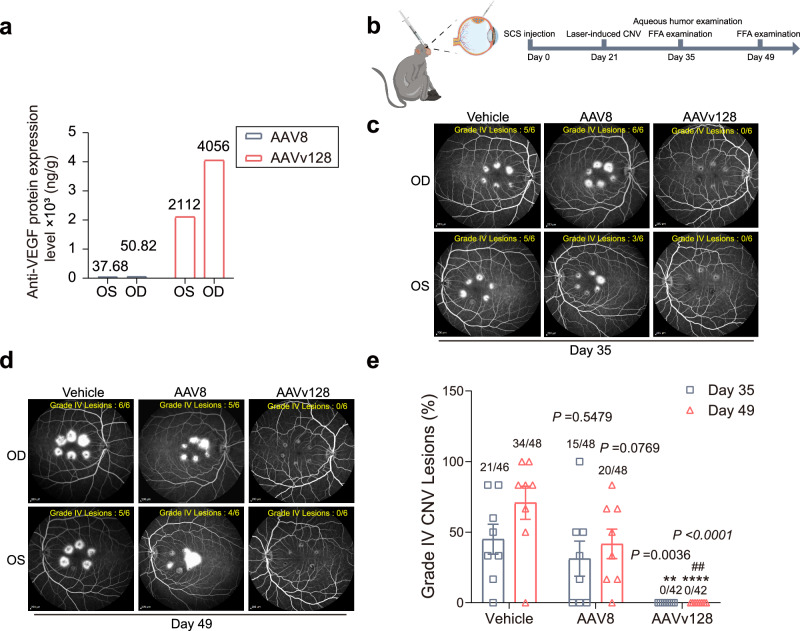
Recombinant adeno-associated viruses (rAAVs) have emerged as promising gene therapy vectors due to their proven efficacy and safety in clinical applications. In non-human primates (NHPs), rAAVs are administered via suprachoroidal injection at a higher dose. However, high doses of rAAVs tend to increase additional safety risks. Here, we present a novel AAV capsid (AAVv128), which exhibits significantly enhanced transduction efficiency for photoreceptors and retinal pigment epithelial (RPE) cells, along with a broader distribution across the layers of retinal tissues in different animal models (mice, rabbits, and NHPs) following intraocular injection. Notably, the suprachoroidal delivery of AAVv128-anti-VEGF vector completely suppresses the Grade IV lesions in a laser-induced choroidal neovascularization (CNV) NHP model for neovascular age-related macular degeneration (nAMD). Furthermore, cryo-EM analysis at 2.1 Å resolution reveals that the critical residues of AAVv128 exhibit a more robust advantage in AAV binding, the nuclear uptake and endosome escaping. Collectively, our findings highlight the potential of AAVv128 as a next generation ocular gene therapy vector, particularly using the suprachoroidal delivery route.


Conflict of interest statement

X Ke, Q Zheng, S Luo, H Jiang are inventor on patents with potential royalties licensed to Chengdu Origen Biotechnology Co Ltd. Remaining authors declare no competing interests.

Figures

Fig. 1
Fig. 1. rAAV library screening via intravitreal injection in mice.
a Schematic diagram of rAAV and rAAV variants components. b Three injection routes commonly used for AAV ophthalmic gene therapy. c Mice were sacrificed at D28 and eyes were harvested. The detection of eGFP mRNA expression levels in AAV8 and AAV8 variants after intravitreal injection in mice using RT-qPCR (6 × 10⁸ vg/eye, n = 3). The color depicted represent relative mRNA expression levels from highest to lowest value (red to white, respectively). d The cell types across the retina were illuminated. e Mice were sacrificed at D28 and eyes were harvested. Coronal sections of rAAV-CBA-eGFP transduced mice retina. Immunofluorescence (IF) stained sections (Green) with antibodies against eGFP indicate the positively transduced cell type across the retina. (Scale bar: 50 μm, GCL ganglion cell layer, INL inner nuclear layer, ONL outer nuclear layer;). We conducted three repetitions for each sample, with each assay being operated independently. Source data are provided as a Source Data file.
Fig. 2
Fig. 2. Testing transduction of AAV8 and AAVv128 capsid following subretinal injections.
a OCT images showing retinal blebbing formed at the site of subretinal administration. Representative animal eyes were shown at post-injection of necropsy (1 μL volume, n = 6). b Fluorescence fundoscopy of mouse eyes treated with PBS (1 μL volume, n = 6, scale bar: 500 μm). cf Fluorescence fundoscopy of mouse eyes treated with ssAAV-CBA-eGFP vectors packaged with AAV8 (c) or AAVv128 (d) capsids (1×10⁹ vg/eye, 1 μL volume, n = 6, scale bar: 500 μm). Mice were imaged at D14 and D28 post-injection, and each image of pixel intensity and mean pixel intensity per pixel area was quantified by using Image J (e, f). g, i Mice where sacrificed at D28 and eyes were harvested. Flat mounts of the retina were prepared and imaged by fluorescence microscopy to visualize native eGFP expression (g) and quantify by pixel intensity and mean pixel intensity per pixel area (i). Scale bar: 500 μm. h, j Mice retinal tissues were isolated and the relative eGFP copy number per cell were measured by qPCR. Values represent mean ± SD. P Values were determined by one-way ANOVA. Compared with PBS, *P < 0.05, **P < 0.01, ***P < 0.001, ****P < 0.0001. Compared with AAV8, #P < 0.05, ##P < 0.01, ###P < 0.001, ####P < 0.0001. n = 3/group (i). ns not significant. n = 6/group (e, f, j). Source data are provided as a Source Data file.
Fig. 3
Fig. 3. Cross-section and immunofluorescence analyses of mice retina treated with subretinal injection of AAV8 and AAVv128 capsids.
a Coronal sections of mice retina transduced with rAAV-CBA-eGFP. Native eGFP expression (green) shows the positively transduced cell. Scale bar: 200 μm. We conducted four repetitions for each sample, with each assay being operated independently. b IF stained sections (red) with antibodies against Rhodopsin (photoreceptors, Rod), Peanut agglutinin (PNA, photoreceptors, Cone), RPE65 (RPE cells), GS (Müller cells), GFAP (astrocytes), RBPMS (ganglion cells), PROX1 (anaplastic cells and ganglion cells) and Calbindin D28K (horizontal cells, anaplastic cells and ganglion cells) indicate the distribution of cell types across the retina. Native eGFP expression (green) that colocalize with IF staining (yellow or white) reveals the positively transduced cell type indicated. Scale bars: 20 μm (right column) or 200 μm (left column). INL inner nuclear layer, ONL outer nuclear layer. We conducted four repetitions for each sample, with each assay being operated independently.
Fig. 4
Fig. 4. Biochemical and physiological properties analyses of AAVv128 and AAV8.
a Heatmap displays of differential scanning fluorimetry (DSF) analyses used a 473 nm laser to excite SYBR Gold bound to DNA (vector genome extrusion) at pHs 6, 7 and 8. Color scaling depicted represent relative peak signals from highest to lowest value (brightest to dimmest, respectively). b The isoelectric point of AAV8 and AAVv128 were detected using capillary isoelectric focusing (cIEF). c The infectivity of AAV8 and AAVv128 were detected by a 96-well TCID50 format and quantitative polymerase chain reaction (qPCR). The relative anti-VEGF protein expression levels of AAV8 and AAVv128 on ARPE19 (e), HeLaRC32 (d) and HEK293 (f) cells were detected by ELISA, respectively. Values represent mean ± SD. P Values were determined by a two-tailed Student t Test. *P < 0.05, **P < 0.01, ***P < 0.001, ****P < 0.0001. ns not significant. n = 3/group. Source data are provided as a Source Data file.
Fig. 5
Fig. 5. Assessing the performance of the AAVv128 and AAV8 during trafficking steps.
a Schematic diagram for studying the effect of AAV8 Nab-positive monkey serum on AAVv128. b Neutralizing antibody (Nab) assay for the determination of the AAVv128 could escape positive-AAV8 Nab recongnition. c Depicting the process of the AAVv128 and AAV8 during trafficking steps. d, e, f, g, h, i, j, k The AAV binding (d, f), cellular uptake (e, g), nuclear uptake (h, i) and expression (j, k) of AAV8 and AAVv128 were detected by qPCR and ELISA, respectively. Values represent mean ± SD. P Values were determined by a two-tailed Student t Test. *P < 0.05, **P < 0.01, ***P < 0.001, ****P < 0.0001. n = 5/group (d, e, f, g, h, i), n = 3/group (j, k). Source data are provided as a Source Data file.
Fig. 6
Fig. 6. Cryo-EM reveals differences between AAVv128 and AAV8.
a The rendered images of the empty AAVv128 was shown and labeled with the particle dimensions. Depth cueing with colors was used to indicate radius (<100 Å, blue; 100–120 Å, from cyan to green; > 140 Å, red). b Comparison of the capsid surfaces of AAV8 and AAVv128. Gray surface representation of the AAV8 (PDB, 6V12) and AAVv128 (PDB, 8JRE) generated from 60 VP monomers. The amino acid differences between with AAV8 and AAVv128 on the capsid surface were colored red. c The Structural superposition of AAV8 and AAVv128 VP shown as ribbon diagrams. The conserved β-barrel core motif and the αA helix were indicated, the positions of VR-I to VR-IX were labeled. d The residues in a featured fragment from AAVv128 VP3 VIII variable region (D584-N604) were shown as colored sticks and cartoon surrounded by density. e, f The residues of main difference between AAV8 (f) and AAVv128 (e) lied in the VP3 VIII variable region were shown as colored sticks. The residues that the insertion and the ‘pocket loop’ were labeled in a resplendent shade of red. g The identical or conserved residues were shown as letters with red or yellow backgrounds, while the non-conserved residues have a white background. The variable regions between different AAV serotypes were shown in cyan.
Fig. 7
Fig. 7. Intraocular injections in large animals to evaluate the transduction efficacy of AAV8 and AAVv128.
The New Zealand rabbit eyes treated by intravitreal injections or suprachoroidal injections of the AAV8 and AAVv128 confers detectable mCherry expression at days 28 post-injection (1 × 10¹¹ vg/eye, 100 μL volume, n = 4). a, c Immunofluorescence analysis of the New Zealand rabbit retinas after intravitreal injection (a) and suprachoroidal injection (c). b, d The retina-choroid tissues of the New Zealand rabbit retinas after intravitreal injection (b) and suprachoroidal injection (d) were isolated and their viral genomic DNA content were measured by qPCR (n = 4). Scale bars: 50 μm (down column) or 2 mm (up column). e Infrared imaging analysis of suprachoroidal injections in cynomolgus monkeys. NHPs eyes treated by suprachoroidal injection of the AAV8 and AAVv128 capsid confers detectable eGFP expression at days 14 post-injection (3.5×10¹² vg/eye, 100 μL volume, n = 1). f Transduction validation of NHPs eyes treated with AAV8 and AAVv128 by Scanning laser ophthalmoscopy (SLO); scale bars: 200 μm. GCL ganglion cell layer, INL inner nuclear layer, ONL outer nuclear layer. Values represent mean ± SD. P values were determined by a two-tailed Student t Test. #P < 0.05, ##P < 0.01, ###P < 0.001, ####P < 0.0001. Source data are provided as a Source Data file.
Fig. 8
Fig. 8. Laser-induced CNV model in NHPs are used to evaluate the efficacy of nAMD by AAVv128-anti-VEGF vector.
a The anti-VEGF protein levels of monkey treated with suprachoroidal injection of AAV8-anti-VEGF vector and AAVv128-anti-VEGF vector (1×10¹² vg/eye, 100 μL volume, n = 1) were measured at Day 56. AAV8-anti-VEGF vector and AAVv128-anti-VEGF vector were injected into suprachoroidal space at Day0, six laser spots were applied around the macula of each eye using laser at 28-days. The NHPs were sacrificed at Day 56 (after induction of choroidal neovascularization by Laser-induced CNV model) and eyes were harvested. The retinal tissues of the NHP retinas after suprachoroidal injection were isolated and the anti-VEGF protein expression level of AAV8-treated group and AAVv128-treated group were measured by ELISA. b Timeline of studying AAV-anti-VEGF vector to evaluate the efficacy of nAMD by using Laser-induced CNV model in NHP eyes. c, d Fluorescein fundus angiograph (FFA) was used to determine the number of Grade IV lesions. Representative FFA of NHP eyes treated with suprachoroidal injection of Vehicle, AAV8-anti-VEGF vector and AAVv128-anti VEGF vector at 35-days (c) and 49-days (d) (2×10¹² vg/eye, 100 μL volume, n = 8). e Percentage of Grade IV lesions with suprachoroidal injection of Vehicle (formulation buffer), AAV8-anti-VEGF vector and AAVv128-anti-VEGF vector. Numbers on the top of bars show the number of Grade IV lesions scored over the total number of assessable lesions (six laser spots/eye, n = 8). OD oculus dextrus, OS oculus sinister, FFA fundus fluorescence angiography. Values represent mean ± SD. P values were determined by one-way ANOVA. Compared with vehicle, *P < 0.05, **P < 0.01, ***P < 0.001, ****P < 0.0001. Compared with AAV8, #P < 0.05, ##P < 0.01 (P = 0.0074). n = 8/group. Source data are provided as a Source Data file.

References

    1. Hsu H-L, et al. Structural characterization of a novel human adeno-associated virus capsid with neurotropic properties. Nat. Commun. 2020;11:3279. doi: 10.1038/s41467-020-17047-1. - DOI - PMC - PubMed
    1. Mendell JR, et al. Current clinical applications of in vivo gene therapy with AAVs. Mol. Ther. 2021;29:464–488. doi: 10.1016/j.ymthe.2020.12.007. - DOI - PMC - PubMed
    1. Hastie E, Samulski RJ. Adeno-associated virus at 50: a golden anniversary of discovery, research, and gene therapy success-a personal perspective. Hum. Gene Ther. 2015;26:257–265. doi: 10.1089/hum.2015.025. - DOI - PMC - PubMed
    1. Li C, Samulski RJ. Engineering adeno-associated virus vectors for gene therapy. Nat. Rev. Genet. 2020;21:255–272. doi: 10.1038/s41576-019-0205-4. - DOI - PubMed
    1. Wang D, Tai PWL, Gao G. Adeno-associated virus vector as a platform for gene therapy delivery. Nat. Rev. Drug Discov. 2019;18:358–378. doi: 10.1038/s41573-019-0012-9. - DOI - PMC - PubMed

Publication types

MeSH terms

Substances