. 2024 Jun;27(6):1125-1136.
doi: 10.1038/s41593-024-01634-2. Epub 2024 May 6.

Targeting pathological cells with senolytic drugs reduces seizures in neurodevelopmental mTOR-related epilepsy

Affiliations

Targeting pathological cells with senolytic drugs reduces seizures in neurodevelopmental mTOR-related epilepsy

Théo Ribierre et al. Nat Neurosci. 2024 Jun.

Abstract

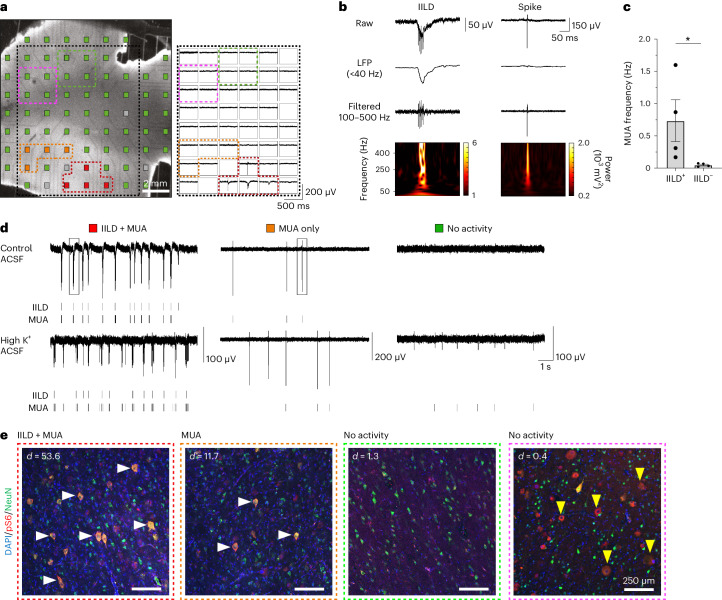
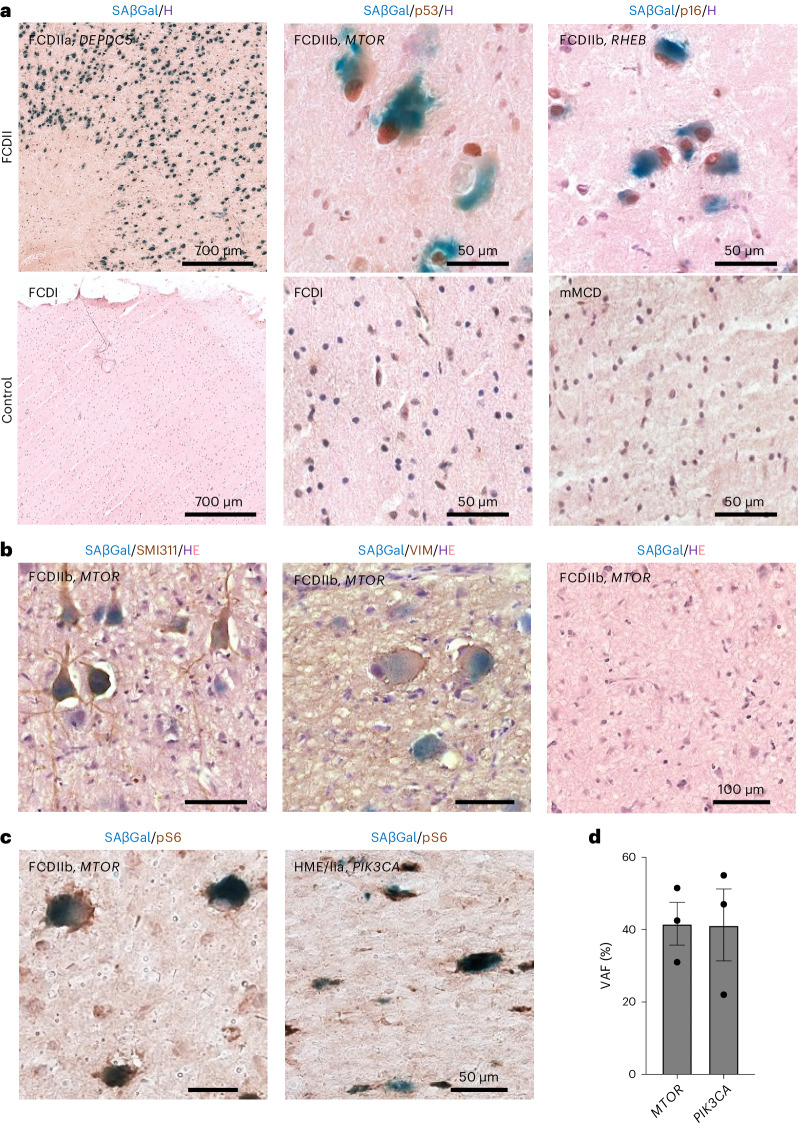
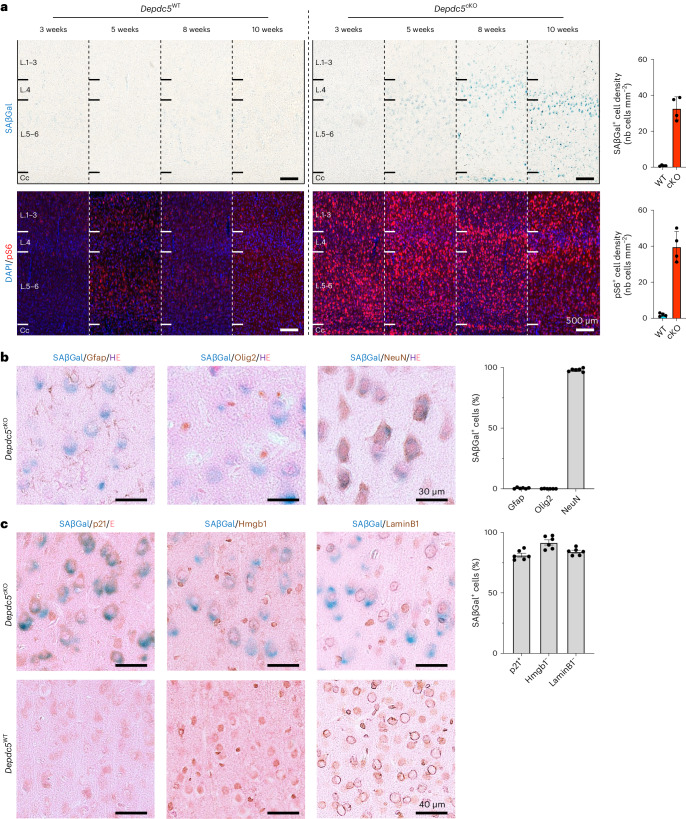
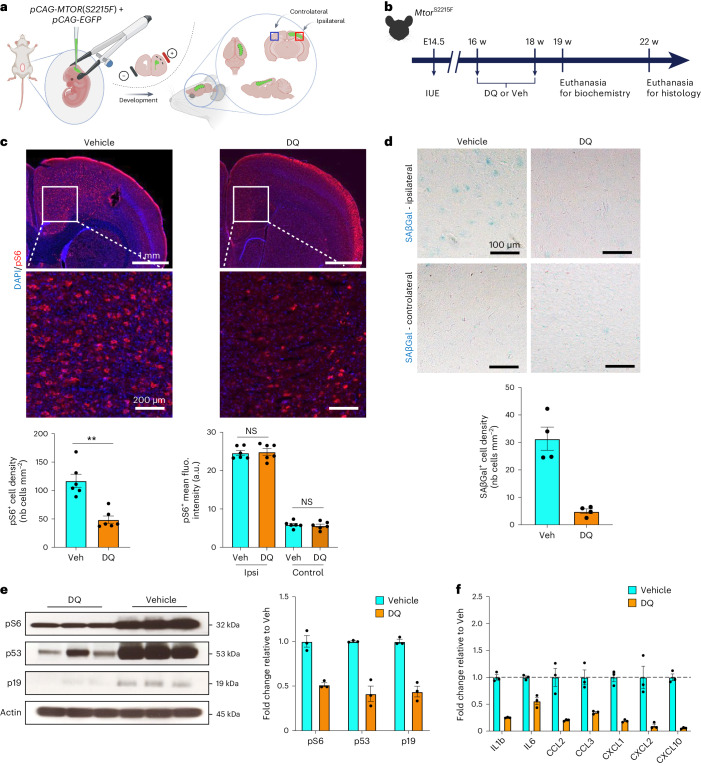
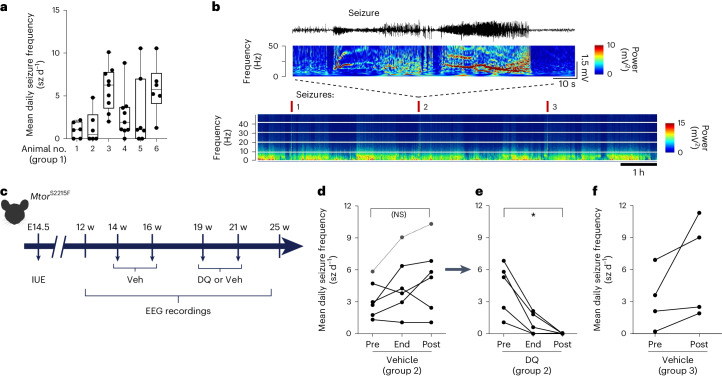
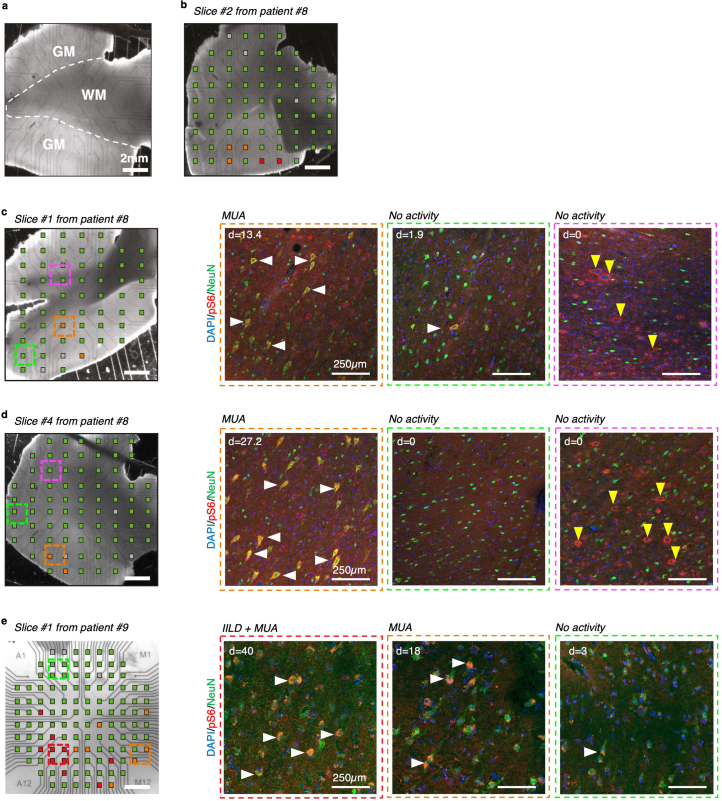
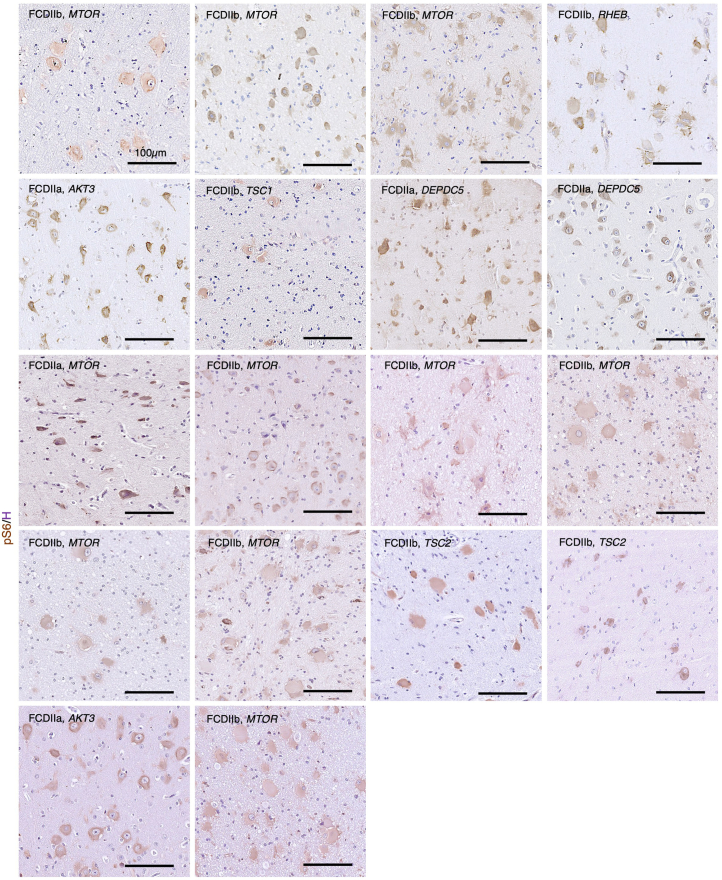
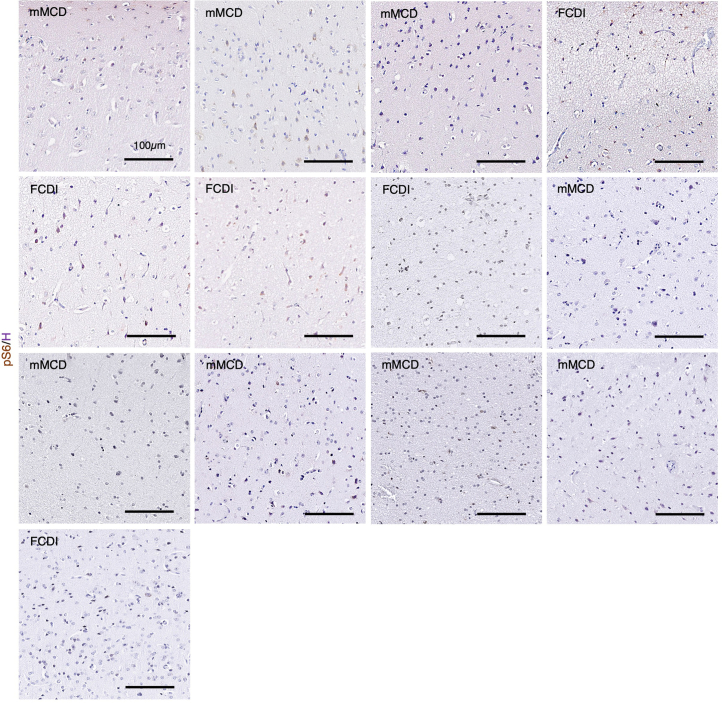
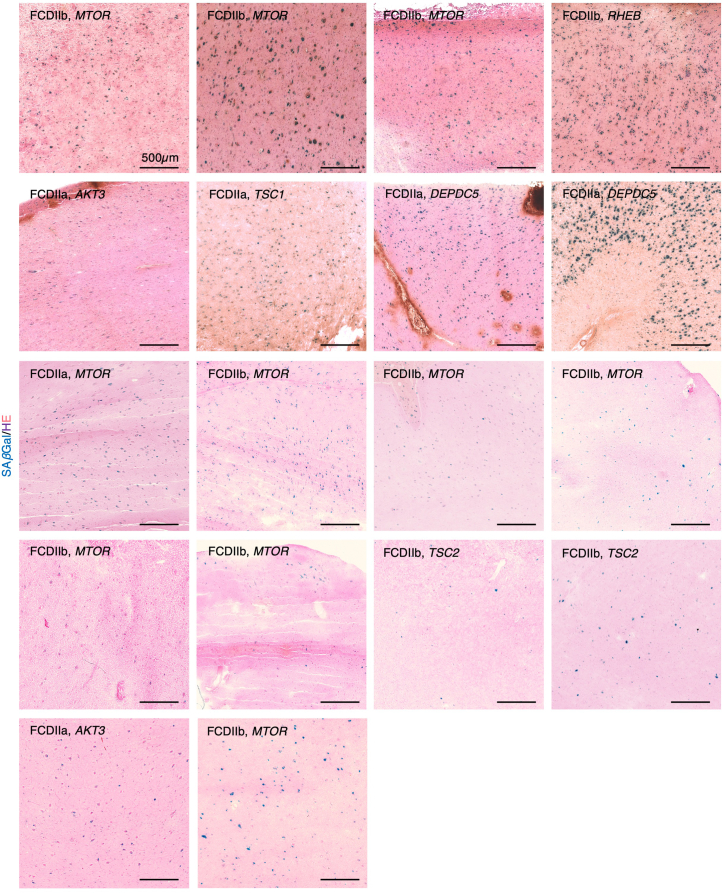
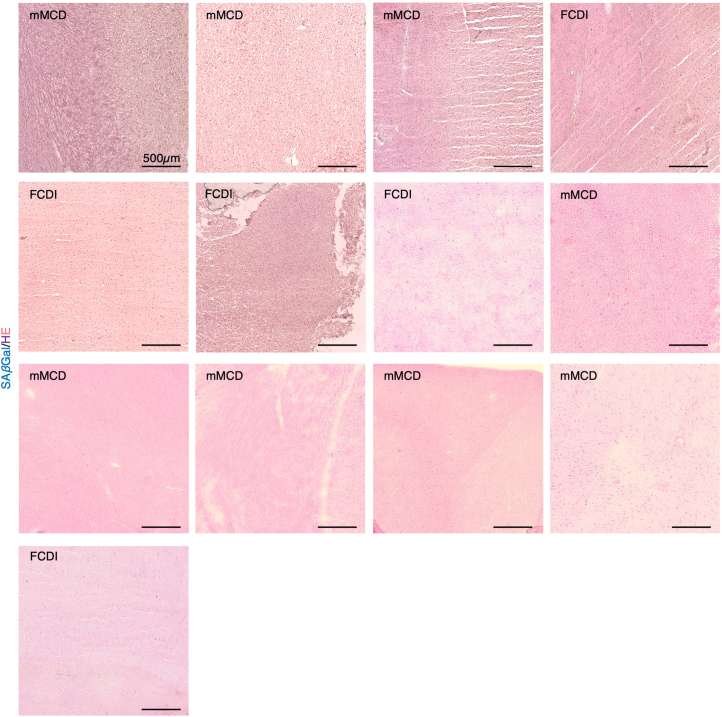
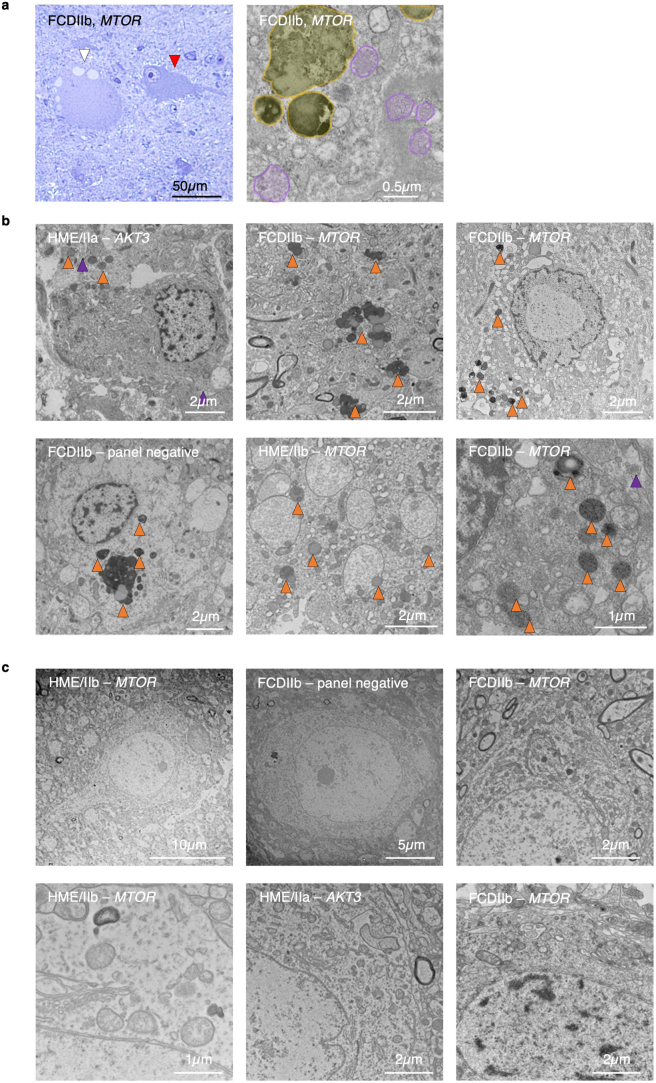
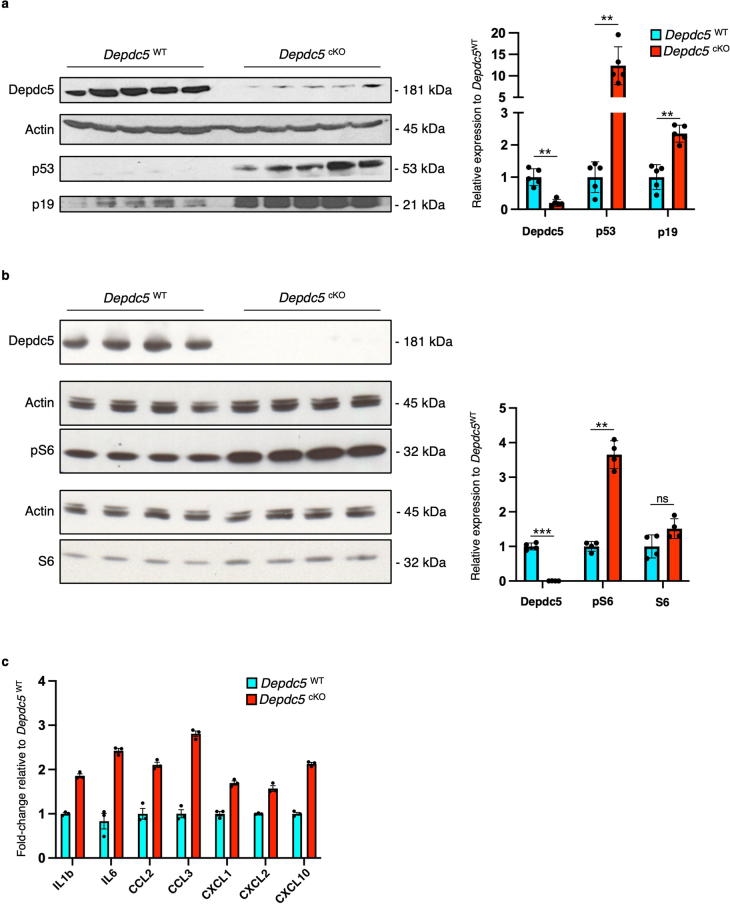
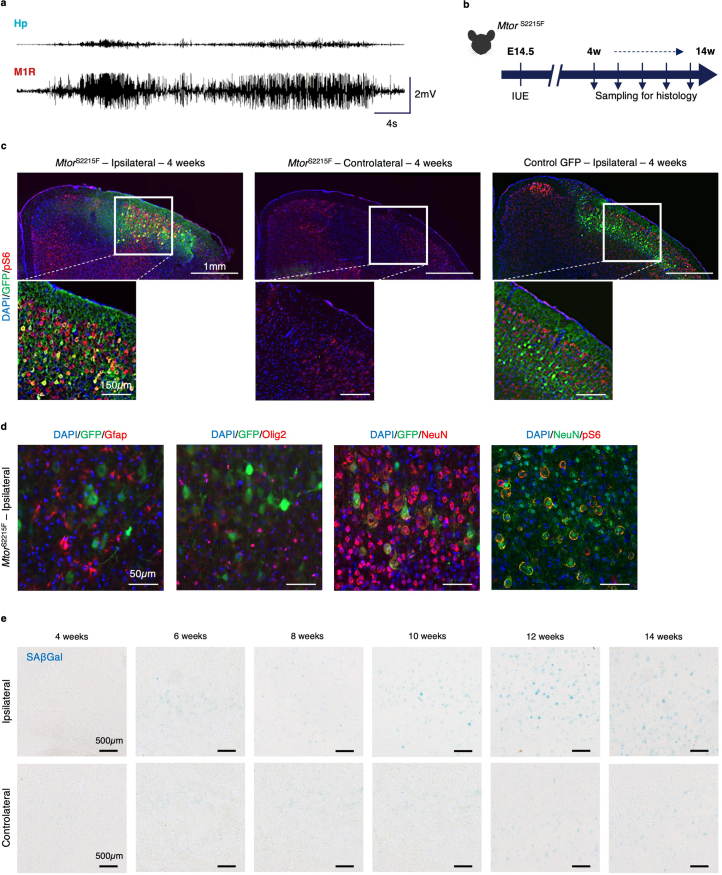
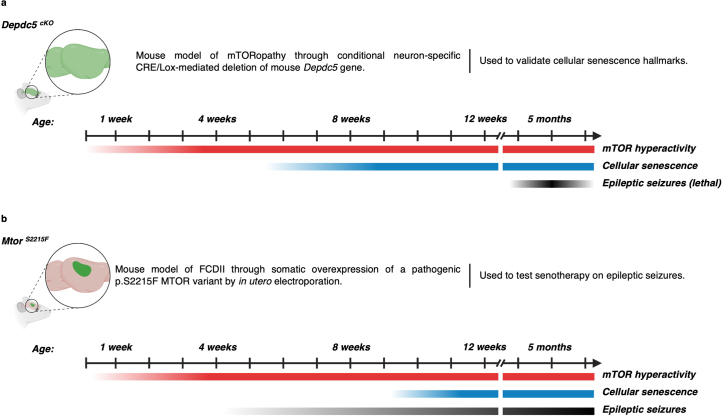
Cortical malformations such as focal cortical dysplasia type II (FCDII) are associated with pediatric drug-resistant epilepsy that necessitates neurosurgery. FCDII results from somatic mosaicism due to post-zygotic mutations in genes of the PI3K-AKT-mTOR pathway, which produce a subset of dysmorphic cells clustered within healthy brain tissue. Here we show a correlation between epileptiform activity in acute cortical slices obtained from human surgical FCDII brain tissues and the density of dysmorphic neurons. We uncovered multiple signatures of cellular senescence in these pathological cells, including p53/p16 expression, SASP expression and senescence-associated β-galactosidase activity. We also show that administration of senolytic drugs (dasatinib/quercetin) decreases the load of senescent cells and reduces seizure frequency in an MtorS2215F FCDII preclinical mouse model, providing proof of concept that senotherapy may be a useful approach to control seizures. These findings pave the way for therapeutic strategies selectively targeting mutated senescent cells in FCDII brain tissue.


Conflict of interest statement

The authors declare no competing interests.

Figures

Fig. 1
Fig. 1. Spontaneous interictal-like activity and dysmorphic neuron topography in human FCDIIb brain cortical slices.
a, Left, micrograph of a cortical slice of resected brain tissue from a patient with FCDIIb (patient ID 8, slice 3) showing MEA layout. Electrodes are color-coded to indicate the type of activity detected (red: IILDs and MUA; orange: MUA only; green/pink: no activity; gray: defective electrodes). Right, representative recording of the simultaneous activity on the electrodes located within the area delimited by the black dotted lines. Recordings from electrodes with IILDs+MUA or MUA only are outlined and color-coded as in the left panel. b, Top, representative traces of the raw signal of an IILD (left) or a spike (right) from the two boxed portions of recordings shown in d. The signal is represented after low-pass filtering (<40 Hz) to reveal the slow component of the IILD or band-pass filtering (100–500 Hz) to reveal spikes and high-frequency oscillations. Spectrograms of the raw signals (bottom) show that the IILD includes high-frequency components superimposed on a slow oscillation, whereas the spike shows only a sharp, high-frequency component. c, Mean MUA frequency recorded in slice 3 from n = 4 electrodes displaying IILDs (IILD+) and n = 4 without IILDs (IILD). *P = 0.0286, two-tailed Mann–Whitney rank-sum test. d, Representative recordings from color-coded electrodes shown in a, with corresponding raster plots of IILDs and MUA. Recordings are shown in control ACSF and after switching to high-K+ ACSF to promote neuronal activity. Note that MUA increases in all three recorded areas, whereas IILDs remain restricted to the electrode that previously displayed them. e, Immunofluorescent stainings from slice 3 with antibodies against pS6 (red) and NeuN (green) in areas delineated by color-coded dashed lines in a. White horizontal arrows indicate DNs (NeuN+/pS6+) and yellow vertical arrows indicate BCs (NeuN/pS6+). density (d) = number of dysmorphic neurons per mm2. Scatter dot plots are presented as mean ± s.e.m. LFP, local field potential. Source data
Fig. 2
Fig. 2. Cellular senescence hallmarks in FCDII surgical tissues.
a, Representative SAβGal colorimetric assay (blue), p53 (brown) or p16 (brown) immunohistochemistry and hematoxylin (H; purple) counterstaining on FCDII samples (left to right: patient ID 10 (wider field of view), patient ID 3 and patient ID 14 and epilepsy control samples (left to right: patient ID 15 (wider field of view), patient ID 15 and patient ID 16)). b, SAβGal colorimetric assay (blue), SMI311 (brown) or VIM (brown) immunohistochemistry and hematoxylin and eosin (H, purple; E, pink) counterstaining on a FCDIIb sample (patient ID 8, slice 3) used for MEA recordings in a region with SMI311+ DNs (left), VIM+ BCs (middle) or without pathogenic cells (right). c, SAβGal colorimetric assay (blue) and pS6 (brown) immunohistochemistry on (left) MTOR-related FCDIIb (patient ID 3) and (right) PIK3CA-related HME/IIa (patient ID 13). d, VAF in n = 3 pools of n = 70–80 microdissected SAβGal+/pS6+ cytomegalic cells per pool from one MTOR-related FCDIIb (patient 3) and one PIK3CA-related HME/IIa (patient ID 13). Each dot indicates a biological replicate. Scatter dot plots are presented as mean ± s.e.m. Source data
Fig. 3
Fig. 3. Cellular senescence hallmarks in a mouse model of Depdc5 deficiency.
a, SAβGal colorimetric assay (top, blue) and pS6 immunostaining (bottom, red) on Depdc5WT and Depdc5cKO animals from 3 weeks to 10 weeks of age and quantification of the density of SAβGal+ and pS6+ cells per mm2 in 10-week-old Depdc5WT (n = 4) and Depdc5cKO (n = 4) mice. Cc, corpus callosum; L.1–3, cortical layers 1 to 3; L.4, cortical layer 4; L.5–6, cortical layers 5 and 6. b, SAβGal colorimetric assay (blue) and immunohistochemistry against neural cellular markers (DAB) on Depdc5cKO animals at 10 weeks of age. Quantification of the percentage of SAβGal+ cells positive for Gfap, Olig2 or NeuN in n = 6 samples of 10-week-old Depdc5cKO mice (two slices from rostral and caudal regions per n = 3 animals). c, SAβGal colorimetric assay (blue) and immunohistochemistry against cellular senescence markers (DAB) on Depdc5WT and Depdc5cKO animals at 10 weeks of age. Quantification of the percentage of SAβGal+ cells positive for p21 and negative for nuclear Hmgb1 and LaminB1 in n = 6 samples of 10-week-old Depdc5cKO mice (two slices from rostral and caudal regions per n = 3 animals). Scatter dot plots are presented as mean ± s.e.m. nb, number of. Source data
Fig. 4
Fig. 4. Clearance of senescent cells after DQ administration in MtorS2215F animals.
a, Experimental design of IUE targeting layer 2/3 pyramidal cell-destined progenitor cells lining the dorsal ventricular zone at E14.5 and subsequent localization of the electroporated area in one hemisphere. b, Study design for IUE, histological and biochemical experiments. c, Top, representative images of immunofluorescent staining against pS6 (red) and DAPI (blue) on MtorS2215F mice after vehicle or DQ administration. Bottom, quantification of pS6+ cell density and pS6+ cell mean fluorescence intensity on n = 6 vehicle-treated and n = 6 DQ-treated MtorS2215F animals (each dot corresponds to one animal). **P = 0.0022 and NS, not significant, two-tailed Mann–Whitney test. d, Top, representative bright-field images of SAβGal colorimetric assay (blue) on MtorS2215F animals after vehicle or DQ administration in ipsilateral and controlateral regions. Bottom, quantification of SAβGal+ cell density in ipsilateral on n = 4 vehicle-treated and n = 4 DQ-treated MtorS2215F animals (each dot corresponds to one animal). e, Western blot on electroporated cortical brain lysates against pS6, p53 and p19 from n = 3 vehicle-treated and n = 3 DQ-treated MtorS2215F mice. Histogram showing the relative expression of pS6, p53 and p19 to actin (each dot corresponds to one animal). f, Histograms showing the quantification of canonical SASP cytokine production in the same brain lysates as d of n = 3 vehicle-treated and n = 3 DQ-treated MtorS2215F animals (averaging two technical replicates per animal). Values are normalized to the mean of vehicle-treated MtorS2215F animals. Scatter dot plots are presented as mean ± s.e.m. fluo., fluorescence; nb, number of; Veh, vehicle; w, weeks. Source data
Fig. 5
Fig. 5. Beneficial effect of DQ administration on epileptic seizures in MtorS2215F animals.
a, Mean daily seizure frequency in n = 6 individual MtorS2215F animals over 6–9 recording sessions on three consecutive days (410–641 h). Data are presented as box plots and have the following values (minimum, 25th percentile, median, 75th percentile, maximum, mean, s.d. and s.e.m.): 1 (0, 0, 1, 2, 2.2, 1, 0.92 and 0.38); 2 (0, 0, 0.48, 2.8, 4.8, 1.3, 1.9 and 0.78), 3 (2, 3.5, 6.3, 7.8, 10, 5.9 and 2.6); 4 (0, 1, 1.9, 3.7, 8.8, 2.7, 2.6 and 0.88); 5 (0, 0, 1, 7, 11, 3, 4.1 and 1.6); and 6 (1.3, 4.1, 5.7, 7.7, 11 and 5.8, 3). b, Top, representative EEG trace and corresponding FFT power spectrum over 1 min of recording. Bottom, representative color-coded FFT power spectrum over 7 h of recording showing seizures annotated with red ticks and reflected by sharp increases in frequency and amplitude. The data shown were extracted from one cortical electrode located in the somatosensory S1 cortical area of one non-treated MtorS2215F animal. c, Study design for longitudinal in vivo experiments and timepoints of analyses. d, Mean daily seizure frequency in n = 6 individual MtorS2215F animals over 2 weeks before vehicle administration (‘Pre’), over 48 h after the end of vehicle administration (‘End’) and over 3 weeks after vehicle administration (‘Post’). Statistics: two-tailed Mann–Whitney test. Not significant (NS): P = 0.4375. e, Mean daily seizure frequency in the same n = 5 individual MtorS2215F animals over 3 weeks before DQ administration (‘Pre’), over 48 h after the end of DQ administration (‘End’) and over 4 weeks after DQ administration (‘Post’). One animal (dashed lines) died from seizures during the interphase between vehicle and DQ administration. Statistics: two-tailed Mann–Whitney test. *P = 0.0312. f, Mean daily seizure frequency in n = 4 MtorS2215F animals over 2 weeks before (‘Pre’) and 2 weeks after (‘Post’) vehicle administration. Each dot corresponds to one animal. Veh, vehicle; w, weeks. Source data
Extended Data Fig. 1
Extended Data Fig. 1. Cortical activity and dysmorphic neuron topography in human FCDIIb brain cortical slices.
(a) Representative delineation of gray-white matter boundary. GM: gray matter, WM: white matter. (b-e) (Left) Micrographs of cortical slices of resected tissue from FCDIIb patients showing multielectrode array (MEA) layout. Electrodes are color-coded to show the type of activity detected (Red: IILD + MUA; Orange: MUA only; Green: no activity; Gray: damaged electrode). Scale bar: 2 mm. (Right) Immunofluorescent staining from the corresponding cortical slice with antibodies against pS6 (red) and NeuN (green) in regions delineated by color-coded dashed lines on MEA layout. Dysmorphic neurons (DNs) are identified by horizontal white arrows and balloon cells (BCs) are identified by vertical yellow arrows. d: density = number of DNs/mm2. Cortical slices represented are: (b) Slice #2 from patient ID#8 (for which no immunofluorescent staining is available); (c) Slice #1 from patient ID#8; (d) Slice #4 from patient ID#8; (e) Slice #1 from patient ID#9. MEA recordings and histology stainings on the same sections could only be performed once on each slice. Source data
Extended Data Fig. 2
Extended Data Fig. 2. mTOR pathway activity in FCDII epileptic surgical tissues.
Representative pS6 (brown) immunohistochemistry and hematoxylin (H; purple) counterstaining on n = 18 FCDII/HME samples (left to right, top to bottom: ID#6, 3, 5, 14, 12, 1, 2, 10, 21, 22, 23, 24, 25, 26, 27, 28, 29, 30). Scale bar: 100um.
Extended Data Fig. 3
Extended Data Fig. 3. mTOR pathway activity in control epileptic surgical tissues.
Representative pS6 (brown) immunohistochemistry and hematoxylin (H; purple) counterstaining on n = 13 control epileptic resected brain tissues negative for mTOR-pathway genes mutations by gene-panel deep-sequencing (left to right, top to bottom: ID#16, 18, 20, 15, 17, 19, 31, 32, 33, 34, 35, 36, 37). Scale bar: 100um.
Extended Data Fig. 4
Extended Data Fig. 4. SAβGal colorimetric assay in FCDII epileptic surgical tissues.
Representative images of SAβGal colorimetric assay and HE coloration on n = 18 FCDII/HME samples carrying pathogenic variants in MTOR-pathway genes (left to right, top to bottom: ID#6, 3, 5, 14, 12, 1, 2, 10, 21, 22, 23, 24, 25, 26, 27, 28, 29, 30). Scale bar: 500um.
Extended Data Fig. 5
Extended Data Fig. 5. SAβGal colorimetric assay in control epileptic surgical tissues.
Representative images of SAβGal colorimetric assay and HE coloration on n = 13 control epileptic resected brain tissues negative for mTOR-pathway genes mutations by gene-panel deep-sequencing. (left to right, top to bottom: ID#16, 18, 20, 15, 17, 19, 31, 32, 33, 34, 35, 36, 37).
Extended Data Fig. 6
Extended Data Fig. 6. Macromolecular content in cytomegalic and normal-appearing FCDII cells.
(a) (Left) Toluidine blue staining showing a cytomegalic cell with a soma diameter >25μm (white arrow) and a normal-appearing cell (red arrow) in an MTOR-related FCDIIb tissue (ID#3). (Right) Electron microscopy images of the intracellular content of a cytomegalic cell from the same tissue. Orange shade: lysosomes. Purple shade: multivesicular bodies. (b) Representative images of cytomegalic cells in n = 5 FCDII resected brain tissues showing abnormal accumulation of electron-dense enlarged lysosomes (orange arrows) and multivesicular bodies (purple arrows). Patient IDs (left to right, top to bottom): #12, 3, 4, 7, 11, 3. (c) Representative images of normal-appearing cells in the same panel of n = 6 FCDII cases showing typical cytoplasmic content. Patient IDs (left to right, top to bottom): #11, 7, 3, 11, 12, 3. Electron microscopy imaging was repeated at least three times.
Extended Data Fig. 7
Extended Data Fig. 7. Cellular senescence in a mouse model of Depdc5-deficiency.
(a) Western blotting against Depdc5, p53 and p19 on n = 5 Depdc5WT and n = 5 Depdc5cKO 10-weeks old mice (corresponding to 5 biological replicates). Histogram showing the relative expression of Depdc5, p53 and p19 to Actin, normalized to Depdc5WT. **P = 0.0079; Two-tailed Mann-Whitney test. (b) Western blotting against Depdc5, pS6 and total S6 on n = 4 Depdc5WT and n = 4 Depdc5cKO 10-weeks old mice (corresponding to 4 biological replicates). Histogram showing the relative expression of Depdc5, pS6 and total S6 to Actin, normalized to Depdc5WT. **P = 0.0286; Two-tailed Mann-Whitney test. (c) Histograms showing the quantification of canonical SASP interleukins and cytokines production in n = 3 Depdc5WT and n = 3 Depdc5cKO brain lysates at 10-weeks of age (averaging 2 technical replicates per animal). Values are normalized to the mean of Depdc5WT. Dots indicate all replicates. Scatter dot plots are presented as mean ± SEM. Source data
Extended Data Fig. 8
Extended Data Fig. 8. Histological and seizure characteristics of MtorS2215F animals.
(a) EEG trace of a spontaneous seizure occurring at 6 weeks of age MtorS2215F mouse; ictal activity is mostly seen in the cortex. Hp: hippocampal electrode; M1R: right motor cortex area electrode (b) Study design for histology analyses. (c) Immunofluorescence against pS6 (red), GFP (green) and DAPI (blue) on MtorS2215F and control mice aged 4 weeks. (d) Immunofluorescence against DAPI (blue), GFP or NeuN (green) and neural markers or pS6 (red) on MtorS2215F mice aged 4 weeks. (e) SAβGal colorimetric assay (blue) on MtorS2215F mice from 4 to 14 weeks of age in the electroporated area (top, ipsilateral) and corresponding cortical region of the opposite hemisphere (bottom, contralateral). Colorimetric assays were repeated twice and immunostainings were repeated at least three times.
Extended Data Fig. 9
Extended Data Fig. 9. Summary of cellular and behavioral phenotypes in Depdc5cKO and MtorS2215F mouse models.
(a) Description of the Depdc5cKO mouse model of mTORopathy. (b) Description of the MtorS2215F mouse model of FCDII. The timeline of mTOR hyperactivity (red), cellular senescence (blue) and epileptic seizure (black) onsets is represented.

Comment in

  • Reducing seizures with senolytic drugs.
    Crunkhorn S. Crunkhorn S. Nat Rev Drug Discov. 2024 Jul;23(7):499. doi: 10.1038/d41573-024-00092-6. Nat Rev Drug Discov. 2024. PMID: 38822116 No abstract available.

References

    1. Guerrini R, Barba C. Focal cortical dysplasia: an update on diagnosis and treatment. Exp. Rev. Neurother. 2021;21:1213–1224. - PubMed
    1. Blumcke I, et al. Histopathological findings in brain tissue obtained during epilepsy surgery. N. Engl. J. Med. 2017;377:1648–1656. - PubMed
    1. Lamparello P, et al. Developmental lineage of cell types in cortical dysplasia with balloon cells. Brain. 2007;130:2267–2276. - PubMed
    1. Bizzotto S, Walsh CA. Genetic mosaicism in the human brain: from lineage tracing to neuropsychiatric disorders. Nat. Rev. Neurosci. 2022;23:275–286. - PubMed
    1. Blumcke I, et al. Neocortical development and epilepsy: insights from focal cortical dysplasia and brain tumours. Lancet Neurol. 2021;20:943–955. - PubMed