

Contribution of parasite and host genotype to immunopathology of schistosome infections
- PMID: 38711063
- PMCID: PMC11073996
- DOI: 10.1186/s13071-024-06286-6
Contribution of parasite and host genotype to immunopathology of schistosome infections
Abstract
Background: The role of pathogen genotype in determining disease severity and immunopathology has been studied intensively in microbial pathogens including bacteria, fungi, protozoa and viruses but is poorly understood in parasitic helminths. The medically important blood fluke Schistosoma mansoni is an excellent model system to study the impact of helminth genetic variation on immunopathology. Our laboratory has demonstrated that laboratory schistosome populations differ in sporocyst growth and cercarial production in the intermediate snail host and worm establishment and fecundity in the vertebrate host. Here, we (i) investigate the hypothesis that schistosome genotype plays a significant role in immunopathology and related parasite life history traits in the vertebrate mouse host and (ii) quantify the relative impact of parasite and host genetics on infection outcomes.
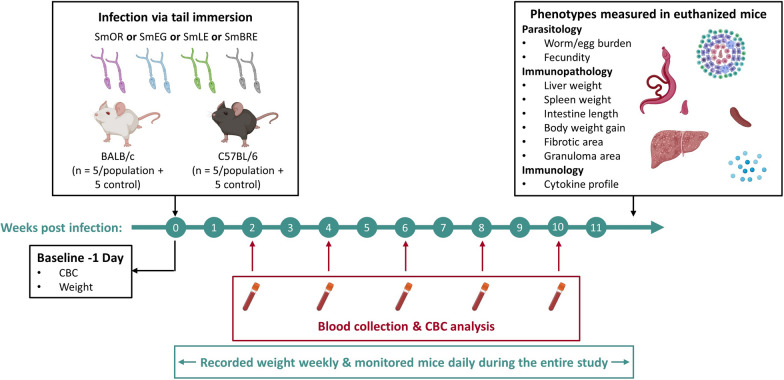
Methods: We infected BALB/c and C57BL/6 mice with four different laboratory schistosome populations from Africa and the Americas. We quantified disease progression in the vertebrate host by measuring body weight and complete blood count (CBC) with differential over a 12-week infection period. On sacrifice, we assessed parasitological (egg and worm counts, fecundity), immunopathological (organ measurements and histopathology) and immunological (CBC with differential and cytokine profiles) characteristics to determine the impact of parasite and host genetics.
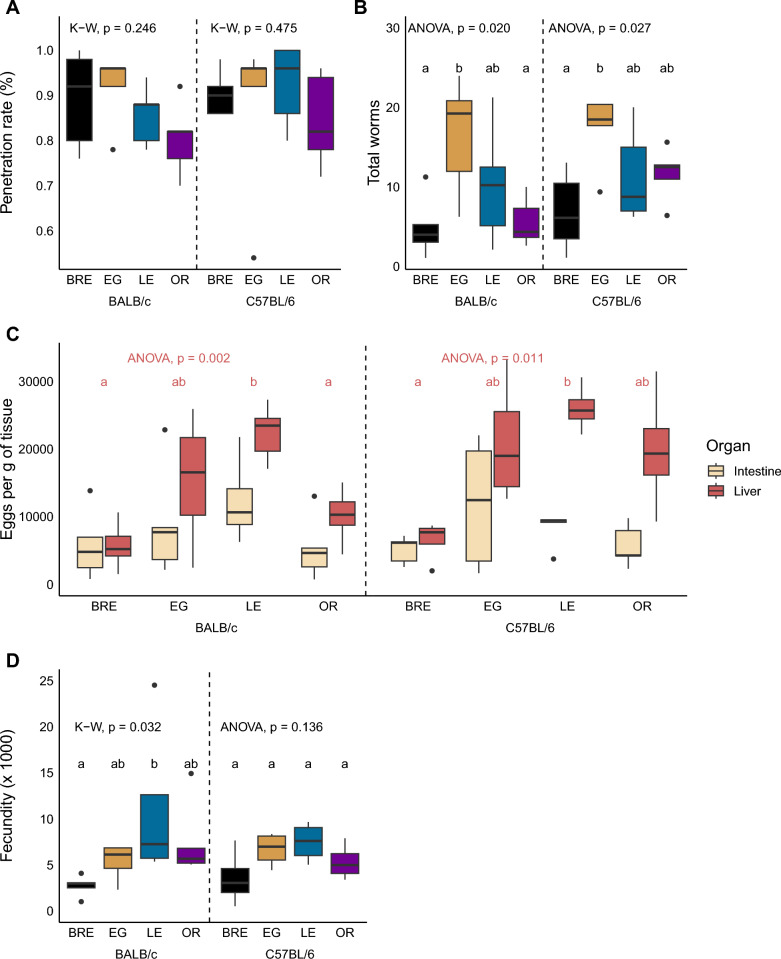
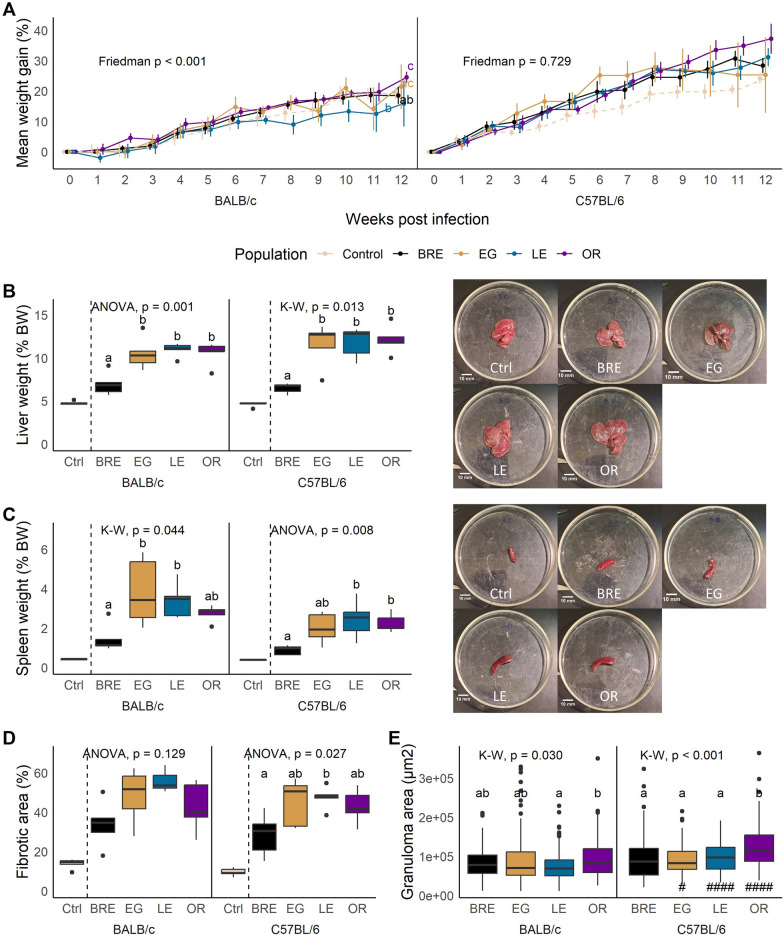
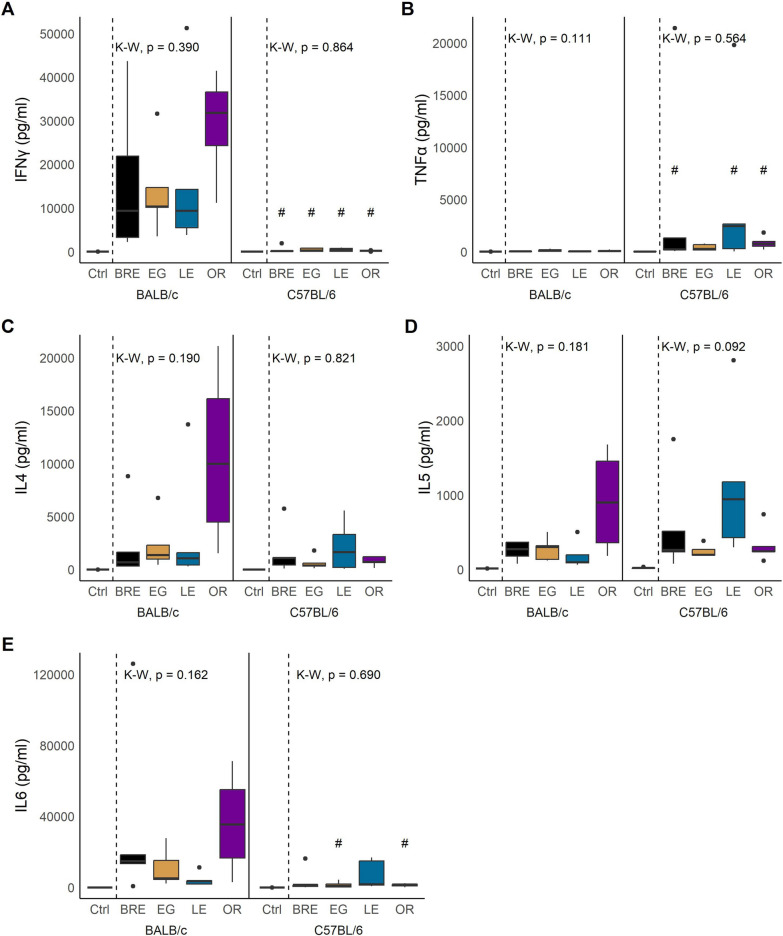
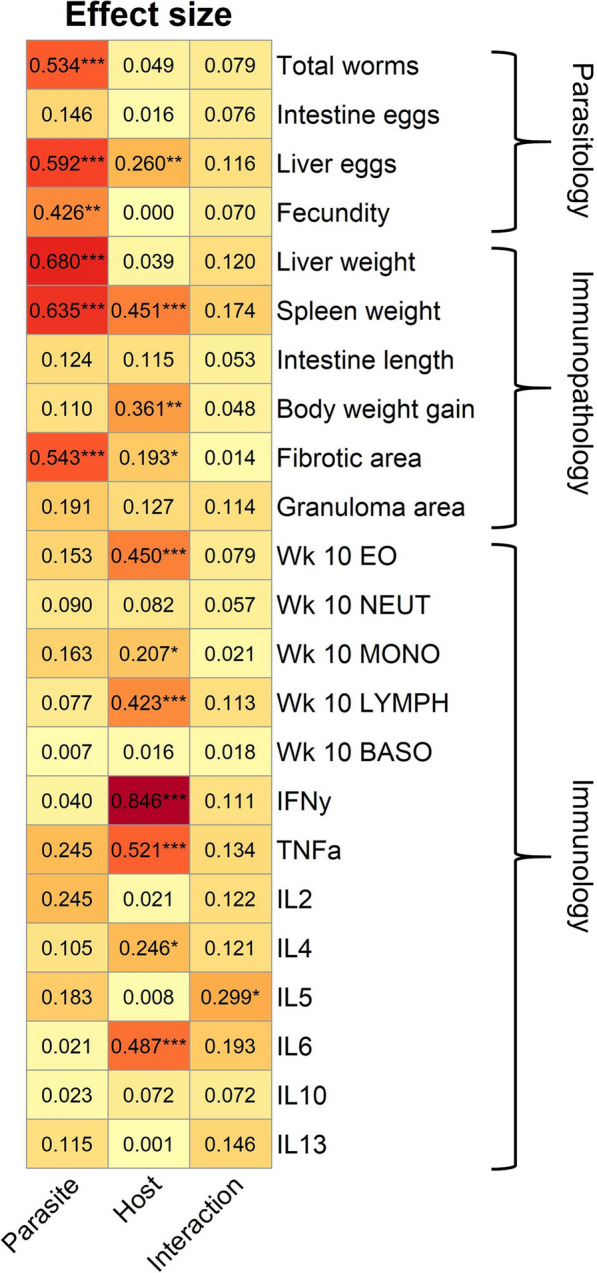
Results: We found significant variation between parasite populations in worm numbers, fecundity, liver and intestine egg counts, liver and spleen weight, and fibrotic area but not in granuloma size. Variation in organ weight was explained by egg burden and intrinsic parasite factors independent of egg burden. We found significant variation between infected mouse lines in cytokine levels (IFN-γ, TNF-α), eosinophils, lymphocytes and monocyte counts.
Conclusions: This study showed that both parasite and host genotype impact the outcome of infection. While host genotype explains most of the variation in immunological traits, parasite genotype explains most of the variation in parasitological traits, and both host and parasite genotypes impact immunopathology outcomes.
Keywords: Schistosoma mansoni; BALB/c mouse; C57BL/6 mouse; Host-parasite interaction; Immunopathogenesis.
© 2024. The Author(s).
Conflict of interest statement
The authors declare that they have no competing interests.
Figures

Update of
-
Contribution of parasite and host genotype to immunopathology of schistosome infections.bioRxiv [Preprint]. 2024 Jan 13:2024.01.12.574230. doi: 10.1101/2024.01.12.574230. bioRxiv. 2024. Update in: Parasit Vectors. 2024 May 7;17(1):203. doi: 10.1186/s13071-024-06286-6. PMID: 38260613 Free PMC article. Updated. Preprint.
-
Contribution of parasite and host genotype to immunopathology of schistosome infections.Res Sq [Preprint]. 2024 Jan 16:rs.3.rs-3858151. doi: 10.21203/rs.3.rs-3858151/v1. Res Sq. 2024. Update in: Parasit Vectors. 2024 May 7;17(1):203. doi: 10.1186/s13071-024-06286-6. PMID: 38313261 Free PMC article. Updated. Preprint.
References
-
- Mlcochova P, Kemp S, Dhar MS, Papa G, Meng B, Ferreira IATM, et al. SARS-CoV-2 B.1.617.2 Delta variant replication and immune evasion. Nature. 2021;599:114–9. https://www.nature.com/articles/s41586-021-03944-y. - PMC - PubMed
-
- Schulze H, Bayer W. Changes in symptoms experienced by SARS-CoV-2-infected individuals – from the first wave to the omicron variant. Front Virol. 2022;2:880707. doi: 10.3389/fviro.2022.880707. - DOI
-
- Mueller M, Tainter CR. Escherichia coli Infection. StatPearls. Treasure Island (FL): StatPearls Publishing; 2023 [cited 2023 Jun 6]. http://www.ncbi.nlm.nih.gov/books/NBK564298/ - PubMed
MeSH terms
Substances
Grants and funding
LinkOut - more resources
Full Text Sources
Research Materials
