. 2024 May 6;23(1):90.
doi: 10.1186/s12943-024-02008-9.

Positive feedback regulation between glycolysis and histone lactylation drives oncogenesis in pancreatic ductal adenocarcinoma

Affiliations

Positive feedback regulation between glycolysis and histone lactylation drives oncogenesis in pancreatic ductal adenocarcinoma

Fei Li et al. Mol Cancer. .

Abstract

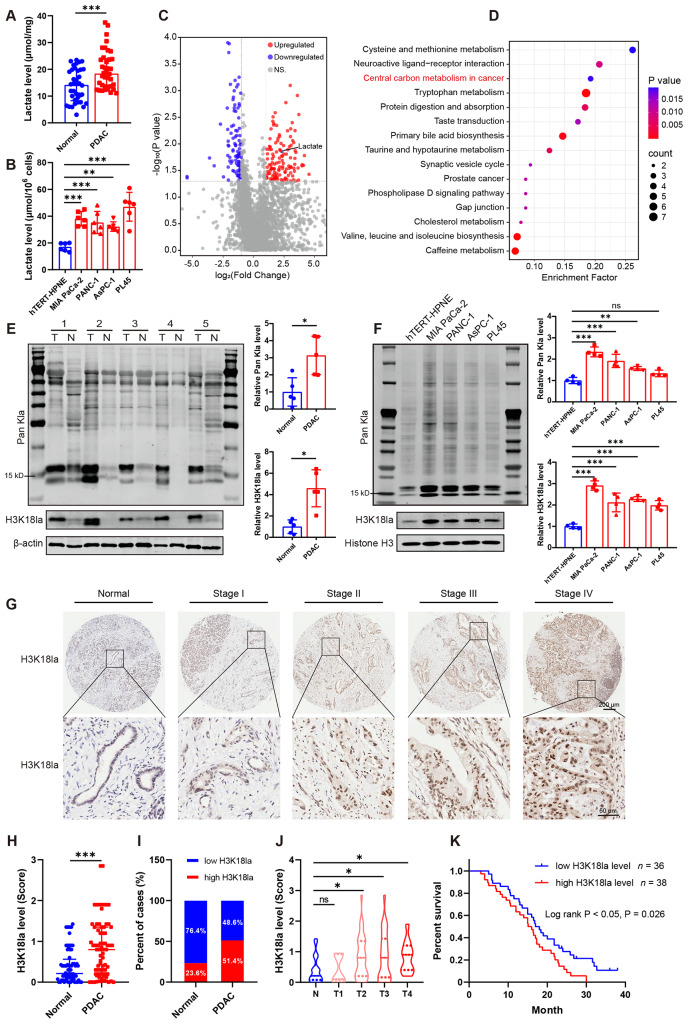
Background: Metabolic reprogramming and epigenetic alterations contribute to the aggressiveness of pancreatic ductal adenocarcinoma (PDAC). Lactate-dependent histone modification is a new type of histone mark, which links glycolysis metabolite to the epigenetic process of lactylation. However, the role of histone lactylation in PDAC remains unclear.

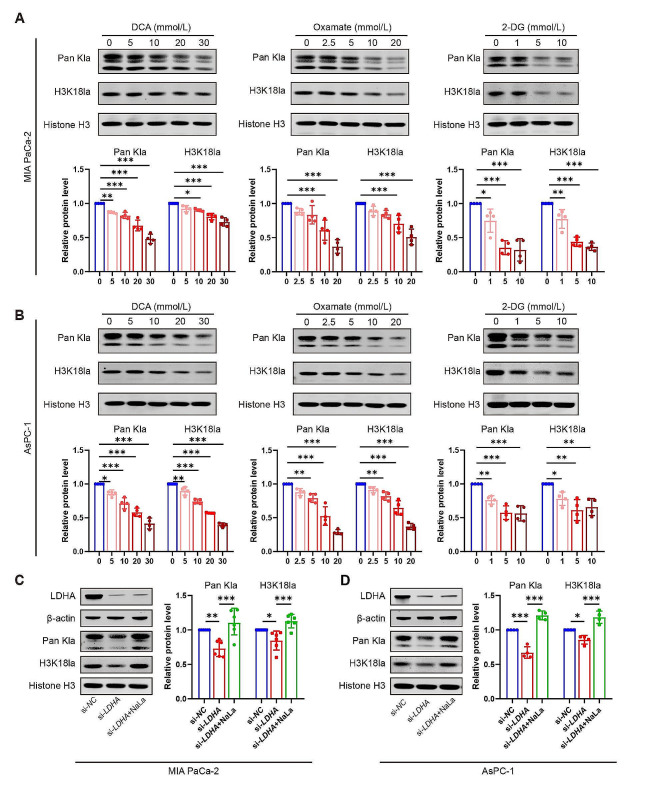
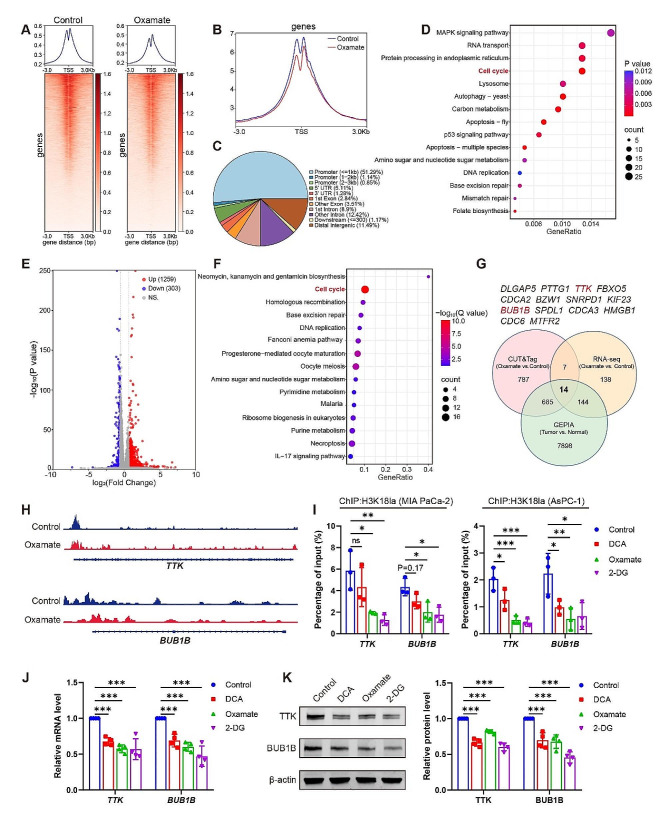
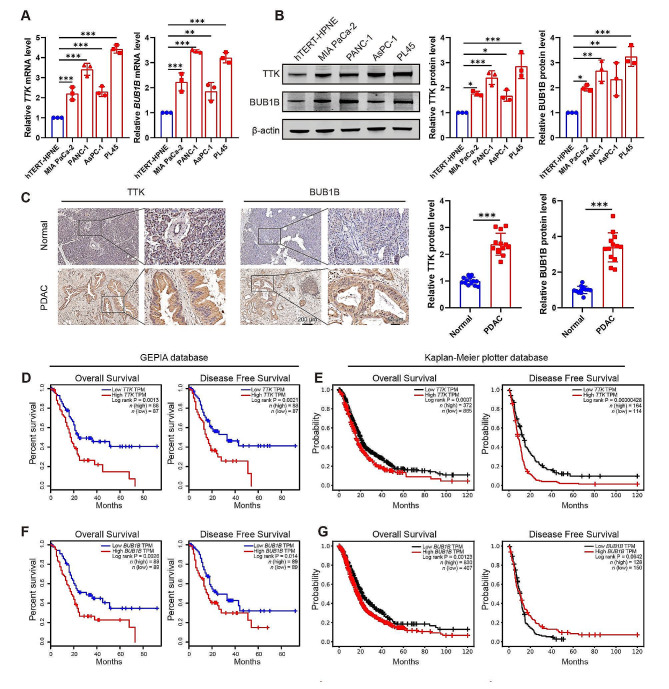
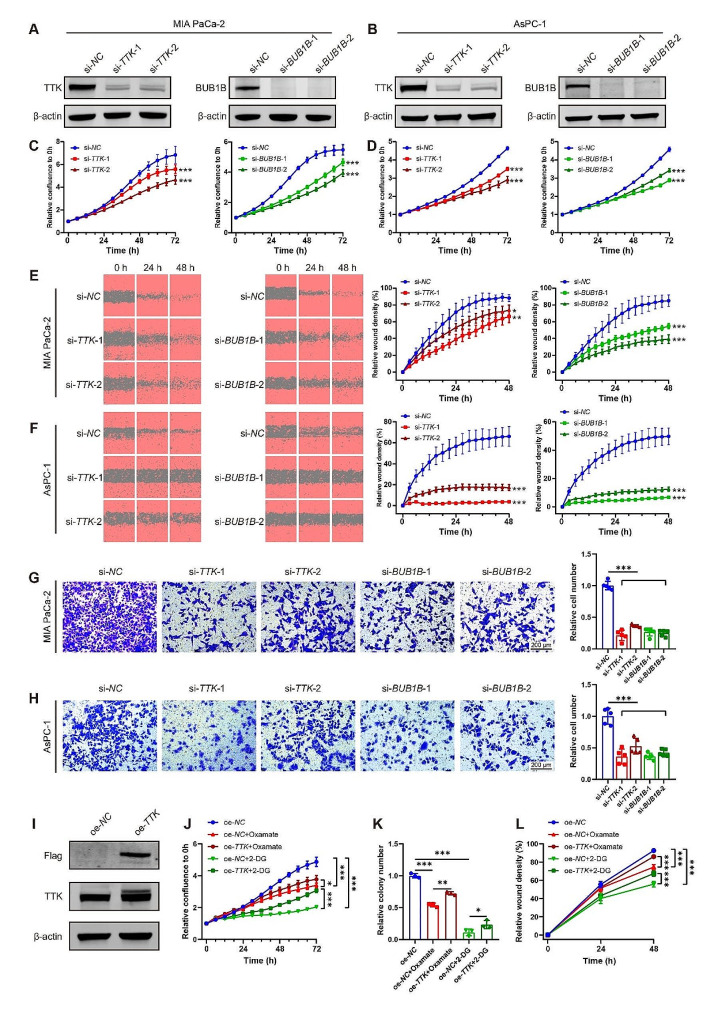
Methods: The level of histone lactylation in PDAC was identified by western blot and immunohistochemistry, and its relationship with the overall survival was evaluated using a Kaplan-Meier survival plot. The participation of histone lactylation in the growth and progression of PDAC was confirmed through inhibition of histone lactylation by glycolysis inhibitors or lactate dehydrogenase A (LDHA) knockdown both in vitro and in vivo. The potential writers and erasers of histone lactylation in PDAC were identified by western blot and functional experiments. The potential target genes of H3K18 lactylation (H3K18la) were screened by CUT&Tag and RNA-seq analyses. The candidate target genes TTK protein kinase (TTK) and BUB1 mitotic checkpoint serine/threonine kinase B (BUB1B) were validated through ChIP-qPCR, RT-qPCR and western blot analyses. Next, the effects of these two genes in PDAC were confirmed by knockdown or overexpression. The interaction between TTK and LDHA was identified by Co-IP assay.

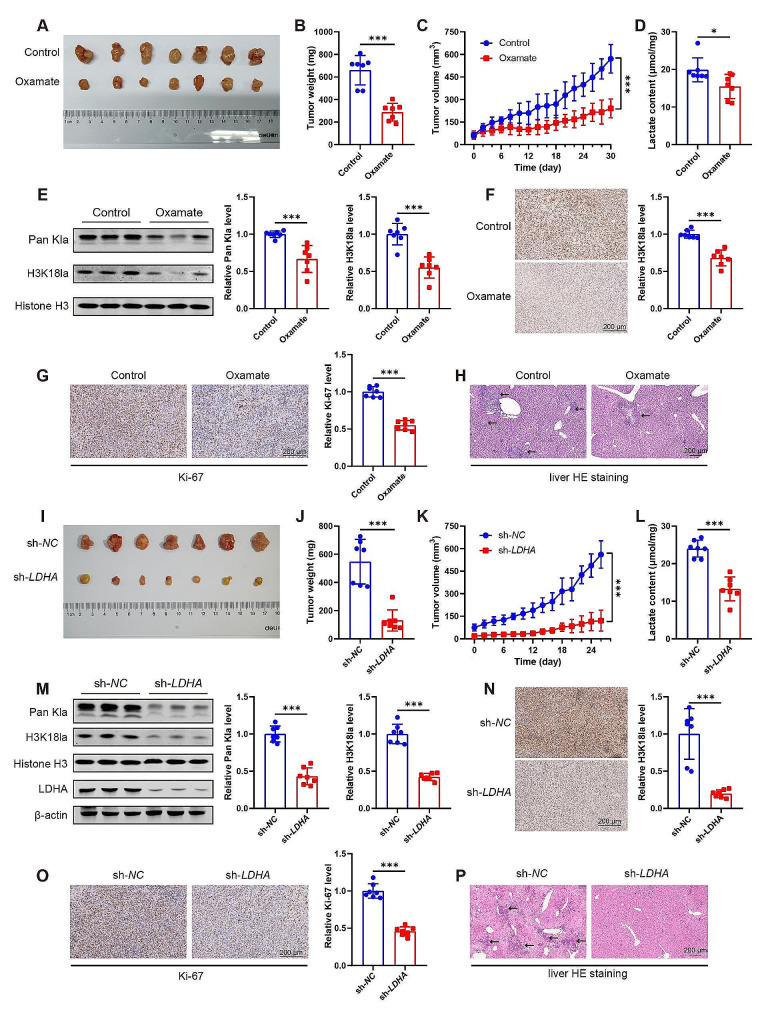
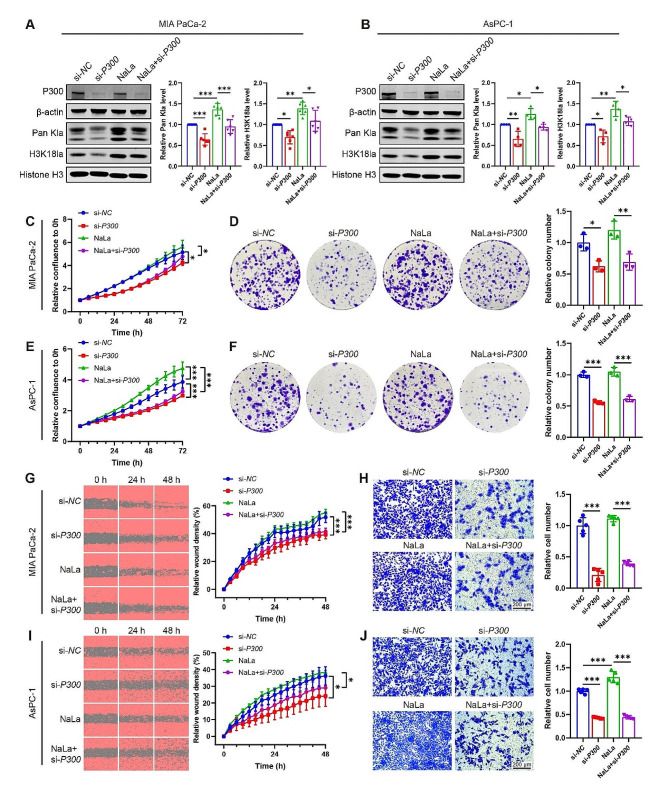
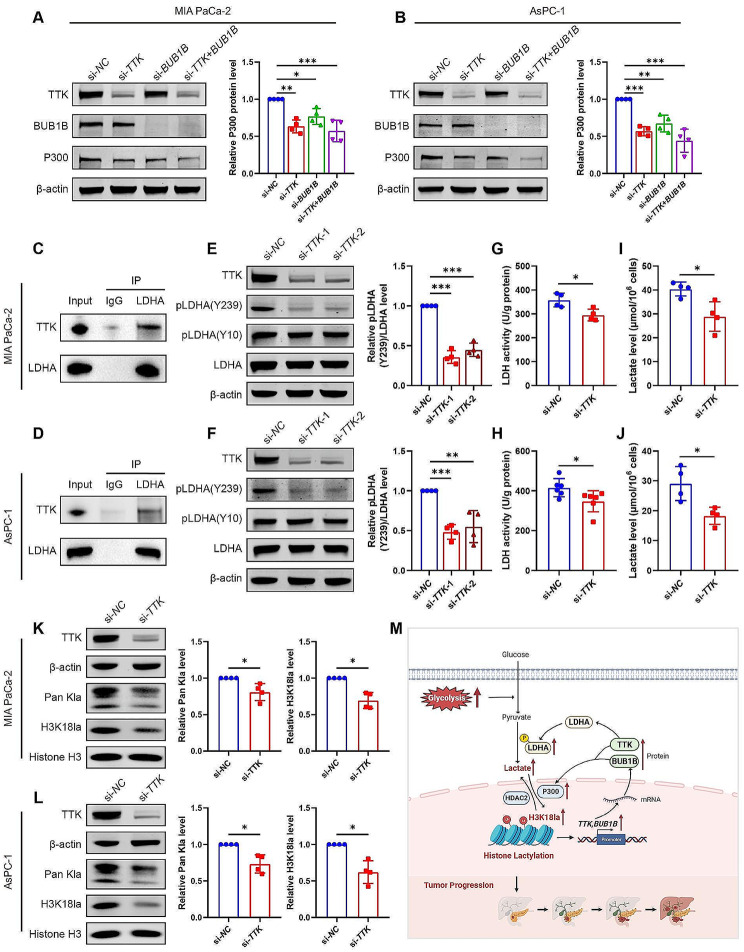
Results: Histone lactylation, especially H3K18la level was elevated in PDAC, and the high level of H3K18la was associated with poor prognosis. The suppression of glycolytic activity by different kinds of inhibitors or LDHA knockdown contributed to the anti-tumor effects of PDAC in vitro and in vivo. E1A binding protein p300 (P300) and histone deacetylase 2 were the potential writer and eraser of histone lactylation in PDAC cells, respectively. H3K18la was enriched at the promoters and activated the transcription of mitotic checkpoint regulators TTK and BUB1B. Interestingly, TTK and BUB1B could elevate the expression of P300 which in turn increased glycolysis. Moreover, TTK phosphorylated LDHA at tyrosine 239 (Y239) and activated LDHA, and subsequently upregulated lactate and H3K18la levels.

Conclusions: The glycolysis-H3K18la-TTK/BUB1B positive feedback loop exacerbates dysfunction in PDAC. These findings delivered a new exploration and significant inter-relationship between lactate metabolic reprogramming and epigenetic regulation, which might pave the way toward novel lactylation treatment strategies in PDAC therapy.

Keywords: Glycolysis; H3K18la; Histone lactylation; Pancreatic ductal adenocarcinoma.


Conflict of interest statement

The authors declare no competing interests.

Figures

Fig. 1
Fig. 1
Elevated lactate level and histone lactylation are associated with unfavorable prognosis in patients with PDAC. (A) Lactate content in pancreatic ductal adenocarcinoma (PDAC) and paired para-carcinoma tissues. n = 38. (B) Lactate content in human pancreatic ductal epithelial cell line hTERT-HPNE and four different PDAC cell lines (MIA PaCa-2, PANC-1, AsPC-1 and PL45). n = 6. (C-D) Distinct serum metabolites in PDAC patients and healthy individuals were analyzed by using non-targeted metabolomics. n = 60. The volcano plot (C) and the KEGG analysis (D) on differential serum metabolites between PDAC patients and healthy individuals. (E) The pan-lysine lactylation (Pan Kla) and H3K18 lactylation (H3K18la) levels in paired PDAC tissue (T) and adjacent normal tissues (N) were measured by western blot. n = 5. Representative images (left panel) and the quantification (right panel). (F) The levels of Pan Kla and H3K18la in pancreatic ductal epithelial cell line and PDAC cell lines were assessed using western blot. n = 4. Representative images (left panel) and the quantification (right panel). (G-K) The H3K18la level in PDAC and para-carcinoma tissues were visualized by IHC staining in tissue microarray. (G) The representative picture of IHC staining. The visual field in the black square is enlarged below. (H-I) The quantification of IHC staining in para-carcinoma (n = 72) and PDAC (n = 74) tissues. (J) H3K18la levels of AJCC stages T1 to T4 in PDAC patients. There are 5 PDAC patients in T1 stage, 33 in T2 stage, 25 in T3 stage, and 11 in T4 stage. (K) Kaplan-Meier analysis of overall survival in PDAC patients with low (n = 36) and high H3K18la (n = 38) levels. Data in Fig. B, E, F are presented as mean ± SD; data in Fig. A, H and J are presented as median with interquartile range. Statistical analysis was performed by Student’s t-test in E, or by one-way ANOVA followed by Dunnett’s multiple comparisons test in B and F, or by Log-rank test in K, or by Mann-Whitney test in A and H, or by Kruskal-Wallis test followed by Dunn’s multiple comparisons in J. *P < 0.05, **P < 0.01, ***P < 0.001; ns, not significant
Fig. 2
Fig. 2
Glycolysis inhibition diminishes histone lactylation. Two PDAC cell lines MIA PaCa-2 and AsPC-1 cells were treated with glycolysis inhibitors DCA (0–30 mmol/L), Oxamate (0–20 mmol/L) or 2-DG (0–10 mmol/L) for 24 h, or transfection with LDHA siRNA (si-LDHA) or negative control siRNA (si-NC) for 48 h with or without sodium lactate (NaLa, 10 mmol/L) treatment. (A-D) The pan-lysine lactylation (Pan Kla) and H3K18 lactylation (H3K18la) levels were measured by western blot and quantified by using Image J software. n = 4 or 6. All data are presented as mean ± SD. Statistical analysis was performed by one-way ANOVA followed by Dunnett’s multiple comparisons test in A-B, or by Tukey’s multiple comparisons test in C-D. *P < 0.05, **P < 0.01, ***P < 0.001
Fig. 3
Fig. 3
Glycolysis inhibition diminishes histone lactylation and suppresses PDAC cell proliferation. Two PDAC cell lines MIA PaCa-2 and AsPC-1 cells were treated with glycolysis inhibitors DCA (0–30 mmol/L), Oxamate (0–20 mmol/L) or 2-DG (0–10 mmol/L), or transfection with LDHA siRNA (si-LDHA) or negative control siRNA (si-NC) with or without sodium lactate (NaLa, 10 mmol/L) treatment. (A-B, G-H) Cell viability was visualized by IncuCyte S3 in MIA PaCa-2 (A, G) and AsPC-1 (B, H) cells. n = 5, 6 or 3. (C-F, I-L) Cell proliferation ability was evaluated by colony formation assays in MIA PaCa-2 (C, E, I, K) and AsPC-1 (D, F, J, L) cells. n = 3. All data are presented as mean ± SD. Statistical analysis was performed by ANOVA followed by Dunnett’s multiple comparisons test in A, B, E, F, or by Tukey’s multiple comparisons test in G, H, K, L. *P < 0.05, **P < 0.01, ***P < 0.001
Fig. 4
Fig. 4
Glycolysis inhibition diminishes histone lactylation and suppresses PDAC cell migration. (A-H) Two PDAC cell lines MIA PaCa-2 and AsPC-1 cells were treated with glycolysis inhibitors DCA (0–30 mmol/L), Oxamate (0–20 mmol/L) or 2-DG (0–10 mmol/L) for 48 h. The migration ability was evaluated by wound healing and transwell assays. n = 4–6. Representative images (A, C, E, F) and quantification (B, D, G, H). (I-P) MIA PaCa-2 and AsPC-1 cells were transfected with LDHA siRNA (si-LDHA) or negative control siRNA (si-NC) for 48 h with or without sodium lactate (NaLa,10 mmol/L) treatment. The migration ability was evaluated by wound healing and transwell assays. n = 6 or 5. Representative images (I, K, M, N) and quantification (J, L, O, P). All data are presented as mean ± SD. Statistical analysis was performed by ANOVA followed by Dunnett’s multiple comparisons test in B, D, G, H, or by Tukey’s multiple comparisons test in J, L, O, P. *P < 0.05, **P < 0.01, ***P < 0.001
Fig. 5
Fig. 5
Glycolysis inhibition diminishes histone lactylation and suppresses cancer progression in the transplanted PDAC in nude mice. (A-H) MIA PaCa-2 cells were injected into nude mice subcutaneously and were intraperitoneally administered Oxamate (750 mg/kg, daily) or vehicle for 30 days. (I-P) Stable knockdown of LDHA (sh-LDHA) was mediated by lentivirus in MIA PaCa-2 cells. The sh-LDHA cells and the control (sh-NC) cells were injected into nude mice subcutaneously. Tumor gross image (A, I) and tumor weight (B, J) after sacrifice. Tumor volume assessment during the experiment (C, K). Lactate content in the tumor tissues (D, L). The levels of pan-lysine lactylation (Pan Kla) and H3K18 lactylation (H3K18la) were measured by western blot or IHC staining, and quantified by using Image J software (E-F, M-N). Cell proliferation was assessed by using IHC staining with Ki-67. Representative images and quantification (G, O). Tumor metastasis in the liver was evaluated by using HE staining (H, P). The arrows point to the metastatic tumor lesions. All data are presented as mean ± SD. Statistical analysis was performed by Student’s t-test. n = 7. *P < 0.05, ***P < 0.001
Fig. 6
Fig. 6
P300 is a potential writer of histone lactylation in PDAC cells. PDAC cell lines MIA PaCa-2 and AsPC-1 cells were transfected with P300 siRNA (si-P300 or negative control siRNA (si-NC) with or without sodium lactate (NaLa, 10 mmol/L) treatment. (A-B) The pan-lysine lactylation (Pan Kla) and H3K18 lactylation (H3K18la) levels were measured in MIA PaCa-2 (A) and AsPC-1 (B) cells. n = 6 or 4. Representative images (left panel), and the quantification (right panel). (C-F) The proliferation ability of MIA PaCa-2 (C, D) and AsPC-1 (E, F) cells was detected by using IncuCyte S3 (C, E) and colony formation assays (D, F). n = 3, 5 or 6. (G-J) The migration ability of MIA PaCa-2 (G, H) and AsPC-1 (I, J) cells were assessed by using wound healing (G, I) and transwell assays (H, J). n = 4 or 5. All data are presented as mean ± SD. Statistical analysis was performed by ANOVA followed by Tukey’s multiple comparisons test. *P < 0.05, **P < 0.01, ***P < 0.001
Fig. 7
Fig. 7
H3K18la activates TTK and BUB1B transcription in PDAC. (A-H) MIA PaCa-2 cells were treated with a glycolysis inhibitor Oxamate (10 mmol/L) for 24 h. Cells were collected for CUT&Tag assay to screen the binding sites of H3K18la (A-D, H) or collected for RNA-seq to screen the downstream genes of lactylation (E-F). The heatmap showed the distribution of H3K18la peaks in the vicinity of the translation start site (TSS) (A-B). The distribution of H3K18la on the genome (C). KEGG analysis of the promoter region of the H3K18la distribution (D). The volcano plot of the differently expressed genes in RNA-seq (E). KEGG analysis of the downregulated genes in Oxamate-treated group by RNA-seq (F). Combination of CUT&Tag, RNA-seq and GEPIA database to identify the potential downstream targets of H3K18la (G). Integrative Genomics Viewer tracks of CUT&Tag showing enriched H3K18la in the promotors of TTK and BUB1B (H). (I-K) MIA PaCa-2 or AsPC-1 cells were treated with glycolysis inhibitors DCA (10 mmol/L), Oxamate (10 mmol/L) or 2-DG (5 mmol/L) for 24 h. DNA fragments were immunoprecipitated with the H3K18la antibody and analyzed by qPCR (I). n = 3. Relative mRNA levels of TTK and BUB1B in MIA PaCa-2 cells (J). n = 4. Representative western blot images and quantification of TTK and BUB1B protein levels in MIA PaCa-2 cells (K). n = 4. All data are presented as mean ± SD. Statistical analysis was performed by one-way ANOVA followed by Dunnett’s multiple comparisons test in I-K. *P < 0.05, **P < 0.01, ***P < 0.001; ns, not significant
Fig. 8
Fig. 8
The high levels of TTK and BUB1B are associated with the malignancy of PDAC. (A) Relative mRNA levels of TTK and BUB1B were detected in human pancreatic ductal epithelial cell line hTERT-HPNE and four different PDAC cell lines (MIA PaCa-2, PANC-1, AsPC-1, and PL45 cells) by RT-qPCR. n = 3. (B) Representative western blot images and quantification of TTK and BUB1B protein levels in the above cell lines. n = 3. (C) TTK and BUB1B expression levels were visualized by IHC staining in PDAC and para-carcinoma tissues on the left panel. Statistical results were shown on the right panel. n = 13. (D-G) Kaplan-Meier curves of overall survival and disease-free survival in PDAC patients with low and high TTK or BUB1B expression in the GEPIA database (D, F) and Kaplan-Meier plotter database (E, G). All data are presented as mean ± SD. Statistical analysis was performed by one-way ANOVA followed by Dunnett’s multiple comparisons test in A, B, or by Student’s t-test in C, or by Log-rank test in D-G. *P < 0.05, **P < 0.01, ***P < 0.001. TPM, transcripts per million
Fig. 9
Fig. 9
TTK/BUB1B knockdown suppresses PDAC malignancy, and TTK overexpression partially attenuates the anticancer effects of lactylation inhibition. (A-H) MIA PaCa-2 and AsPC-1 cells were transfected with TTK siRNA (si-TTK), BUB1B siRNA (si-BUB1B) or negative control siRNA (si-NC). The efficiency of TTK and BUB1B silencing was detected by western blot (A-B). The proliferation was assessed using IncuCyte S3 (C-D). n = 6. The migration ability was assayed by wound healing assays and transwell assays (E-H). n = 4–6. (I-L) MIA PaCa-2 cells were transfected with TTK overexpression plasmid (oe-TTK), or negative control plasmid (oe-NC), and then treated with glycolysis inhibitors Oxamate (10 mmol/L) or 2-DG (2 mmol/L). The efficiency of TTK overexpression was determined by western blot (I). The cell proliferation was assessed using IncuCyte S3 (J) and colony formation assays (K). = 6 or 3. The migration ability was assessed by wound healing assays (L). n = 5. All data are presented as mean ± SD. Statistical analysis was performed by ANOVA followed by Dunnett’s multiple comparisons test in C-H, or by Tukey’s multiple comparisons test in J-L. *P < 0.05, **P < 0.01, ***P < 0.001
Fig. 10
Fig. 10
A positive feedback loop between H3K18la target genes (TTK and BUB1B) and glycolysis. (A-B) MIA PaCa-2 (A) and AsPC-1 (B) cells were transfected with negative control siRNA (si-NC), TTK siRNA (si-TTK) and/or BUB1B siRNA (si-BUB1B). The protein levels were detected by western blot and quantified. n = 4. (C-D) The interactions between TTK and LDHA in MIA PaCa-2 (C) and AsPC-1 (D) cells were confirmed by co-immunoprecipitation (Co-IP). (E-L) MIA PaCa-2 and AsPC-1 cells were transfected with si-TTK or si-NC. (E-F) The levels of phosphorylated LDHA at Y239 and Y10 in MIA PaCa-2 (E) and AsPC-1 (F) cells were detected by western blot and quantified. n = 4. (G-H) LDHA activity assays in MIA PaCa-2 (G) and AsPC-1 (H) cells. n = 4 or 6. (I-J) The lactate level in cell culture supernatants. n = 4. (K-L) The pan-lysine lactylation (Pan Kla) and H3K18 lactylation (H3K18la) levels were measured by western blot and quantified using Image J software. n = 4. All data are presented as mean ± SD. Statistical analysis was performed by one-way ANOVA followed by Tukey’s multiple comparisons test in A-B, or by Dunnett’s multiple comparisons test in E-F, or by Student’s t-test in G-L. *P < 0.05, **P < 0.01, ***P < 0.001. (M) The main findings of this article. The glycolysis-H3K18la-TTK/BUB1B positive feedback loop exacerbates dysfunction in PDAC. This image was created with the help of BioRender (https://www.biorender.com)

References

    1. Siegel RL, Miller KD, Wagle NS, Jemal A. Cancer statistics, 2023. CA Cancer J Clin. 2023;73:17–48. doi: 10.3322/caac.21763. - DOI - PubMed
    1. Grossberg AJ, Chu LC, Deig CR, Fishman EK, Hwang WL, et al. Multidisciplinary standards of care and recent progress in pancreatic ductal adenocarcinoma. CA Cancer J Clin. 2020;70:375–403. doi: 10.3322/caac.21626. - DOI - PMC - PubMed
    1. Halbrook CJ, Lyssiotis CA, Pasca di Magliano M, Maitra A. Pancreatic cancer: advances and challenges. Cell. 2023;186:1729–54. doi: 10.1016/j.cell.2023.02.014. - DOI - PMC - PubMed
    1. Dreyer SB, Upstill-Goddard R, Legrini A, Biankin AV, Glasgow Precision Oncology L, Jamieson NB, et al. Genomic and molecular analyses identify molecular subtypes of pancreatic cancer recurrence. Gastroenterology. 2022;162:320–e44. doi: 10.1053/j.gastro.2021.09.022. - DOI - PMC - PubMed
    1. Yang J, Ren B, Yang G, Wang H, Chen G, You L, et al. The enhancement of glycolysis regulates pancreatic cancer metastasis. Cell Mol Life Sci. 2020;77:305–21. doi: 10.1007/s00018-019-03278-z. - DOI - PMC - PubMed

Publication types

MeSH terms