. 2024 May 6;43(1):137.
doi: 10.1186/s13046-024-03044-5.

Identification and characterization of a new potent inhibitor targeting CtBP1/BARS in melanoma cells

Affiliations

Identification and characterization of a new potent inhibitor targeting CtBP1/BARS in melanoma cells

Angela Filograna et al. J Exp Clin Cancer Res. .

Abstract

Background: The C-terminal-binding protein 1/brefeldin A ADP-ribosylation substrate (CtBP1/BARS) acts both as an oncogenic transcriptional co-repressor and as a fission inducing protein required for membrane trafficking and Golgi complex partitioning during mitosis, hence for mitotic entry. CtBP1/BARS overexpression, in multiple cancers, has pro-tumorigenic functions regulating gene networks associated with "cancer hallmarks" and malignant behavior including: increased cell survival, proliferation, migration/invasion, epithelial-mesenchymal transition (EMT). Structurally, CtBP1/BARS belongs to the hydroxyacid-dehydrogenase family and possesses a NAD(H)-binding Rossmann fold, which, depending on ligands bound, controls the oligomerization of CtBP1/BARS and, in turn, its cellular functions. Here, we proposed to target the CtBP1/BARS Rossmann fold with small molecules as selective inhibitors of mitotic entry and pro-tumoral transcriptional activities.

Methods: Structured-based screening of drug databases at different development stages was applied to discover novel ligands targeting the Rossmann fold. Among these identified ligands, N-(3,4-dichlorophenyl)-4-{[(4-nitrophenyl)carbamoyl]amino}benzenesulfonamide, called Comp.11, was selected for further analysis. Fluorescence spectroscopy, isothermal calorimetry, computational modelling and site-directed mutagenesis were employed to define the binding of Comp.11 to the Rossmann fold. Effects of Comp.11 on the oligomerization state, protein partners binding and pro-tumoral activities were evaluated by size-exclusion chromatography, pull-down, membrane transport and mitotic entry assays, Flow cytometry, quantitative real-time PCR, motility/invasion, and colony assays in A375MM and B16F10 melanoma cell lines. Effects of Comp.11 on tumor growth in vivo were analyzed in mouse tumor model.

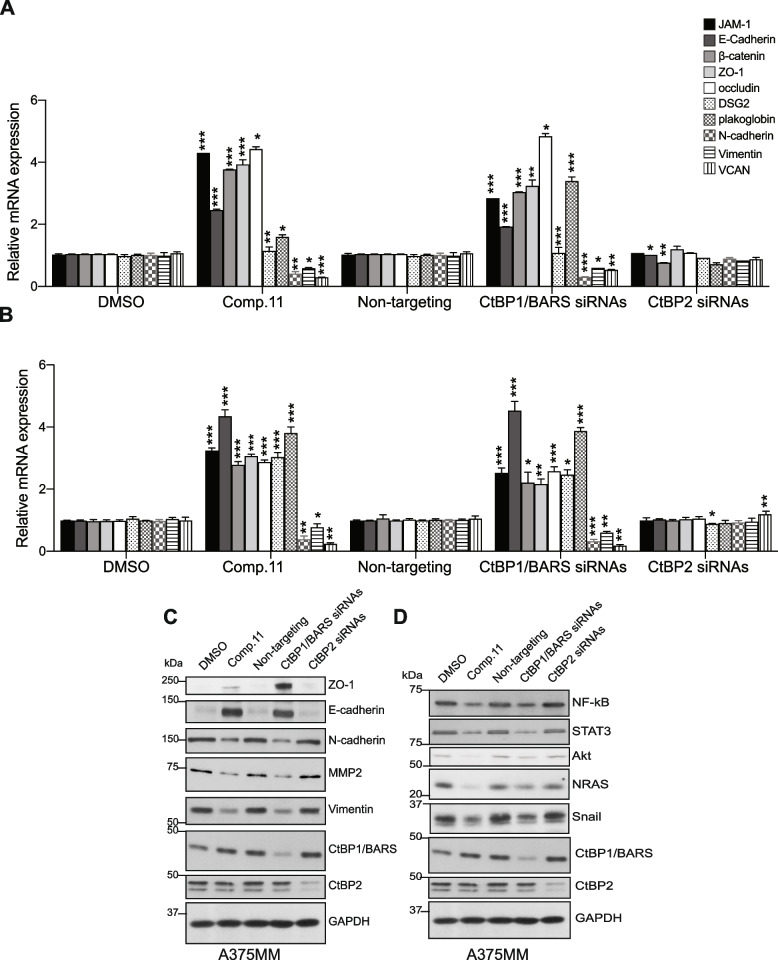
Results: We identify Comp.11 as a new, potent and selective inhibitor of CtBP1/BARS (but not CtBP2). Comp.11 directly binds to the CtBP1/BARS Rossmann fold affecting the oligomerization state of the protein (unlike other known CtBPs inhibitors), which, in turn, hinders interactions with relevant partners, resulting in the inhibition of both CtBP1/BARS cellular functions: i) membrane fission, with block of mitotic entry and cellular secretion; and ii) transcriptional pro-tumoral effects with significantly hampered proliferation, EMT, migration/invasion, and colony-forming capabilities. The combination of these effects impairs melanoma tumor growth in mouse models. CONCLUSIONS: This study identifies a potent and selective inhibitor of CtBP1/BARS active in cellular and melanoma animal models revealing new opportunities to study the role of CtBP1/BARS in tumor biology and to develop novel melanoma treatments.

Keywords: Benzenesulfonamide; C-terminal Binding Protein (CtBP); CtBP inhibitor; Melanoma; Rossmann fold.


Conflict of interest statement

The authors declare no conflict of interest.

Figures

Fig. 1
Fig. 1
Identification of small molecules targeting CtBP1/BARS and their cellular effects. A, Detail of the co-crystalized complex of NADH (yellow) and CtBP1 (residues are referred to CtBP1-L; light blue ribbon) (PDB 1MX3). Crucial residues stabilizing the complex are reported in pink; interaction and distances between the protein functional groups and NADH are annotated in Armstrongs. B Chemical structure of N-(3,4-dichlorophenyl)-4-{[(4-nitrophenyl) carbamoyl]amino}benzene-sulfonamide (referred as Comp.11 from here on). C Representative confocal microscopy images of A375MM cells treated with DMSO (vehicle control) or with Comp.11 (15 μM) or EGCG (15 μM) or EE (50 μM) for 2 h at 37 °C (as indicated). Cells were fixed and labeled with a polyclonal anti-CtBP1/BARS antibody (endogenous CtBP1/BARS; green), with an anti-TGN46 antibody (used as a TGN-Golgi marker; red) and with a monoclonal anti-GM130 antibody (used as a cis-Golgi marker; grey). Insets, right: Magnification of Golgi area. Scale bars, 10 μm. D Quantification of cells with a nuclear localization pattern of CtBP1/BARS. Data are means ± SD of three independent experiments. *P ≤ 0.05, **P ≤ 0.01 versus DMSO (vehicle control) (Student’s t-tests). E Projections of Z-stack confocal microscopy images of A375MM cell treated with Comp.11, fixed and labeled with anti-TGN46 antibody (grey). Insets, right: Magnification of the elongated TGN tubular membranes
Fig. 2
Fig. 2
Thermodynamic characterization of the Comp.11-CtBP1/BARS binding. A. Fluorescence emission spectra of 2 μM solution of purified CtBP1/BARS (black line) and the tryptophan fluorescence quenching effect (black arrow) upon addition of increasing concentration of Comp.11 (C11, colored lines) on its fluorescence intensity. B Detail of the Comp.11 predicted binding mode in CtBP1/BARS, as computed in silico; Comp.11 (C11, yellow) and NADH (orange) coexist within the Rossmann Fold. Crucial residues for the interactions are highlighted (in sticks); in green, those residues selected for experimental validation via mutagenesis. The interactions between Comp.11 and CtBP1/BARS functional groups are schematized: blue dotted lines represent π- π interactions; green dotted lines stay for cation-aromatic interactions; pink dotted lines for salt bridge and orange dotted lines represent H-bonds. C Binding curve of CtBP1-S/BARS titration versus Comp.11 concentration (F/F0; see Methods). The red line represents the model fit to a binding equilibrium (Ka = 2,1 ± 0,6 × 105 M−1) obtained by static quenching model [90] and OriginPro 9 software from the experimental points (black squares). D Top: ITC trace for the titration of the protein CtBP1/BARS with the Comp.11 as ligand. Bottom: Integrated ITC data (black squares) as a function ligand/protein concentration ratio. The solid red line is the best fit of experimental data using the independent site binding model. E Far UV-CD spectra of CtBP1/BARS in the absence (black line) and in presence of Comp.11 at protein ratio 1/1 (red line). The CD spectra were normalized and reported in mean residue ellipticity (MRE), represented by the symbol [θ]mrw (deg cm2 dmol.−1) and plotted as a function of the wavelength (see Methods). F Thermodynamic parameters obtained by ITC measurements for binding of Comp.11 to wild-type or point mutants of CtBP1/BARS (as indicated)
Fig. 3
Fig. 3
Comp.11 affects the oligomerization state of CtBP1/BARS and the interaction of CtBP1/BARS with transcription and membrane fission partners. A Top: Size-exclusion chromatography profiles of wild-type CtBP1/BARS incubated with DMSO (vehicle control, 2 h, 4 °C; purple line) or with NAD+ (100 μM, 2 h, 4 °C; blue line) or with Comp.11 (25 μM, 2 h, 4 °C; green line) or pre-incubated with NAD+ (1 h, 100 μM) and then for a further 2 h with Comp.11 (25 μM, 4 °C; orange line) (see Methods). One mg of purified CtBP1/BARS protein was applied to the Sephacryl S-200 column, with Gel filtration elution buffer at 0.3 ml/min. The elution patterns were detected by monitoring the absorbance at 280 nm. The elution positions of the molecular weight markers used are indicated by arrows: Amylase (200 kDa), alcohol Dehydrogenase (158 kDa). Bottom: Western blotting with anti-CtBP1/BARS antibody of aliquots of each eluted fraction (see Methods). B Representative histidine pull-down of equimolar amounts of His-CtBP1/BARS recombinant protein for GST-CtBP1/BARS. His-CtBP1/BARS was first incubated with DMSO (vehicle control), or 100 µ M NAD+ or 100 µ M acyl-CoA or increasing concentration of Comp.11 (5, 15 and 25 µ M) (1 h, 4 °C in a wheel), and then incubated with purified GST-CtBP1/BARS protein (2 h, 4 °C in a wheel; see Methods). The eluted proteins were analyzed by Western blotting using anti-GST monoclonal antibody (Top), with the pulled down His-CtBP1/BARS revealed with anti-His monoclonal antibody (Bottom). C Representative GST pull-down of GST-E1A recombinant protein for His-CtBP1/BARS. His-CtBP1/BARS protein was first incubated with DMSO (vehicle control) or with 100 μM NAD+ or 100 μM acyl-CoA or 15 μM Comp.11 (1 h, 4 C in a wheel), and then incubated with GST-E1A (2 h, 4 C in a wheel; see Methods). The bound proteins to the glutathione Sepharose beads were eluted and analyzed by Western blotting (top, anti-His monoclonal antibody; bottom, anti-GST monoclonal antibody). D Representative GST pull-down of GST-14–3-3γ recombinant protein for His-CtBP1/BARS. His-CtBP1/BARS protein was pre-incubated with DMSO (vehicle control) or with 100 μM NAD+ or 100 μM acyl-CoA or 15 μM Comp.11 (1 h, 4 °C in a wheel), and then incubated with GST-14–3-3γ (2 h, 4 °C in a wheel; see Methods). The bound proteins to the glutathione Sepharose beads were eluted and analyzed by Western blotting (top, anti-His monoclonal antibody; bottom, anti-GST monoclonal antibody). E. Representative His pull-down of His-CtBP1/BARS beads for LPAATδ-Flag immunopurified from lysates of A375MM cells overexpressing LPAATδ. His-CtBP1/BARS beads were treated with DMSO (vehicle control) or with 100 µ M NAD.+ or 100 µ M acyl-CoA or 15 µ M Comp.11 (1 h, 4 °C in a wheel), and then incubated with the immunopurified LPAATδ-Flag (2 h, 4 °C in a wheel; see Methods). The eluted proteins were analyzed by Western blotting (top, anti-Flag monoclonal antibody; bottom, anti-His monoclonal antibody). Molecular weight standards (kDa) are indicated on the left of each panel. Data are representative of three independent experiments. F. Quantification of phosphatidic acid (PA) production in the LPAAT assay for post-nuclear supernatants from A375MM cells transfected for 48 h with an empty Flag-vector or with LPAATδ-Flag and incubated with 15 μM Comp.11 or with DMSO (vehicle control) for 30 min at 25 °C before LPAAT assay, or alternatively transfected for 72 h with non-targeting or LPAATδ or CtBP1/BARS siRNAs. Data are means ± SD of three independent experiments. ***P ≤ 0.001 versus DMSO, **P ≤ 0.01 versus non-targeting (Student’s t-tests)
Fig. 4
Fig. 4
Comp.11 impairs the CtBP1/BARS-controlled protein transport and cell entry into mitosis. A Representative confocal microscopy images of A375MM cells infected with VSV and subjected to TGN-exit assay with 0.5% tannic acid. The cells were transfected with non-targeting or CtBP1/BARS siRNAs or CtBP2 siRNAs for 48 h, and subjected to VSV infection or treated with DMSO (vehicle control) or with Comp.11 (15 μM) 2 h at the 20 °C block during the TGN-exit assay (see Methods). The cells were fixed following the 20 °C (0 min) or 30 min after the shift to 32 °C, and processed for immunofluorescence with anti-VSVG (p5D4) antibody, to monitor formation of VSVG-containing carriers. Dotted lines show cell borders. Inserts, right: magnification of the tubular carrier precursors in the Golgi area. B Representative images of HeLa cells stably expressing hGH-FM–GFP and transfected with non-targeting or CtBP1/BARS siRNAs or CtBP2 siRNAs for 48 h or treated with DMSO (vehicle control) or Comp.11 (15 μM) for 2 h before subjection to a secretion assay (see Methods). Release of hGH-FM–GFP from ER was performed by the addition of DD-solubilizer at 37 °C for the indicated times. Insets, right: magnification of the tubular carrier precursors in the Golgi area. Scale bars, 10 μm. C Quantification of VSVG-positive carriers in A. D Quantification of hGH-FM–GFP in the Golgi area in B (see Methods). Data are means ± SD of three independent experiments. *P ≤ 0.05, **P ≤ 0.01 versus DMSO (vehicle control) or non-targeting (Student’s t-tests). E HeLa and NRK cells (as indicated) were arrested in S phase by using the double-thymidine block. Four hours after the S-phase block release, the cells were either treated with 15 μM Comp.11 or with DMSO (vehicle control) and fixed and processed for immunofluorescence at the indicated times after thymidine removal. Cells were labeled with Hoechst 33,342 to determine the mitotic indices up to 14 h after S phase release (see Methods)
Fig. 5
Fig. 5
Comp.11 inhibits cell proliferation in melanoma cells. A, A375MM cells and E, B16F10 cells were treated with increasing concentrations of Comp.11 (from 0 to 150 μM) for 24 h, 48 h and 72 h and their viability was evaluated according to MTT assay. The graphs represent the dose–response of log10 concentrations of Comp.11 versus normalized optical intensity at 570 nm. EC50 values of Comp.11 were calculated and reported as indicated. B A375MM cells and F B16F10 cells treated for 24 h with DMSO (vehicle control) or Comp.11 (15 µM) or transfected for 48 h with non-targeting or CtBP1/BARS siRNAs or CtBP2 siRNAs (as indicated) were subjected to cell cycle analysis by flow cytometry using propidium iodide (PI) staining. C and G, Quantification of the FACS analysis reported in B and in F, respectively. Relative mRNA levels of p16INK4a, p14.ARF, p21, and CCND1 in A375MM cells D, and of murine p21 and CCND1 (mp21 and mCCND1, as indicated) in B16F10 cells H, measured by real time PCR after 24 h of treatment with DMSO (vehicle control) or Comp.11 (15 μM) or after 48 h of transfection with non-targeting or CtBP1/BARS siRNAs or CtBP2 siRNAs (as indicated). GAPDH is used as housekeeping gene. Data are means ± SD of three independent experiments. *P ≤ 0.05, **P ≤ 0.01, ***P ≤ 0.001 versus DMSO (vehicle control) or non-targeting (Student’s t-tests)
Fig. 6
Fig. 6
Comp.11 induces apoptosis in melanoma cells. A, A375MM cells and E, B16F10 cells were stained with Annexin V/PI, and analyzed by FACS after 24 h of treatment with DMSO (vehicle control) or Comp.11 (15 μM) or after 48 h of transfection with non-targeting or CtBP1/BARS siRNAs or CtBP2 siRNAs (as indicated). B and F Quantification for Annexin V-positive apoptotic cells in A and E, respectively (see Methods). Relative mRNA levels of the reported genes measured by real time PCR in A375MM cells C-D, and in B16F10 cells G-H, after 24 h of treatment with DMSO (vehicle control) or Comp.11 (15 μM) or after 48 h of transfection with non-targeting or CtBP1/BARS siRNAs or CtBP2 siRNAs (as indicated). GAPDH is used as housekeeping gene. Data are means ± SD of three independent experiments. *P ≤ 0.05, **P ≤ 0.01, ***P ≤ 0.001 versus DMSO (vehicle control) or non-targeting (Student’s t-tests)
Fig. 7
Fig. 7
Comp.11 affects the CtBP1/BARS-mediated transcription of EMT-related genes. Relative mRNA levels of epithelial markers (E-cadherin, plakoglobin, β-cathenin, Desmoglein 2, Occludin, JAM-1, ZO1) and mesenchymal markers (N-cadherin, Vimentin and Versican) in A375MM cells A, and in B16F10 cells B, measured by real time PCR after 24 h of treatment with DMSO (vehicle control) or Comp.11 (15 μM) or after 48 h of transfection with non-targeting or CtBP1/BARS siRNAs or CtBP2 siRNAs (as indicated). GAPDH is used as housekeeping gene. Data are means ± SD of three independent experiments performed in triplicate. *P ≤ 0.05, **P ≤ 0.01, ***P ≤ 0.001 versus Ctr or non-targeting (Student’s t-tests). C and D Representative Western blotting of the indicated proteins in A375MM cells treated as in A. GAPDH is shown for the internal protein levels and molecular weight standards (kDa) are indicated on the left of each panel. Data are representative of three independent experiments
Fig. 8
Fig. 8
Comp.11 impairs melanoma cell migration and invasion. Representative images of wound closure assays (at the indicated times; see Methods) in A375MM cells A, and in B16F10 cells D, after 24 h of treatment with DMSO (vehicle control) or Comp.11 (15 μM) or after 48 h of transfection with non-targeting or CtBP1/BARS siRNAs or CtBP2 siRNAs (as indicated). B and E. Quantification of the extent of wound closure calculated by analyzing the scratched area covered by the A375MM cells (B) or B16F10 cells (E) after 16 h using ImageJ software. C and F. Quantification of Matrigel invasion assays of A375MM and B16F10 cell lines, respectively, treated as in A and B. Invasion was quantified by counting cells in ten random fields and data are presented as mean number of cells/field. Data are mean ± SD of three independent experiments. *P ≤ 0.05, **P ≤ 0.01 versus DMSO (vehicle control) or non-targeting (Student’s t-tests)
Fig. 9
Fig. 9
Comp.11 exhibited antitumor activity in colony formation and in vivo tumor growth. A Top: Representative images of crystal violet staining of A375MM cells in the colony formation assays after 7 days of treatment with DMSO (vehicle control) or with Comp.11 (5 or 15 μM) (see Methods). Bottom: Quantification of the Stained colonies dissolved in 33% acetic acid by measuring the absorbance at 590 nm and normalized versus DMSO (vehicle control). B. Top: Representative images of soft agar colony formation assay. A375MM cells were grown in agar-media suspension for 21 days in presence of DMSO (vehicle control) or of Comp.11 (5 or 15 μM). Plates were incubated overnight with Nitroblue Tetrazolium Chloride dye to visualize colonies on a gel imager. Bottom: Quantification of clone number/ well of A375MM cells after 21 days of treatments. Data are mean ± SD of two independent experiments performed in triplicate ***P ≤ 0.001 versus DMSO (control vehicle) (Student’s t-tests). C Schematic diagram of the experimental design and steps for the in vivo studies. A375MM cells (2.5 × 10⁶ cells) were s.c. injected into the flank of female CD1 nude mice as described in Methods. When tumors were established mice (n = 5, each) were randomly divided into three experimental groups (n = 3) to receive Comp.11 at the dosages of 10 mg/kg (daily, for 2 weeks), 20 mg/kg (three times/week for 2 weeks) or its vehicle intraperitoneally administrated for 14 days. D Fold change in tumor volume (% of means ± SEM) compared with the baseline [determined by caliper and calculated as (length × width2)/2] of A375MM tumors after two weeks of Comp.11 treatments. Statistically significant results are reported (P < 0.02) for Comp.11 20 mg/kg treatment. E At the end of the experiment (day 14), the tumors were dissected and tumor weight were determined. Statistically significant results are reported (P < 0.03) for Comp.11 20 mg/kg treatment. F Percent change in tumor volume average from each group of A375MM model at day 7 and day 14 were compared and presented as percentages of vehicle. G, Mice body weight as surrogate indicator of toxicity for in vivo experiment reported in D. Body weight was measured three times/week. P values in D and E were calculated using one way ANOVA correct by original FDR method of Benjamini and Hochberg

References

    1. Jitian Mihulecea C-R, Rotaru M. Review: The Key Factors to Melanomagenesis. Life (Basel) 2023;13:181. - PMC - PubMed
    1. Davey MG, Miller N, McInerney NM. A Review of Epidemiology and Cancer Biology of Malignant Melanoma. Cureus. 2021;13:e15087. - PMC - PubMed
    1. McCourt C, Dolan O, Gormley G. Malignant melanoma: a pictorial review. Ulster Med J. 2014;83:103–110. - PMC - PubMed
    1. Rashid S, Shaughnessy M, Tsao H. Melanoma classification and management in the era of molecular medicine. Dermatol Clin. 2023;41:49–63. doi: 10.1016/j.det.2022.07.017. - DOI - PubMed
    1. Linos E, Swetter SM, Cockburn MG, Colditz GA, Clarke CA. Increasing burden of melanoma in the United States. J Invest Dermatol. 2009;129:1666–1674. doi: 10.1038/jid.2008.423. - DOI - PMC - PubMed

MeSH terms