. 2024 May;14(5):e1655.
doi: 10.1002/ctm2.1655.

PI3K/mTOR inhibition induces tumour microenvironment remodelling and sensitises pS6high uterine leiomyosarcoma to PD-1 blockade

Affiliations

PI3K/mTOR inhibition induces tumour microenvironment remodelling and sensitises pS6high uterine leiomyosarcoma to PD-1 blockade

Wout De Wispelaere et al. Clin Transl Med. 2024 May.

Abstract

Background: Uterine leiomyosarcomas (uLMS) are aggressive tumours with poor prognosis and limited treatment options. Although immune checkpoint blockade (ICB) has proven effective in some 'challenging-to-treat' cancers, clinical trials showed that uLMS do not respond to ICB. Emerging evidence suggests that aberrant PI3K/mTOR signalling can drive resistance to ICB. We therefore explored the relevance of the PI3K/mTOR pathway for ICB treatment in uLMS and explored pharmacological inhibition of this pathway to sensitise these tumours to ICB.

Methods: We performed an integrated multiomics analysis based on TCGA data to explore the correlation between PI3K/mTOR dysregulation and immune infiltration in 101 LMS. We assessed response to PI3K/mTOR inhibitors in immunodeficient and humanized uLMS patient-derived xenografts (PDXs) by evaluating tumour microenvironment modulation using multiplex immunofluorescence. We explored response to single-agent and a combination of PI3K/mTOR inhibitors with PD-1 blockade in humanized uLMS PDXs. We mapped intratumoural dynamics using single-cell RNA/TCR sequencing of serially collected biopsies.

Results: PI3K/mTOR over-activation (pS6high) associated with lymphocyte depletion and wound healing immune landscapes in (u)LMS, suggesting it contributes to immune evasion. In contrast, PI3K/mTOR inhibition induced profound tumour microenvironment remodelling in an ICB-resistant humanized uLMS PDX model, fostering adaptive anti-tumour immune responses. Indeed, PI3K/mTOR inhibition induced macrophage repolarisation towards an anti-tumourigenic phenotype and increased antigen presentation on dendritic and tumour cells, but also promoted infiltration of PD-1+ T cells displaying an exhausted phenotype. When combined with anti-PD-1, PI3K/mTOR inhibition led to partial or complete tumour responses, whereas no response to single-agent anti-PD-1 was observed. Combination therapy reinvigorated exhausted T cells and induced clonal hyper-expansion of a cytotoxic CD8+ T-cell population supported by a CD4+ Th1 niche.

Conclusions: Our findings indicate that aberrant PI3K/mTOR pathway activation contributes to immune escape in uLMS and provides a rationale for combining PI3K/mTOR inhibition with ICB for the treatment of this patient population.

Keywords: PI3K/mTOR inhibitors; anti‐PD‐1 therapy; humanized patient‐derived xenograft models; immune‐modulation; resistance; uterine leiomyosarcoma.


Conflict of interest statement

All authors declare that they have no competing interests.

Figures

FIGURE 1
FIGURE 1
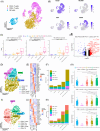
PI3K/mTOR pathway over‐activation is associated with an immune suppressive phenotype in leiomyosarcoma patients. (A) Heatmap showing relative abundance of tumour‐infiltrating immune cell populations in 101 LMS patient samples as determined by deconvolution of bulk RNA expression data from TCGA (TCGA‐SARC, firehose) with CIBERSORTx. Samples have been clustered in three distinct immune phenotypes with k‐means clustering. (B) Proportion of samples derived from FNCLCC‐grade 1, 2 or 3 tumours across immune phenotypes. (C) Recurrent mutations, homologous deletions, amplifications and up‐ or downregulation (> 2SD above mean and < 2SD below mean, respectively) of PI3K/mTOR‐driver genes in the three identified immune phenotypes. (D) Levels of phosphorylated (S240/244) S6 protein for all samples stratifying for immune phenotype. p Values were calculated using Kruskall–Wallis with Dunn's correction, followed by Wilcoxon rank‐sum test and corrected using Bonferroni for pairwise comparisons. Significant differences are reported as * < .05, ** < .01, *** < .001, **** < .0001. (E) Immune landscaping analysis of the samples performed using the R package R∖ImmuneSubtypeClassifier. (F) Violin plots showing expression of pan‐tumour T‐cell inflamed geneset across samples, stratifying for immune phenotype. p Values were calculated using Kruskall–Wallis with Dunn's correction, followed by Wilcoxon rank‐sum test and corrected using Bonferroni for pairwise comparisons. Significant differences are reported as * < .05, ** < .01, *** < .001, **** < .0001.
FIGURE 2
FIGURE 2
PI3K/mTOR inhibitors promote tumour T‐cell infiltration and sensitise pS6high uLMS CD34+ humanized PDX model to anti‐PD‐1 therapy. (A) Immunocompromised mice (NMRI nude) were engrafted with a patient‐derived uLMS lung metastasis (EMC041) and treated with (i) sapanisertib (.3 mg/kg/day) + alpelisib (25 mg/kg/day) or (ii) vehicle. Tumour volume was measured three times per week with a calipre. (B) CD34+ humanized mice were engrafted with EMC041 and treated with (i) sapanisertib (.3 mg/kg/day) + alpelisib (25 mg/kg/day) or (ii) vehicle. Tumour volume was measured three times per week with a calipre. (C) Multiplex immunofluorescence (mIF) analysis of representative sections of C34+ humanized EMC041 PDX tumours after treatment. (D) Quantification of CD4+ and CD8+ T‐cell infiltration in sections of vehicle‐ and PI3K/mTORi‐treated CD34+ humanized EMC041 PDX tumours (n = 3 tumours per condition) (expressed as % of total cellularity). (E) Quantification of PD‐1 expression on CD4+ and CD8+ T cells in sections of vehicle‐ and PI3K/mTORi‐treated CD34+ humanized EMC041 PDX tumours (n = 3 tumours per condition) (expressed as % of total CD8+ or CD4+ T cells). (F) CD34+ HSC humanized mice engrafted with EMC041 were treated with (i) sapanisertib (.3 mg/kg/day) + alpelisib (25 mg/kg/day), (ii) nivolumab (10 mg/kg, 2/wk), (iii) sapanisertib (.3 mg/kg/day) + alpelisib (25 mg/kg/day) + nivolumab (10 mg/kg, 2/wk) or (iv) placebo. Tumour volume was measured three times per week with a calipre. (G) Summary of responses according to RECIST per treatment arm. (H) Tumour punch biopsies were collected from the humanized EMC041 PDXs (pre‐ and posttreatment in all treatment arms) and subjected to single‐cell RNA/TCR sequencing. UMAP of cells colour coded for indicated cell types. (I) Heatmap showing the expression of conserved marker genes used to identify cell populations. For all experiments data points and error bars represent mean values and SEM. p Values were calculated using ANOVA and two‐sample t‐tests and are reported as ns > .05, * < .05, ** < .01, *** < .001, **** < .0001. The number of mice per treatment arm and number of tumours analysed by mIF are indicated in the figures for each experiment.
FIGURE 3
FIGURE 3
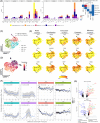
Combination therapy of PI3K/mTOR inhibitors and PD‐1 blockade increases T‐cell infiltration and ratio of effector vs exhausted CD8+ T cells. (A) Lymphoid cells were sub clustered into T/NK cells based on expression of marker genes (CD3E, CD4, IL7R, CD8, NCAM1). (B) UMAP showing the scaled expression of marker genes used to identify T/NK cells. (C) Ratio of CD4+ and CD8+ T cells and NK cells to tumour cells in each treatment condition. p Values were calculated using Kruskal–Wallis with Dunn's correction, followed by Wilcoxon rank‐sum test and corrected using Bonferroni for pairwise comparisons. Significant differences are reported as * < .05, ** < .01, *** < .001, **** < .0001. (D) CD4+ T cells were sub clustered into 5 phenotypes. Based on the expression of marker genes, we identified naïve (CD4+ Tn), memory (CD4+ Tmem), Th1 (CD4+ Th1), regulatory (CD4+ Tregs) and proliferating (CD4+ Tprolif) T cells. UMAP is colour coded for the indicated cell phenotypes. (E) Heatmap showing the scaled expression of marker genes used to identify CD4+ T‐cell phenotypes. (F) Relative contribution of each CD4+ T‐cell phenotype in the different treatment arms. (G) Volcano plot showing differential gene expression in CD4+ Th1 cells in PI3K/mTORi + PD‐1i versus other treatment conditions. Significantly up‐ and downregulated genes (q‐value < .05, |Log2FC| > .25) are shown in red and blue, respectively. (H) Violin plots showing gene set enrichment scores for the indicated pathways in the CD4+ T‐cell population. p Values were calculated using Kruskal–Wallis with Dunn's correction, followed by Wilcoxon rank‐sum test and corrected using Bonferroni for pairwise comparisons. Significant differences are reported as * < .05, ** < .01, *** < .001, **** < .0001. (I) CD8+ T cells were sub clustered into 5 phenotypes. Based on expression of marker genes, we identified naïve (CD8+ Tn), memory (CD8+ Tmem), effector (CD8+ Teff), exhausted (CD8+ Tex) and proliferating (CD8+ Tprolif) T cells. UMAP is colour coded for the indicated cell phenotypes. (J) Heatmap showing the scaled expression of marker genes used to identify CD8+ T‐cell phenotypes. (K) Relative contribution of each CD8+ T‐cell phenotype in the different treatment arms.
FIGURE 4
FIGURE 4
Combination therapy of PI3K/mTOR inhibitors and PD‐1 blockade induces clonal hyper‐expansion of the effector CD8+ T‐cell population and counteracts T‐cell exhaustion. (A) CD8+ and CD4+ T cells were assigned to ‘clonotype bins’ based on their clonotype frequency (hyperexpanded: TCR was found in > 100 T cells, large: > 20 and < 100 T cells, medium: > 5 and < 20, small: > 1 and < 5 or single: > 0 and < 1). Stacked columns show clonotype distribution of CD8+ T‐cell clonotypes per subtype stratifying for treatment condition. (B) Pairwise transition index (measure for clonotype sharing between specific CD8+ T‐cell subtypes) was calculated using the R package STARTRAC between all CD8+ T‐cell subtypes. (C) UMAP colour coded for CD8+ T‐cell phenotypes with pseudotime trajectories for CD8+ T cells based on R∖Slingshot. (D) UMAP of CD8+ T cells colour coded for pseudotime. (E) UMAPs of CD8+ T cells showing expression of marker and functional genes along Tmem and Tex trajectories. (F) Average expression of cytotoxicity markers on CD8+ T cells plotted against the distance to the closest CD4+ T cell in micrometers. (G) Volcano plot showing differential gene expression in expanded (E) versus nonexpanded (NE) CD8+ and CD4+ T cells. Significantly up‐ and downregulated genes (q‐value < .05, |Log2FC| > .25) are shown in red and blue, respectively and selected genes are colour coded according to functionality.
FIGURE 5
FIGURE 5
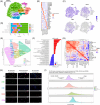
Repolarisation of tumour‐infiltrated macrophages towards an anti‐tumourigenic M1‐like phenotype and enhanced dendritic cell antigen presentation in PI3K/mTOR + PD‐1 inhibitor‐treated tumours. (A) UMAP of myeloid cells sub clustered into 1 monocyte, 5 macrophage and 1 dendritic cell cluster. (B) Heatmap showing scaled expression of marker genes used to identify myeloid subtypes. (C) UMAP of myeloid fraction showing expression of marker genes used to identify monocyte, macrophage and dendritic cell subclusters. (D) Relative contribution of each myeloid subtype (in %) in the different treatment arms. (E) Scatterplot of the mean M2 versus mean M1 score for all the macrophage cell clusters, stratifying for treatment condition. (F) Barplot representing pathways upregulated in the PI3K/mTORi + PD‐1i, shown in red and downregulated (upregulated in PD‐1i) indicated in blue. Only significantly up‐ and downregulated genes (q‐value < .05, |Log2FC| > .25) were used to perform gene set enrichment analysis. (G) Spearman correlation analysis with the number of expanded T‐cell clonotypes, relative abundance of cellular phenotypes, average expression of cytotoxicity and proliferation markers in CD8+ T cells, average IFNɣ expression in CD4+ T cells and mean M1 and M2 gene signature scores in the macrophage populations. (H) Representative images of CD68, CD86, CD163 and CD206 staining (MILAN‐method) of TMA constructed from tumour cores of C34+ humanized EMC041 PDX tumours. Macrophages showed M1‐like, M2‐like and mixed expression phenotypes. (I) Assignment of polarisation state for each macrophage across the M1:M2 spectrum using scaled, three marker index. Plot shows the distribution of M1:M2 index values for all macrophages in tumours stratifying for treatment groups.
FIGURE 6
FIGURE 6
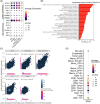
Combination therapy of PI3K/mTOR inhibitors and PD‐1 blockade induces IFNɣ‐mediated upregulation of antigen presentation machinery in tumour cells. (A) Violin plots showing gene expression of IFNγ response genes and antigen processing and presentation genes in the tumour cell population, stratifying for treatment conditon. (B) DGE was performed in the tumour cell population PI3K/mTORi+PD‐1i versus other treatment conditions. Significantly up‐ and downregulated genes were used to perform gene set enrichment analysis. Pathways upregulated in the PI3K/mTORi + PD‐1i‐treated tumours. (D) Scatterplot of gene set enrichment scores in the tumour cells, stratifying for treatment condition (GO:BP RESPONSE TO INTERFERRON GAMMA versus GO:BP ANTIGEN PROCESSING AND PRESENTATION OF PEPTIDE ANTIGEN). For each tumour cell, gene set enrichment score for GO:BP LEUKOCYTE MEDIATED CYTOTOXICITY is indicated at the side of the plot. (E) Dotplot showing expression of IFNɣ in all different cell populations identified from scRNA‐seq of tumour biopsies. The colour of the dots indicates scaled expression and the size of the dots the percentage of IFNɣ expressing cells.

References

    1. Ben‐Ami E, Barysauskas CM, Solomon S, et al. Immunotherapy with single agent nivolumab for advanced leiomyosarcoma of the uterus: results of a phase 2 study. Cancer. 2017;123:3285‐3290. - PMC - PubMed
    1. Momtahen S, Curtin J, Mittal K. Current chemotherapy and potential new targets in uterine leiomyosarcoma. J Clin Med Res. 2016;8:181‐189. - PMC - PubMed
    1. Amant F, Coosemans An, Debiec‐Rychter M, Timmerman D, Vergote I. Clinical management of uterine sarcomas. Lancet Oncol. 2009;10:1188‐1198. - PubMed
    1. Fares CM, Van Allen EM, Drake CG, Allison JP, Hu‐Lieskovan S. Mechanisms of resistance to immune checkpoint blockade: why does checkpoint inhibitor immunotherapy not work for all patients? Am Soc Clin Oncol Educ Book. 2019;39:147‐164. - PubMed
    1. Tawbi HA, Burgess M, Bolejack V, et al. Pembrolizumab in advanced soft‐tissue sarcoma and bone sarcoma (SARC028): a multicentre, two‐cohort, single‐arm, open‐label, phase 2 trial. Lancet Oncol. 2017;18:1493‐1501. - PMC - PubMed

Publication types

MeSH terms

Substances