. 2024 Jul;11(26):e2306770.
doi: 10.1002/advs.202306770. Epub 2024 May 6.

Beaconet: A Reference-Free Method for Integrating Multiple Batches of Single-Cell Transcriptomic Data in Original Molecular Space

Affiliations

Beaconet: A Reference-Free Method for Integrating Multiple Batches of Single-Cell Transcriptomic Data in Original Molecular Space

Han Xu et al. Adv Sci (Weinh). 2024 Jul.

Abstract

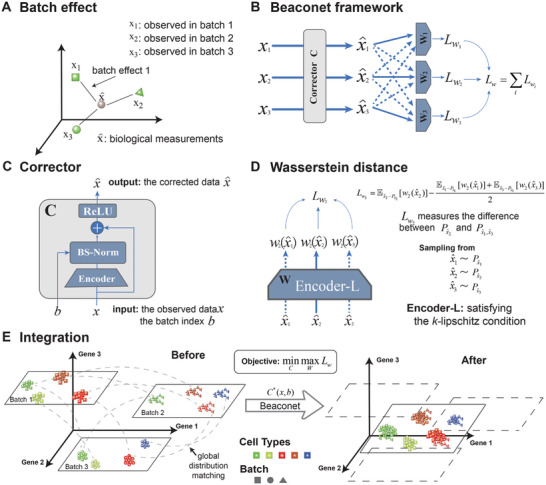
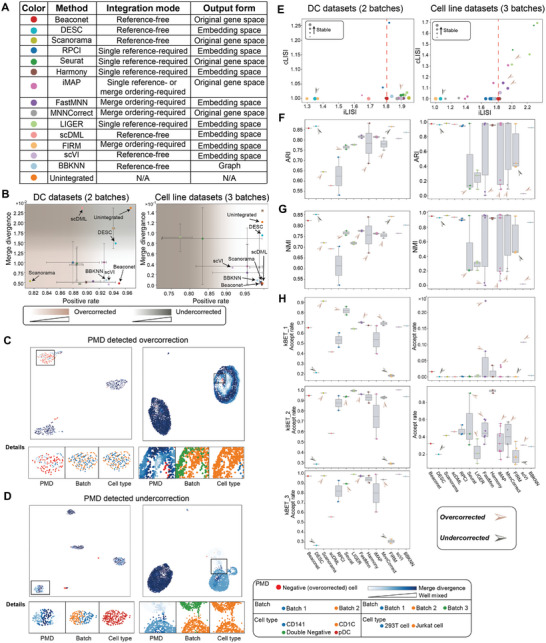
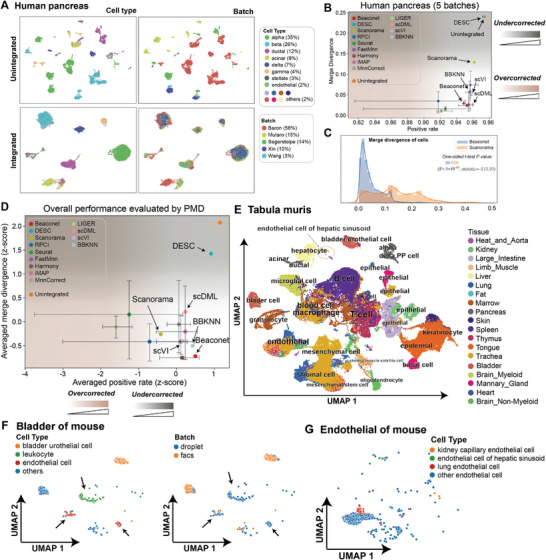
Integrating multiple single-cell datasets is essential for the comprehensive understanding of cell heterogeneity. Batch effect is the undesired systematic variations among technologies or experimental laboratories that distort biological signals and hinder the integration of single-cell datasets. However, existing methods typically rely on a selected dataset as a reference, leading to inconsistent integration performance using different references, or embed cells into uninterpretable low-dimensional feature space. To overcome these limitations, a reference-free method, Beaconet, for integrating multiple single-cell transcriptomic datasets in original molecular space by aligning the global distribution of each batch using an adversarial correction network is presented. Through extensive comparisons with 13 state-of-the-art methods, it is demonstrated that Beaconet can effectively remove batch effect while preserving biological variations and is superior to existing unsupervised methods using all possible references in overall performance. Furthermore, Beaconet performs integration in the original molecular feature space, enabling the characterization of cell types and downstream differential expression analysis directly using integrated data with gene-expression features. Additionally, when applying to large-scale atlas data integration, Beaconet shows notable advantages in both time- and space-efficiencies. In summary, Beaconet serves as an effective and efficient batch effect removal tool that can facilitate the integration of single-cell datasets in a reference-free and molecular feature-preserved mode.

Keywords: batch effects; large‐scale; molecular feature space; reference‐free; single‐cell datasets.


Conflict of interest statement

The authors declare no conflict of interest.

Figures

Figure 1
Figure 1
The dependence on the selection of references impacts integration performance. A) UMAP projection of integrated cell line datasets by DESC, Seurat, Harmony, RPCI, iMAP, and Scanorama. The panels of odd rows are colored by the cell types, and the panels of even rows are colored by the batches of datasets (see Figures S1 and S2 (Supporting Information) for all figures of 13 methods on cell line datasets). B) UMAP projection of integrated DC datasets by DESC, Seurat, Harmony, RPCI, iMAP, and Scanorama (see Figure S3 and S4 for all figures of 13 methods on DC datasets). The panels of odd rows are colored by the cell types, and the panels of even rows are colored by the batches of datasets.
Figure 2
Figure 2
Overview of Beaconet. A) An illustration of a batch effect in three batches of datasets. B) The framework of Beaconet. An example for three batches of datasets. C) The architecture of the corrector for learning the correction function. D) An encoder satisfying k‐Lipschitz condition for estimating the Wasserstein distance between the distributions of batch 2 and the joint distribution of other batches, e.g., integrating 3 batches. E) The multiple batches of datasets with batch‐specific cell types are merged together in the original gene expression space.
Figure 3
Figure 3
Comparison of PMD with NMI, ARI, kBET and LISI. For the methods that require a single reference or the ordering of batches, we run them with all possible references (orderings). For all single‐reference‐based methods, we run 2 times on DC datasets, three times on cell line datasets, and five times on human pancreatic datasets for traversing all references. For all merge‐ordering‐based methods, we run them two times on DC datasets, and 6 times on cell line datasets for traversing all merge orderings. A) Description of Beaconet and other 13 integration methods. B) PMD evaluated the performance of Beaconet and 13 compared methods on two‐batch DC datasets and three‐batch cell line datasets. C) PMD detected overcorrection on the integrated data (Scanorama). D) PMD detected under‐correction on the integrated data (DESC). E) LISI evaluated the performance of Beaconet and 13 integration methods on two‐batch DC datasets and three‐batch cell line datasets. F) ARI evaluated the performance of Beaconet and 13 integration methods on two‐batch DC datasets and three‐batch cell line datasets. G) NMI evaluated the performance of Beaconet and 13 integration methods on two‐batch DC datasets and three‐batch cell line datasets. H) kBET evaluated the performance of Beaconet and 13 integration methods on two‐batch DC datasets and three‐batch cell line datasets.
Figure 4
Figure 4
Beaconet accurately integrates multiple batches of datasets without reference. A) UMAP projection of the five human pancreatic datasets before and after integration by Beaconet. B) PMD evaluated Beaconet, five reference‐free methods, and 7 reference‐based methods with all possible references on integrated five human pancreatic datasets. C) Comparing the distribution of merge divergence of positive cells in the integrated human pancreatic datasets processed by Beaconet and Scanorama. The details of a statistical test are available in Section 5.4: Statistical Analysis. D) The overall performance comparison of Beaconet and 12 integration methods using the averaged PMD scores on the three integration tasks. The error bar indicates the uncertainty of performance caused by the selection of reference (ordering). E) UMAP projection of the 2‐batch Tabula muris datasets integrated by Beaconet. The tissues are indicated with different colors and the major cell types are annotated. F) UMAP projection of an individual tissue (bladder) in Tabula muris (See all figures of 19 tissues in Figures S12 and S13, Supporting Information). The cell types are indicated by different colors. g) UMAP projection of four distinct cell types of endothelial cells across all tissues in integrated data.
Figure 5
Figure 5
The integrated molecular feature space of Beaconet is effective for characterizing the heterogeneity of cells. A) The heat map of marker genes of major cell types on the integrated human pancreatic datasets. B) The overlap of detected marker genes in top‐10 differentially expressed genes of integrated and original data. C) The integrated data preserves the difference of the features of the two subpopulations of ductal cells and conserves the expression pattern of PPY of gamma cells. The details of a statistical test are available in Section 5.4: Statistical Analysis. D) Comparison of the integrated and unintegrated gene features using UMAP projection, including GLS, FXYD5, CELA2A, RNASE1 IAPP MAFA SST, and PPY.
Figure 6
Figure 6
The computational efficiency of Beaconet to integrate the 2 datasets sequenced by distinct platforms in large‐scale Tabula Muris. A) Comparison of the time cost of Beaconet, DESC, Scanorama, Seurat, FastMNN, Harmony, and iMAP on the full Tabula Muris. B) The comparison of peak memory consumption of Beaconet, DESC, Scanorama, Seurat, FastMNN, Harmony, and iMAP on the full Tabula Muris. C) The comparison of time cost‐cell number curves of Beaconet and Scanorama on down‐sampling Tabula muris. D) The memory consumption of Beaconet is stable during the processing of integration (see Figure S15, Supporting Information for the results of other methods).
Figure 7
Figure 7
Ablation study for demonstrating the improvement of Beaconet by BS‐Norm. The details of a statistical test are available in Section 5.4: Statistical Analysis. A) UMAP projection of integrated five‐batch human pancreatic datasets, 2‐batch Tabula muris, three‐batch cell line datasets, and 2‐batch DC datasets using Beaconet. Each panel is colored by the batch labels of datasets. B) UMAP projection of integrated five‐batch human pancreatic datasets, two‐batch Tabula Muris, three‐batch cell line datasets, and 2‐batch DC datasets using the variant Beaconet without BS‐Norm. Each panel is colored by the batch labels of datasets. C) Comparing the distribution of merge divergence of the full Beaconet and the variant Beaconet without BS‐Norm on four groups of datasets, including five batches of human pancreatic datasets, two mouse atlas datasets in Tabula Muris, three batches of cell line datasets and two batches of DC datasets. D) Comparing the distribution of merge divergence of the full Beaconet and the variant Beaconet without BS‐Norm on seven mouse tissues, including marrow, limb_muscle, trachea, spleen, tongue, lung, and mammary_gland.

Similar articles

Cited by

References

    1. Rozenblatt‐Rosen O., Stubbington M. J. T., Regev A., Teichmann S. A., Nature 2017, 550, 451. - PubMed
    1. Han X., Wang R., Zhou Y., Fei L., Sun H., Lai S., Saadatpour A., Zhou Z., Chen H., Ye F., Huang D., Xu Y., Huang W., Jiang M., Jiang X., Mao J., Chen Y., Lu C., Xie J., Fang Q., Wang Y., Yue R., Li T., Huang H., Orkin S. H., Yuan G.‐C., Chen M., Guo G., Cell 2018, 172, 1091. - PubMed
    1. Tabula Muris Consortium , Nature 2018, 562, 367. - PMC - PubMed
    1. Zhang F., Wei K., Slowikowski K., Fonseka C. Y., Rao D. A., Kelly S., Goodman S. M., Tabechian D., Hughes L. B., Salomon‐Escoto K., Watts G. F. M., Jonsson A. H., Rangel‐Moreno J., Meednu N., Rozo C., Apruzzese W., Eisenhaure T. M., Lieb D. J., Boyle D. L., Mandelin A. M., Albrecht J., Bridges S. L., Buckley C. D., Buckner J. H., Dolan J., Guthridge J. M., Gutierrez‐Arcelus M., Ivashkiv L. B., James E. A., James J. A., et al., Nature Immunol. 2019, 20, 928. - PMC - PubMed
    1. Arazi A., Rao D. A., Berthier C. C., Davidson A., Liu Y., Hoover P. J., Chicoine A., Eisenhaure T. M., Jonsson A. H., Li S., Lieb D. J., Zhang F., Slowikowski K., Browne E. P., Noma A., Sutherby D., Steelman S., Smilek D. E., Tosta P., Apruzzese W., Massarotti E., Dall'Era M., Park M., Kamen D. L., Furie R. A., Payan‐Schober F., Pendergraft W. F., McInnis E. A., Buyon J. P., Petri M. A., et al., Nature Immunol. 2019, 20, 902. - PMC - PubMed

LinkOut - more resources