. 2024 Aug;116(2):380-389.
doi: 10.1002/cpt.3286. Epub 2024 May 6.

Transcriptomic Profiles Associated with Experimental Placebo Effects in Chronic Pain

Affiliations

Transcriptomic Profiles Associated with Experimental Placebo Effects in Chronic Pain

Luana Colloca et al. Clin Pharmacol Ther. 2024 Aug.

Abstract

Gene expression networks associated with placebo effects are understudied; in this study, we identified transcriptomic profiles associated with placebo responsivity. Participants suffering from chronic pain underwent a verbal suggestion and conditioning paradigm with individually tailored thermal painful stimulations to elicit conditioned placebo effects. Participants reported pain intensity on a visual analog scale (VAS) anchored from zero = no pain to 100 = maximum imaginable pain. RNA was extracted from venous blood and RNA sequencing and validation tests were performed to identify differentially expressed genes (DEGs) associated with placebo effects, controlling for sex and level of pain. Unbiased enrichment analyses were performed to identify biological processes associated with placebo effects. Of the 10,700 protein-coding genes that passed quality control filters, 667 were found to be associated with placebo effects (FDR <0.05). Most genes (97%) upregulated were associated with larger placebo effects. The 17 top transcriptome-wide significant genes were further validated via RT-qPCR in an independent cohort of chronic pain participants. Six of them (CCDC85B, FBXL15, HAGH, PI3, SELENOM, and TNFRSF4) showed positive and significant (P < 0.05) correlation with placebo effects in the cohort. The overall DEGs were highly enriched in regulation of expression of SLITs and ROBOs (R-HSA-9010553, FDR = 1.26e-33), metabolism of RNA (R-HSA-8953854, FDR = 1.34e-30), Huntington's disease (hsa05016, FDR = 9.84e-31), and ribosome biogenesis (GO:0042254, FDR = 2.67e-15); alternations in these pathways might jeopardize the proneness to elicit placebo effects. Future studies are needed to replicate this finding and better understand the unique molecular dynamics of people who are more or less affected by pain and placebo.


Conflict of interest statement

Conflict of Interest

The authors declared no competing interests for this work.

Figures

Figure 1.
Figure 1.
Experimental procedure. Participants were instructed that when the electrode was activated, a green screen would appear, and the pain experience would be reduced. A red screen would have alerted them that the electrode was off and the level of pain was set at a high pain intensity. On the contrary, the green screen was associated with low pain intensity. The distinctly tailored non-painful and painful stimulations were intentionally repeated to create a learning experience boosting expectations of analgesia and therefore experimental placebo effects. After a conditioning phase, unbeknownst to the participant, identical moderate intensities of thermal pain stimulation were paired with both red and green screens. The intensities were surreptitiously set at the same level to assess placebo effects assuming that the participant would have still expected high and low painful stimulations, respectively. We defined this part as the testing phase where any differences between red- and green-related ratings represented the placebo hypoalgesia. Differences in pain intensity ratings between the red and green trials during the testing phase were used to calculate placebo effects.
Figure 2.
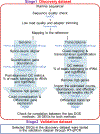
Figure 2.. Study workflow.
Step-by-step RNA sequencing in the Discovery and Validation cohorts.
Figure 3.
Figure 3.. Distribution of placebo effects in the Discovery and Validation cohorts.
Individual placebo effects were plotted for the Discovery and Validation cohorts. Each dot represents one participant’s placebo effect score, calculated as the average of the red- minus- green pain ratings of the six pair of trials during the testing phase. Controlling for sex and low- and high-impact pain, both cohorts showed significant placebo effects. Data are expressed as individual standard error and mean values of the six red- minus green-pain ratings.
Figure 4.
Figure 4.. Transcriptomic changes associated with the placebo effects.
The volcano plot summarizes the results of DEG analysis. To define statistically significant DEGs we applied adjusted p-value ≤0.05. In red are shown genes that fulfill the criteria. In green are displayed genes that do not fulfill the adjusted p-value criteria but not the LFC. The significant six genes which passed validation are highlighted.
Figure 5.
Figure 5.
(A) Metascape bar graph of enriched terms across 667 input DEGs, colored by p-values. Significance is represented in the X axis as -log10 (pvalue). A higher -log10 (pvalue) corresponds to higher significance and is indicated by a dark orange bar color. Light yellow bars indicate lower significance. (B) Metascape network plot, where terms with a similarity > 0.3 are connected by edges. The significance of the enriched term is directly proportional to the size of the circles. Each color shows the top enriched significant pathways. The nodes show the strength of interaction of functionally connected genes.
Figure 6.
Figure 6.
(A) Pearson coefficient and significance correlation eigengene WGCNA modules with placebo effects and High vs Low Placebo responders. (B). Enrichment analysis results. Genes in the black module were overrepresented in Huntington’s disease, cellular response to stress, and metabolism of RNA. Genes in the purple module were enriched in pathways of neurodegeneration and neutrophil degranulation. Genes included in the pink module were highly represented in the cofactor biosynthesis pathway. Modules in red, magenta, and green-yellow boxes were enriched in DNA protein and chromatin metabolic processes.

Similar articles

Cited by

References

    1. Kaptchuk TJ et al. Components of placebo effect: randomised controlled trial in patients with irritable bowel syndrome. BMJ 336, 999–1003 (2008). DOI: 10.1136/bmj.39524.439618.25. - DOI - PMC - PubMed
    1. Petersen GL et al. Expectations and positive emotional feelings accompany reductions in ongoing and evoked neuropathic pain following placebo interventions. Pain 155, 2687–98 (2014). DOI: 10.1016/j.pain.2014.09.036. - DOI - PubMed
    1. Schmitz J. et al. Positive Treatment Expectancies Reduce Clinical Pain and Perceived Limitations in Movement Ability Despite Increased Experimental Pain: A Randomized Controlled Trial on Sham Opioid Infusion in Patients with Chronic Back Pain. Psychother Psychosom 88, 203–14 (2019). DOI: 10.1159/000501385. - DOI - PubMed
    1. Kam-Hansen S. et al. Altered placebo and drug labeling changes the outcome of episodic migraine attacks. Science translational medicine 6, 218ra5 (2014). DOI: 10.1126/scitranslmed.3006175. - DOI - PMC - PubMed
    1. Tetreault P, Mansour A, Vachon-Presseau E, Schnitzer TJ, Apkarian AV & Baliki MN Brain Connectivity Predicts Placebo Response across Chronic Pain Clinical Trials. PLoS Biol 14, e1002570 (2016). DOI: 10.1371/journal.pbio.1002570. - DOI - PMC - PubMed