. 2024 May 16;128(19):4602-4620.
doi: 10.1021/acs.jpcb.3c08469. Epub 2024 May 6.

On the Validation of Protein Force Fields Based on Structural Criteria

Affiliations

On the Validation of Protein Force Fields Based on Structural Criteria

Martin Stroet et al. J Phys Chem B. .

Abstract

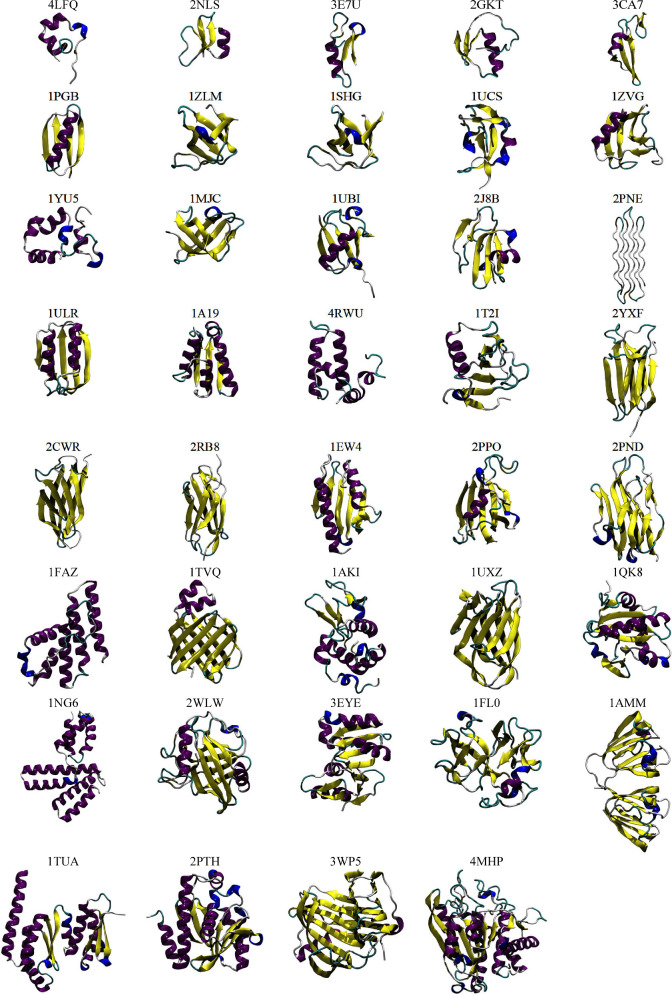
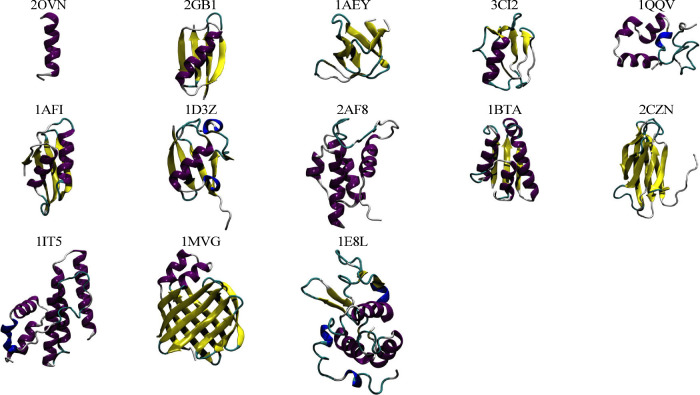
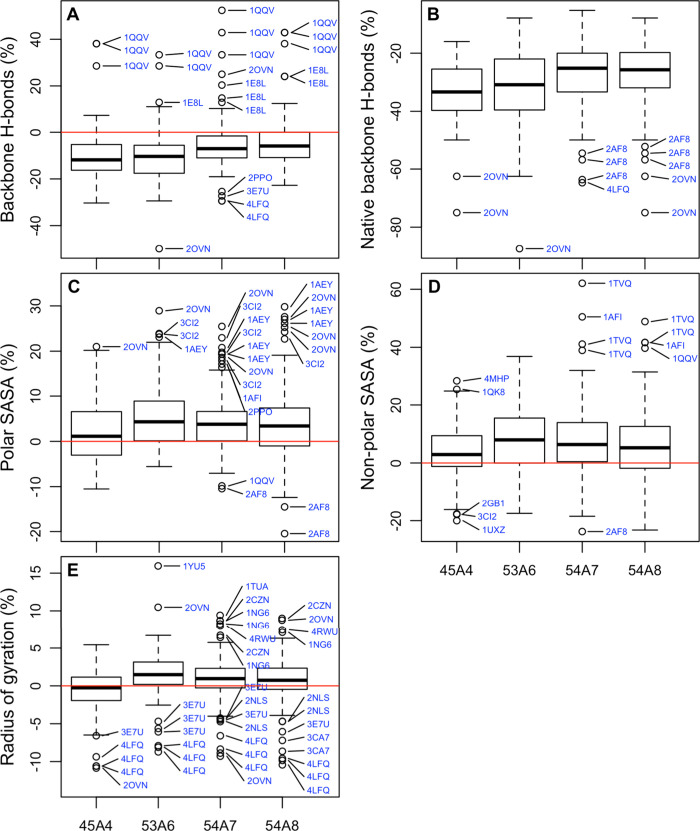
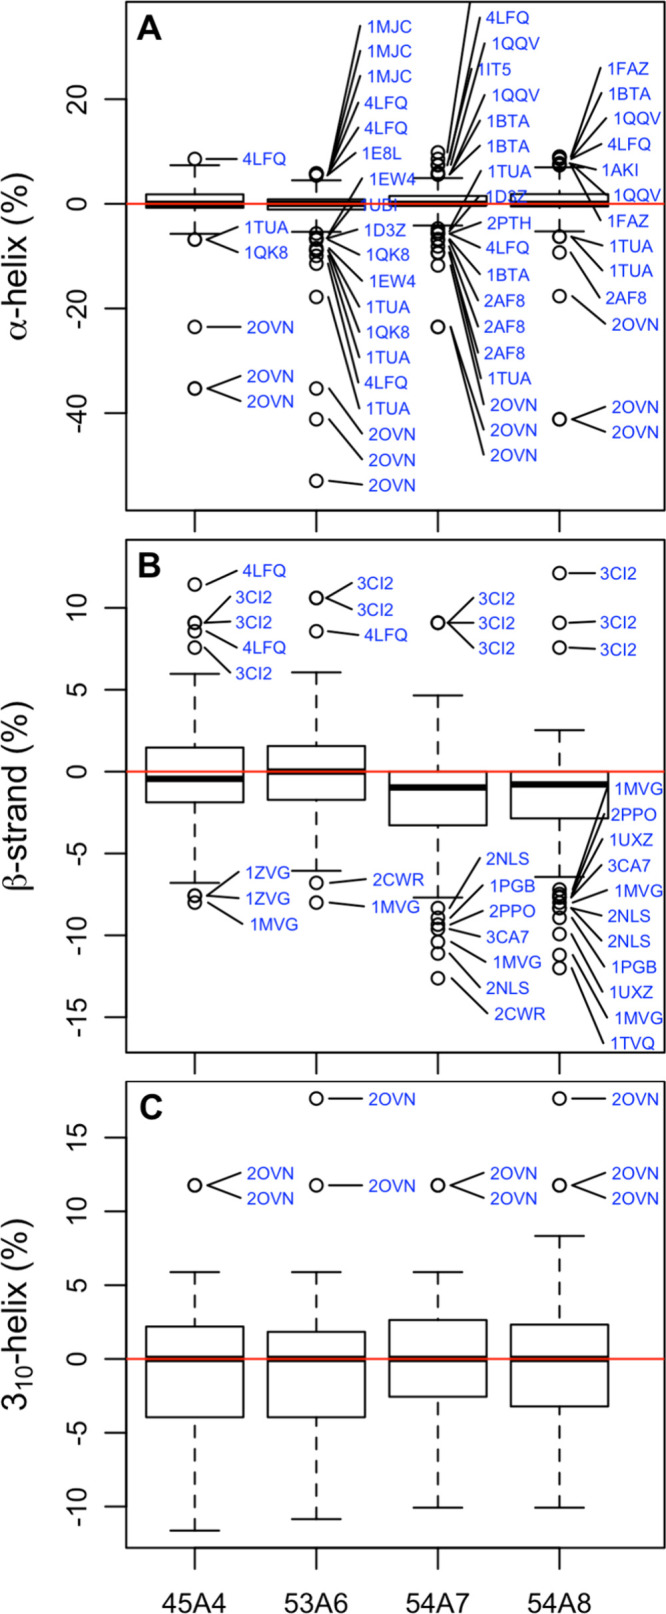
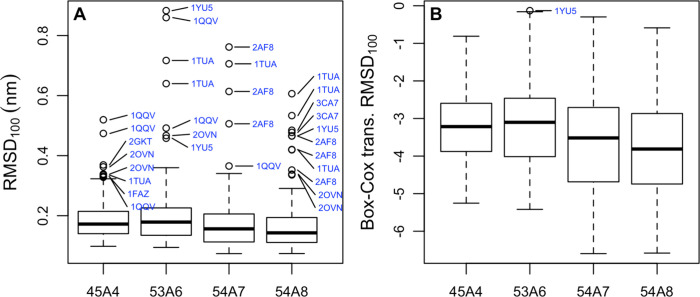
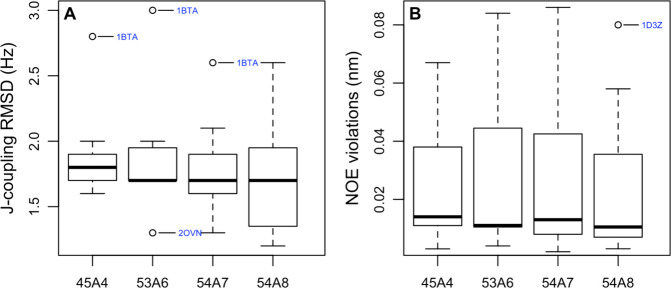
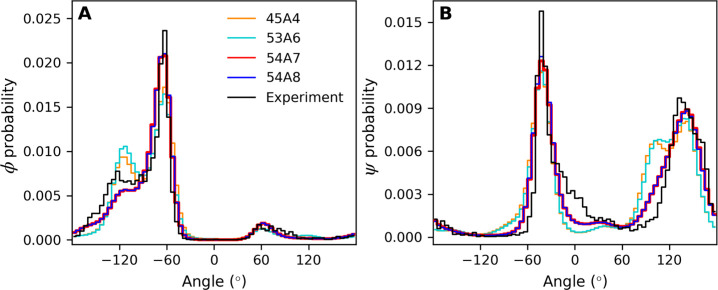
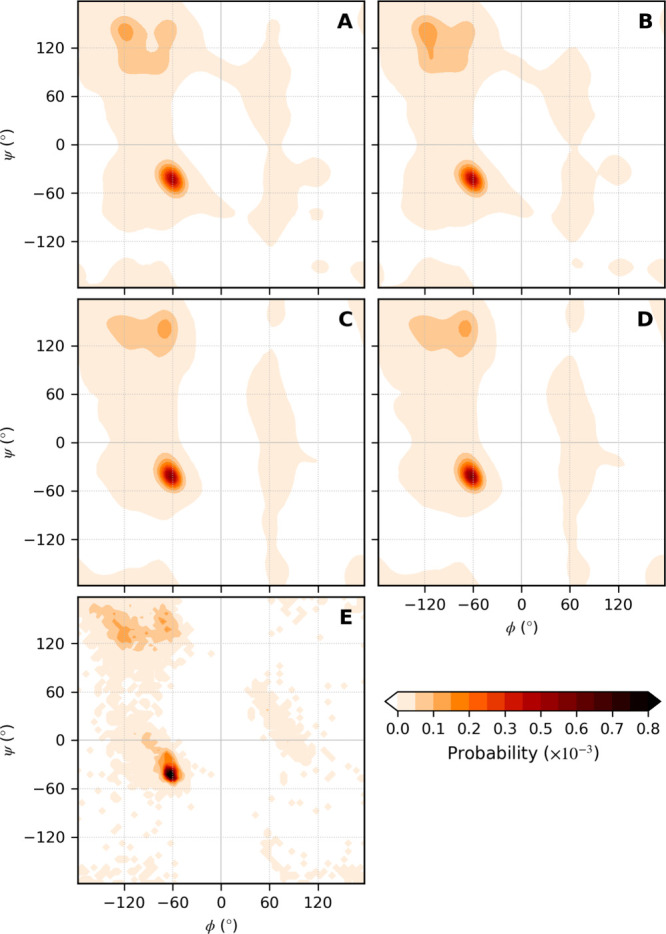
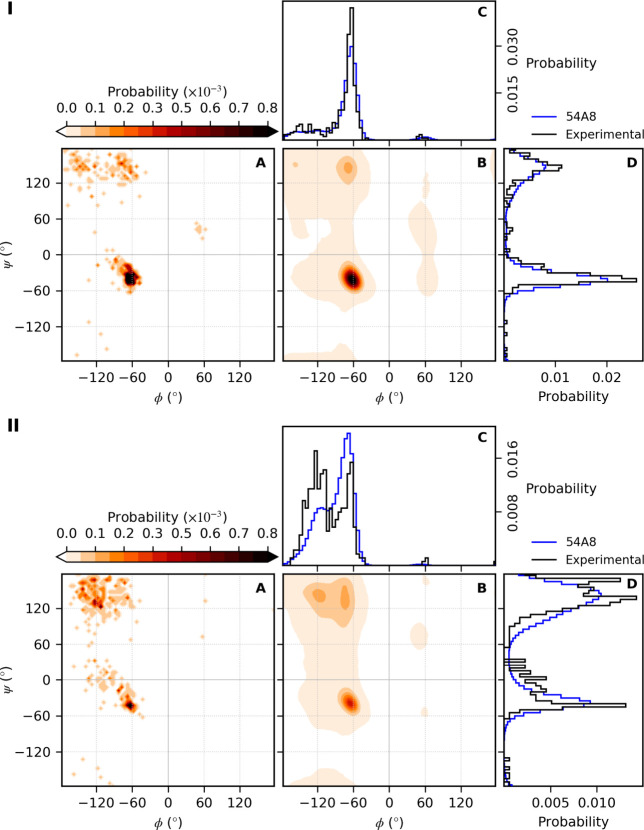
Molecular dynamics simulations depend critically on the quality of the force field used to describe the interatomic interactions and the extent to which it has been validated for use in a specific application. Using a curated test set of 52 high-resolution structures, 39 derived from X-ray diffraction and 13 solved using NMR, we consider the extent to which different parameter sets of the GROMOS protein force field can be distinguished based on comparing a range of structural criteria, including the number of backbone hydrogen bonds, the number of native hydrogen bonds, polar and nonpolar solvent-accessible surface area, radius of gyration, the prevalence of secondary structure elements, J-coupling constants, nuclear Overhauser effect (NOE) intensities, positional root-mean-square deviations (RMSD), and the distribution of backbone ϕ and ψ dihedral angles. It is shown that while statistically significant differences between the average values of individual metrics could be detected, these were in general small. Furthermore, improvements in agreement in one metric were often offset by loss of agreement in another. The work establishes a framework and test set against which protein force fields can be validated. It also highlights the danger of inferring the relative quality of a given force field based on a small range of structural properties or small number of proteins.


Conflict of interest statement

The authors declare no competing financial interest.

Figures

Figure 1
Figure 1
Cartoon depictions of the starting structures derived from X-ray crystallographic data (purple, α-helix; yellow, β-strand; blue, 310-helix; red, π-helix; cyan, turn; white, coil).
Figure 2
Figure 2
Cartoon depictions of the starting structures derived from NMR data (purple, α-helix; yellow, β-strand; blue, 310-helix; red, π-helix; cyan, turn; white, coil).
Figure 3
Figure 3
Boxplots of the percentage change in (A) the number of backbone hydrogen bonds, (B) the number of native backbone hydrogen bonds, (C) the total polar solvent accessible surface area (SASA), (D) the total nonpolar SASA, and (E) the radius of gyration for all proteins simulated with a given parameter set compared to the corresponding starting conformation (see the text). Outliers are marked with blue text. An outlier was defined as a value which lies above or below the quartile boundary plus 1.5 times the interquartile range. Multiple occurrences of the same code refer to replicas.
Figure 4
Figure 4
Boxplots of the percentage difference between the fraction of the sequence assigned to an individual element of secondary structure by the program DSSP in the simulation compared to the corresponding starting conformation for (A) α-helix, (B) β-helix, and (C) 310-helix. Note: to avoid overlap in (A), only outliers 2.25 times the interquartile range or greater are shown.
Figure 5
Figure 5
(A) Boxplots of the scaled positional root-mean-square deviation (RMSD100) between the backbone of conformations sampled during the last 5 ns of simulation and the corresponding starting conformation for a given parameter set. Note that the RMSD was not scaled for the three proteins that contained fewer than 40 residues (see the text). (B) The data in (A) after a Box-Cox transformation was performed.
Figure 6
Figure 6
Boxplots showing (A) the RMSD between the J-coupling value measured experimentally and the J-coupling value calculated from the simulations configurations and (B) the average NOE violation. Only systems for which the starting conformation was derived based on NMR data and for which the corresponding experimental data were available were considered. The calculated values were based on conformations sampled during the last 5 ns of each simulation. Data from different replicas were pooled. The average NOE violation for each protein was obtained by summing the NOE distance violations and dividing by the total number of reported NOEs.
Figure 7
Figure 7
Normalized (A) ϕ and (B) ψ dihedral angle distributions for all proteins. The distributions were obtained by combining data from conformations sampled during the last 5 ns for all proteins simulated with a given parameter set. The equivalent plot obtained by combining data from each of the starting conformations is shown for comparison. The bin size was 5°. Note that the line width used for 54A7 is increased so that it can be distinguished from that of 54A8.
Figure 8
Figure 8
Ramachandran plots showing the relative probability of finding a given combination of ϕ and ψ angles for all structures simulated with the (A) 45A4, (B) 53A6, (C) 54A7, and (D) 54A8 parameter sets. The plots were constructed by combining all conformations sampled during the last 5 ns of the simulations using a bin size of 0.5°. (E) Equivalent plot for the starting conformations. Due to the more limited statistics in the case of the starting conformations, the probabilities were calculated using a bin size of 5°, resulting in the pixelated appearance.
Figure 9
Figure 9
Example dihedral probability distributions for individual amino acids (alanine, panel I; threonine, panel II): (A) probability of finding a given combination of ϕ and ψ angles in the experimentally obtained starting conformations; (B) probability of finding a given combination of ϕ and ψ angles simulated with the 54A8 parameter set; (C) probability distributions of the ϕ dihedral angle; (D) probability distributions of the ψ dihedral angle. The plots were constructed from conformations sampled during the last 5 ns of the simulations as described in Figures 7 and 8. The total numbers of alanine and threonine residues included in this analysis are 357 and 351, respectively.

References

    1. van Gunsteren W. F.; Daura X.; Hansen N.; Mark A. E.; Oostenbrink C.; Riniker S.; Smith L. J. Validation of molecular simulation: An overview of issues. Angew. Chem., Int. Ed. 2018, 57 (4), 884–902. 10.1002/anie.201702945. - DOI - PubMed
    1. MacKerell A. D. Jr.; Bashford D.; Bellott M.; Dunbrack R. L. Jr.; Evanseck J. D.; Field M. J.; Fischer S.; Gao J.; Guo H.; Ha S.; et al. All-atom empirical potential for molecular modeling and dynamics studies of proteins. J. Phys. Chem. B 1998, 102 (18), 3586–3616. 10.1021/jp973084f. - DOI - PubMed
    1. Cornell W. D.; Cieplak P.; Bayly C. I.; Gould I. R.; Merz K. M.; Ferguson D. M.; Spellmeyer D. C.; Fox T.; Caldwell J. W.; Kollman P. A. A second generation force field for the simulation of proteins, nucleic acids, and organic molecules. J. Am. Chem. Soc. 1995, 117 (19), 5179–5197. 10.1021/ja00124a002. - DOI
    1. Jorgensen W. L.; Maxwell D. S.; Tirado-Rives J. Development and testing of the OPLS all-atom force field on conformational energetics and properties of organic liquids. J. Am. Chem. Soc. 1996, 118 (45), 11225–11236. 10.1021/ja9621760. - DOI
    1. Scott W. R. P.; Hunenberger P. H.; Tironi I. G.; Mark A. E.; Billeter S. R.; Fennen J.; Torda A. E.; Huber T.; Kruger P.; van Gunsteren W. F. The GROMOS biomolecular simulation program package. J. Phys. Chem. A 1999, 103 (19), 3596–3607. 10.1021/jp984217f. - DOI

Publication types

MeSH terms