

Development of 42 marker panel for in-depth study of cancer associated fibroblast niches in breast cancer using imaging mass cytometry
- PMID: 38711512
- PMCID: PMC11070582
- DOI: 10.3389/fimmu.2024.1325191
Development of 42 marker panel for in-depth study of cancer associated fibroblast niches in breast cancer using imaging mass cytometry
Abstract
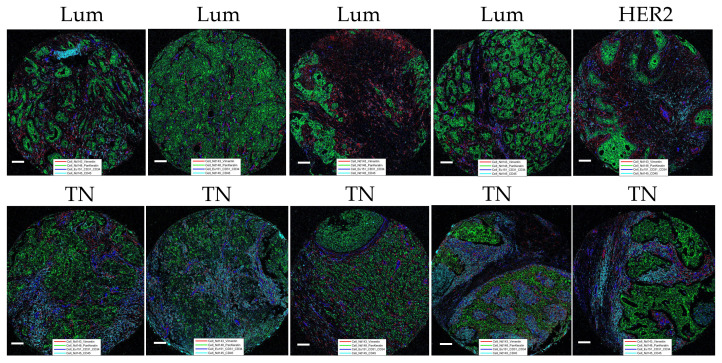
Imaging Mass Cytometry (IMC) is a novel, and formidable high multiplexing imaging method emerging as a promising tool for in-depth studying of tissue architecture and intercellular communications. Several studies have reported various IMC antibody panels mainly focused on studying the immunological landscape of the tumor microenvironment (TME). With this paper, we wanted to address cancer associated fibroblasts (CAFs), a component of the TME very often underrepresented and not emphasized enough in present IMC studies. Therefore, we focused on the development of a comprehensive IMC panel that can be used for a thorough description of the CAF composition of breast cancer TME and for an in-depth study of different CAF niches in relation to both immune and breast cancer cell communication. We established and validated a 42 marker panel using a variety of control tissues and rigorous quantification methods. The final panel contained 6 CAF-associated markers (aSMA, FAP, PDGFRa, PDGFRb, YAP1, pSMAD2). Breast cancer tissues (4 cases of luminal, 5 cases of triple negative breast cancer) and a modified CELESTA pipeline were used to demonstrate the utility of our IMC panel for detailed profiling of different CAF, immune and cancer cell phenotypes.
Keywords: breast cancer; cancer associated fibroblasts; imaging mass cytometry; microniches; tumor microenvironment.
Copyright © 2024 Røgenes, Finne, Winge, Akslen, Östman and Milosevic.
Conflict of interest statement
The authors declare that the research was conducted in the absence of any commercial or financial relationships that could be construed as a potential conflict of interest.
Figures


Similar articles
-
From surfing to diving into the tumor microenvironment through multiparametric imaging mass cytometry.Front Immunol. 2025 Apr 11;16:1544844. doi: 10.3389/fimmu.2025.1544844. eCollection 2025. Front Immunol. 2025. PMID: 40292277 Free PMC article. Review.
-
Depicting the cellular complexity of pancreatic adenocarcinoma by Imaging Mass Cytometry: focus on cancer-associated fibroblasts.Front Immunol. 2024 Nov 7;15:1472433. doi: 10.3389/fimmu.2024.1472433. eCollection 2024. Front Immunol. 2024. PMID: 39575252 Free PMC article.
-
A subset of activated fibroblasts is associated with distant relapse in early luminal breast cancer.Breast Cancer Res. 2020 Jul 14;22(1):76. doi: 10.1186/s13058-020-01311-9. Breast Cancer Res. 2020. PMID: 32665033 Free PMC article.
-
Refining the optimal CAF cluster marker for predicting TME-dependent survival expectancy and treatment benefits in NSCLC patients.Sci Rep. 2024 Jul 21;14(1):16766. doi: 10.1038/s41598-024-55375-0. Sci Rep. 2024. PMID: 39034310 Free PMC article.
-
Crosstalk between cancer-associated fibroblasts and immune cells in the tumor microenvironment: new findings and future perspectives.Mol Cancer. 2021 Oct 11;20(1):131. doi: 10.1186/s12943-021-01428-1. Mol Cancer. 2021. PMID: 34635121 Free PMC article. Review.
Cited by
-
Toward spatial glycomics and glycoproteomics: Innovations and applications.BBA Adv. 2025 Feb 6;7:100146. doi: 10.1016/j.bbadva.2025.100146. eCollection 2025. BBA Adv. 2025. PMID: 40027887 Free PMC article.
-
The Application of Single-Cell Technologies for Vaccine Development Against Viral Infections.Vaccines (Basel). 2025 Jun 26;13(7):687. doi: 10.3390/vaccines13070687. Vaccines (Basel). 2025. PMID: 40733664 Free PMC article. Review.
-
The role of CAFs in therapeutic resistance in triple negative breast cancer: an emerging challenge.Front Mol Biosci. 2025 Mar 31;12:1568865. doi: 10.3389/fmolb.2025.1568865. eCollection 2025. Front Mol Biosci. 2025. PMID: 40230452 Free PMC article. Review.
-
From surfing to diving into the tumor microenvironment through multiparametric imaging mass cytometry.Front Immunol. 2025 Apr 11;16:1544844. doi: 10.3389/fimmu.2025.1544844. eCollection 2025. Front Immunol. 2025. PMID: 40292277 Free PMC article. Review.
-
Crosstalk between heterogeneous cancer-associated fibroblast subpopulations and the immune system in breast cancer: key players and promising therapeutic targets.J Exp Clin Cancer Res. 2025 Sep 1;44(1):263. doi: 10.1186/s13046-025-03527-z. J Exp Clin Cancer Res. 2025. PMID: 40890855 Review.
References
Publication types
MeSH terms
Substances
LinkOut - more resources
Full Text Sources
Medical
Miscellaneous