Association between a metabolic score for insulin resistance and hypertension: results from National Health and Nutrition Examination Survey 2007-2016 analyses
- PMID: 38711979
- PMCID: PMC11070536
- DOI: 10.3389/fendo.2024.1369600
Association between a metabolic score for insulin resistance and hypertension: results from National Health and Nutrition Examination Survey 2007-2016 analyses
Abstract
Background: The Metabolic Score for Insulin Resistance (METS-IR) offers a promising and reliable non-insulin-based approach to assess insulin resistance and evaluate cardiometabolic risk. However, evidence for the association between METS-IR and hypertension was still limited.
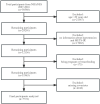
Methods: Participants from the National Health and Nutrition Examination Survey (NHANES) database from 2007-2016 were selected for weighted multivariable regression analyses, subgroup analyses and restricted cubic spline (RCS) modeling to assess the association between the METS-IR and hypertension, as well as systolic blood pressure (SBP) and diastolic blood pressure (DBP).
Results: This study enrolled 7,721 adults aged ≥20 years, 2,926 (34.03%) of whom was diagnosed as hypertension. After adjusting for all potential covariates, an increased METS-IR (log2 conversion, denoted as log2METS-IR) was independently associated with a higher prevalence of hypertension (odd ratio [OR] 3.99, 95% confidence interval [CI] 3.19~5.01). The OR for hypertension in subjects with the highest quartile of METS-IR was 3.89-fold (OR 3.89, 95% CI 3.06~4.94) higher than that in those with the lowest quartile of METS-IR. This positive correlation became more significant as METS-IR increased (p for trend < 0.001). Log2METS-IR was significantly correlated with increase in SBP (β 6.75, 95% CI 5.65~7.85) and DBP (β 5.59, 95% CI 4.75~6.43) in a fully adjusted model. Consistent results were obtained in subgroup analyses. Hypertension, SBP and DBP all exhibited a non-linear increase with the rise in METS-IR. The minimal threshold for the beneficial association of METS-IR with hypertension, SBP and DBP were all identified to be 46.88.
Conclusion: The findings of this study revealed a significant positive association between METS-IR and hypertension among US adults, suggesting METS-IR as a potential tool for assessing hypertension risk.
Keywords: NHANES; hypertension; insulin resistance; metabolic score for insulin resistance (METS-IR); metabolic syndrome.
Copyright © 2024 Zeng, Zhang, Yang, Wang, Zheng, Hou, Tong, Fan, Wang and Fang.
Conflict of interest statement
The authors declare that the research was conducted in the absence of any commercial or financial relationships that could be construed as a potential conflict of interest.
Figures


Similar articles
-
Association of METS-IR index with Type 2 Diabetes: A cross-sectional analysis of national health and nutrition examination survey data from 2009 to 2018.PLoS One. 2024 Nov 8;19(11):e0308597. doi: 10.1371/journal.pone.0308597. eCollection 2024. PLoS One. 2024. PMID: 39514584 Free PMC article.
-
Linear positive association of metabolic score for insulin resistance with stroke risk among American adults: a cross-sectional analysis of National Health and Nutrition Examination Survey datasets.J Stroke Cerebrovasc Dis. 2024 Nov;33(11):107994. doi: 10.1016/j.jstrokecerebrovasdis.2024.107994. Epub 2024 Sep 4. J Stroke Cerebrovasc Dis. 2024. PMID: 39241846
-
Association between metabolic score for insulin resistance (METS-IR) and hypertension: a cross-sectional study based on NHANES 2007-2018.Lipids Health Dis. 2025 Feb 21;24(1):64. doi: 10.1186/s12944-025-02492-y. Lipids Health Dis. 2025. PMID: 39985010 Free PMC article.
-
Association between lymphocyte to high-density lipoprotein cholesterol ratio and insulin resistance and metabolic syndrome in US adults: results from NHANES 2007-2018.Lipids Health Dis. 2025 Jan 10;24(1):9. doi: 10.1186/s12944-024-02411-7. Lipids Health Dis. 2025. PMID: 39794792 Free PMC article.
-
Prognostic interactions between cardiovascular risk factors.Dan Med J. 2014 Jul;61(7):B4892. Dan Med J. 2014. PMID: 25123126 Review.
Cited by
-
Association of METS-IR index with Type 2 Diabetes: A cross-sectional analysis of national health and nutrition examination survey data from 2009 to 2018.PLoS One. 2024 Nov 8;19(11):e0308597. doi: 10.1371/journal.pone.0308597. eCollection 2024. PLoS One. 2024. PMID: 39514584 Free PMC article.
-
Association of triglyceride-glucose index and estimated glucose disposal rate with outcomes in patients with acute myocardial infarction: Cumulative effect and mediation analysis.PLoS One. 2025 Jul 23;20(7):e0328150. doi: 10.1371/journal.pone.0328150. eCollection 2025. PLoS One. 2025. PMID: 40700433 Free PMC article.
-
Association between METS-IR index and obstructive sleep apnea: evidence from NHANES.Sci Rep. 2025 Feb 24;15(1):6654. doi: 10.1038/s41598-024-84040-9. Sci Rep. 2025. PMID: 39994225 Free PMC article.
-
Associations of triglyceride-glucose index and metabolic score for insulin resistance with various hypertension phenotypes in children and adolescents: results from the 2017 China nutrition and health surveillance.Front Endocrinol (Lausanne). 2025 Jul 24;16:1595097. doi: 10.3389/fendo.2025.1595097. eCollection 2025. Front Endocrinol (Lausanne). 2025. PMID: 40778272 Free PMC article.
-
The non-linear relationship between the metabolic score for insulin resistance and three-month outcomes in the individuals with acute ischemic stroke: a prospective Korean cohort study.BMC Neurol. 2025 Jul 5;25(1):280. doi: 10.1186/s12883-025-04299-x. BMC Neurol. 2025. PMID: 40618038 Free PMC article.
References
-
- Forouzanfar MH, Alexander L, Anderson HR, Bachman VF, Biryukov S, Brauer M, et al. . Global, regional, and national comparative risk assessment of 79 behavioral, environmental and occupational, and metabolic risks or clusters of risks in 188 countries, 1990-2013: a systematic analysis for the Global Burden of Disease Study 2013. Lancet. (2015) 386:2287–323. doi: 10.1016/S0140-6736(15)00128-2 - DOI - PMC - PubMed
-
- Global, regional, and national comparative risk assessment of 84 behavioral, environmental and occupational, and metabolic risks or clusters of risks, 1990-2016: a systematic analysis for the Global Burden of Disease Study 2016. Lancet. (2017) 390:1345–422. doi: 10.1016/S0140-6736(17)32366-8 - DOI - PMC - PubMed
-
- Whelton PK, Carey RM, Aronow WS, Casey DJ, Collins KJ, Dennison HC, et al. . 2017 ACC/AHA/AAPA/ABC/ACPM/AGS/APhA/ASH/ASPC/NMA/PCNA guideline for the prevention, detection, evaluation, and management of high blood pressure in adults: A report of the american college of cardiology/american heart association task force on clinical practice guidelines. J Am Coll Cardiol. (2018) 71:e127–248. doi: 10.1016/j.jacc.2017.11.006 - DOI - PubMed
Publication types
MeSH terms
LinkOut - more resources
Full Text Sources
Medical

