[Preprint]. 2024 Jul 9:2024.04.25.591218.
doi: 10.1101/2024.04.25.591218.

Cell Simulation as Cell Segmentation

Affiliations

Cell Simulation as Cell Segmentation

Daniel C Jones et al. bioRxiv. .

Update in

  • Cell simulation as cell segmentation.
    Jones DC, Elz AE, Hadadianpour A, Ryu H, Glass DR, Newell EW. Jones DC, et al. Nat Methods. 2025 Jun;22(6):1331-1342. doi: 10.1038/s41592-025-02697-0. Epub 2025 May 22. Nat Methods. 2025. PMID: 40404994 Free PMC article.

Abstract

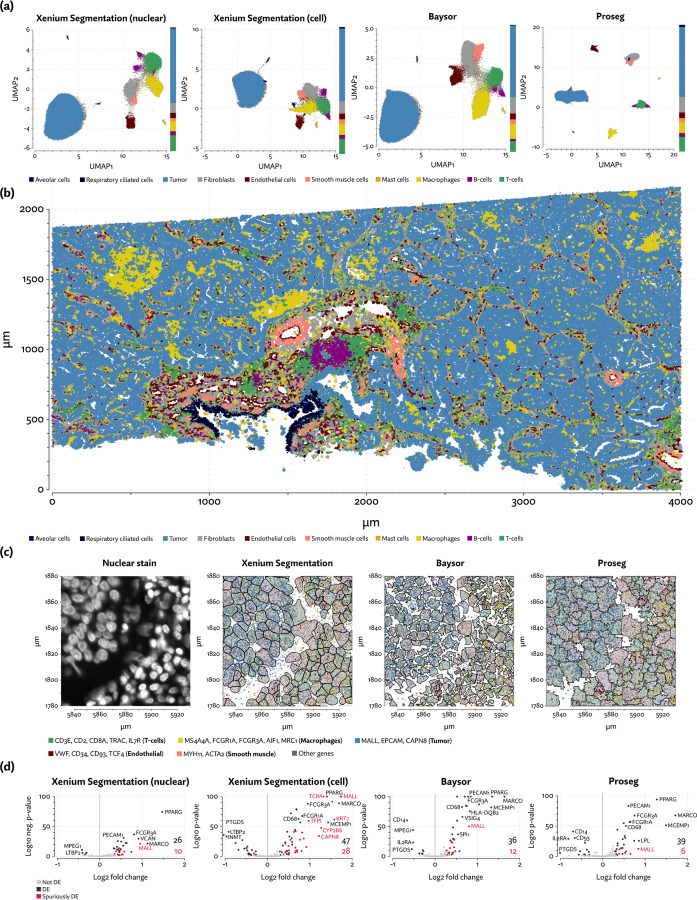
Single-cell spatial transcriptomics promises a highly detailed view of a cell's transcriptional state and microenvironment, yet inaccurate cell segmentation can render this data murky by misattributing large numbers of transcripts to nearby cells or conjuring nonexistent cells. We adopt methods from ab initio cell simulation to rapidly infer morphologically plausible cell boundaries that preserve cell type heterogeneity. Benchmarking applied to datasets generated by three commercial platforms show superior performance and computational efficiency of this approach compared with existing methods. We show that improved accuracy in cell segmentation aids greatly in detection of difficult to accurately segment tumor infiltrating immune cells such as neutrophils and T cells. Lastly, through improvements in our ability to delineate subsets of tumor infiltrating T cells, we show that CXCL13-expressing CD8+ T cells tend to be more closely associated with tumor cells than their CXCL13-negative counterparts in data generated from renal cell carcinoma patient samples.


Conflict of interest statement

6Competing interests E.W.N. is a co-founder, advisor, and shareholder of ImmunoScape and is an advisor for Neogene Therapuetics and Nanostring Technologies. D.C.J. is listed as the inventor in a patent application for methods implemented in Proseg, submitted by Fred Hutchinson Cancer Center.

Figures

Figure 1:
Figure 1:
(a) Cellular Potts models (CPMs) represent cells on a grid of pixels or voxels and repeatedly perturbs cell boundaries to optimize a contrived objecive function. This function can be designed to induce specific behaviors. In the example shown here, cells have higher affinity to those of the same time, and after many iterations of the simulation, migrate and sort themselves (images generated with Morpheus [Starruß et al., 2014]). (b) Proseg (“probabilistic segmentation”) adapts this simulation framework to instead generate cell boundaries that best explain the observed spatial distribution of transcripts, turning a cell simulation methodology into a cell segmentation methodology. In place of a designed objective function a probabilistic model of gene expression is used. In this example, cell boundaries are gradually optimized to explain the distribution of four highly cell type specific genes. (c) Proseg and CPMs operate under the same basic sampling framework, demonstrated here in a section of the MERSCOPE dataset. Cell boundaries are perturbed by copying the label of an adjacent voxel. The change in the objective function is evaluated determining whether the perturbation is accepted or rejected. This basic sampling procedure is iterated until convergence.
Figure 2:
Figure 2:
Benchmarking of competing segmentation methods across four spatial transcriptomics datasets. (a) Spuriously co-expressed gene pairs were defined as those with rates of co-expression that increase dramatically when nuclear boundaries are expanded. Relative spurious co-expression rates were computed as the rate of co-expression of these spurious pairs relative to nuclear segmentation, with lower rates suggestive of higher quality segmentation. (b) Image-based segmentation methods fail to assign large portions of the transcripts compared to transcript-driven methods like Bering, Baysor, and Proseg. (c) Compared to Proseg and image-based segmentation, Baysor predicts dramatically more cells, suggesting systematic over-segmentation, while Bering predicted far fewer cells. Comparisons of memory and runtime on (d) MERSCOPE and (e) CosMx datasets show that Proseg is generally an order of magnitude more efficient that Baysor and competitive with Cellpose.
Figure 3:
Figure 3:
Segmentation results on the MERSCOPE lung cancer dataset. (a) UMAP plots corresponding to each segmentation method. Cell type proportions are shown stacked bar plots on the margins. (b) A comparison of cell segmentation in two regions across three segmentation methods, shown along with specific subsets of highly cell type specific transcripts.
Figure 4:
Figure 4:
Segmentation results on the CosMx lung cancer dataset. (a) UMAP plots with annotated cell types from each segmentation method. Cell type proportions are indicated in stacked bar plots on the margins. (b) A representative example region showing cells segmented by Proseg, along with specific cell type specific sets of transcripts.
Figure 5:
Figure 5:
A comparison of segmentation results on the Xenium lung cancer data. (a) UMAP plots with annotated cell types from each segmentation method. Cell type composition is shown in stacked bar plots on the margins. (b) A region of the sample depicted with annotated cell types using Proseg segmentation. (c) Comparison of cell segmentation in one region, along with specific sets of highly cell type specific transcripts. (d) Differential expression results comparing tumor-adjacent to non tumor-adjacent macrophages. Labeled in red are genes that are highly expressed in tumor, thus likely spuriously called due to transcripts being misattributed to adjacent macrophages.
Figure 6:
Figure 6:
Analysis of the Xenium renal cell carcinoma dataset. (a) UMAP plots for each segmentation method, with cell type proportions shown in stacked bar plots on the margins. (b) Proseg cell segmentation in a region of one tumor sample, plotted along with subsets of cell type specific transcripts. (c) Proximity between various immune cell types and tumor cells is measured by computing the expected number of steps in a random walk on the neighborhood graph before a tumor cell is encountered, and adjusting for the local cell type composition. (d) Numbers of T-cell subtypes and NK-cells in proportion to the number of tumor cells in each tumor. (e) Relative composition of T-cell subtypes and NK-cells.

References

    1. 10X Genomics. Xenium in situ multimodal cell segmentation: Workflow and data highlights. Technical report, March 2024a.
    1. 10X Genomics. Preview data: FFPE human lung cancer with xenium multimodal cell segmentation. https://www.10xgenomics.com/datasets/preview-data-ffpe-human-lung-cancer... February 2024b. Accessed: 2024-2-5.
    1. Beucher S and Meyer F. The morphological approach to segmentation: The watershed transformation. In Mathematical Morphology in Image Processing, pages 433–481. CRC Press, 1992.
    1. Casanova-Acebes María, Dalla Erica, Leader Andrew M, LeBerichel Jessica, Nikolic Jovan, Morales Blanca M, Brown Markus, Chang Christie, Troncoso Leanna, Chen Steven T, Sastre-Perona Ana, Park Matthew D, Tabachnikova Alexandra, Dhainaut Maxime, Hamon Pauline, Maier Barbara, Sawai Catherine M, Agulló-Pascual Esperanza, Schober Markus, Brown Brian D, Reizis Boris, Marron Thomas, Kenigsberg Ephraim, Moussion Christine, Benaroch Philippe, Aguirre-Ghiso Julio A, and Merad Miriam. Tissue-resident macrophages provide a pro-tumorigenic niche to early NSCLC cells. Nature, 595(7868): 578–584, July 2021. - PMC - PubMed
    1. Chen Hao, Li Dongshunyi, and Bar-Joseph Ziv. SCS: cell segmentation for high-resolution spatial transcriptomics. Nat. Methods, July 2023. - PubMed

Publication types