[Preprint]. 2025 May 1:2024.04.01.587519.
doi: 10.1101/2024.04.01.587519.

TLR2 Supports γδ T cell IL-17A Response to ocular surface commensals by Metabolic Reprogramming

Affiliations

TLR2 Supports γδ T cell IL-17A Response to ocular surface commensals by Metabolic Reprogramming

Wenjie Zhu et al. bioRxiv. .

Update in

Abstract

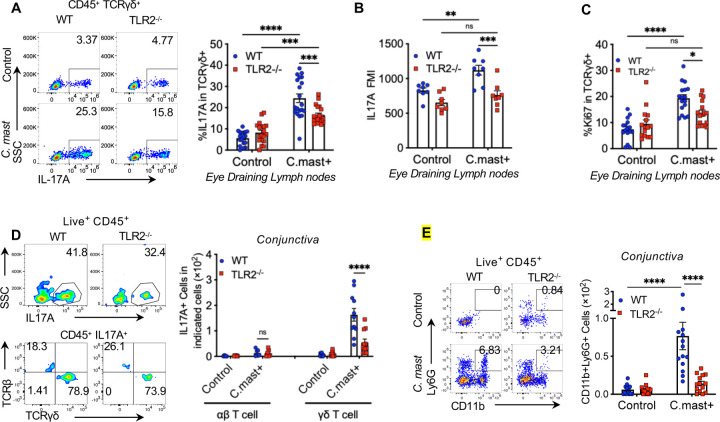
The ocular surface is a mucosal barrier tissue colonized by commensal microbes, which tune local immunity by eliciting IL-17 from conjunctival γδ T cells to prevent pathogenic infection. The commensal Corynebacterium mastitidis (C. mast) elicits protective IL-17 responses from conjunctival Vγ4 T cells through a combination of γδ TCR ligation and IL-1 signaling. Here, we identify Vγ6 T cells as a major C. mast-responsive subset in the conjunctiva and uncover its unique activation requirements. We demonstrate that Vγ6 cells require not only extrinsic (via dendritic cells) but also intrinsic TLR2 stimulation for optimal IL-17A response. Mechanistically, intrinsic TLR2 signaling was associated with epigenetic changes and enhanced expression of genes responsible for metabolic shift to fatty acid oxidation to support Il17a transcription. We identify one key transcription factor, IκBζ, which is upregulated by TLR2 stimulation and is essential for this program. Our study highlights the importance of intrinsic TLR2 signaling in driving metabolic reprogramming and production of IL-17A in microbiome-specific mucosal γδ T cells.

Keywords: FAO; IL-17A; ocular commensal; ΤLR2; γδ Τ cells.


Figures

Figure 1.
Figure 1.. TLR2 is required for IL-17A production in response to C. mast at the ocular surface
C. mast (108 CFU) or PBS was instilled onto each eye every 3 days for a total of 3 treatments. (A) Representative FACS plots and bar graphs showing the percentage of IL17A+ in γδ T cells from eye-draining lymph nodes. N= 20. Combined data from 6 experiments. (B) Bar graphs depict geometric mean fluorescence intensity (MFI) of IL17A in eye-draining lymph node γδ T cells. N= 8. Combined data from 2 experiments (C) The percentage of Ki67+ γδ T cells in eye draining lymph node. N=15–17. Combined data from 5–6 experiments. (D) Representative FACS plots showing the percentage of IL-17A-producing cells (top panels), IL17A+TCRαβ+ cells, and IL-17A+TCRγδ+ cells in the conjunctiva (bottom panels). Bar graphs show the number of conjunctival IL17A+TCRαβ+ cells and IL-17A+TCRγδ+ cells. IL17A+TCRαβ+ cells: data combined from 2 experiments. N= 7. IL-17A+TCRγδ+ cells: data combined from 5 experiments. N=14 per group. (E) Representative FACS plots and bar graphs showing the cell number of conjunctival neutrophils in WT and TLR2−/− mice with/without C. mast inoculation. N=14. Combined data from 5 experiments. (A-E) Bars represent mean ± SEM with *P<0.05, **P<0.01, ***P <0.001, ****P<0.0001. Statistical significance was determined by two-way ANOVA (A-E) .
Figure 2.
Figure 2.. TLR2 expression in γδ T cells is needed for full IL-17A Responses to C. mast
WT or TLR2−/− γδ T cells were sorted by flow cytometry from naive mice and co-cocultured with WT CD11c+ dendritic cells for 72 hours (γδ T cells: 2×10⁴; CD11c+ cells: 1×10⁵ ) with/ without heat-killed C. mast. Supernatants and cells were collected for ELISA or flow cytometry analysis. (A) Representative FACS plots and bar graphs depicting TLR2 expression in CD11b DC, CD11b+ DC, TCRαβ+ and TCRγδ+ cells in the conjunctiva of C57BL/6J WT mice with or without C. mast association. N = 5 per group. Combined data from 2 experiments. (B) Representative FACS plots and bar plots showing the percentage and MFI of IL-17A on γδ T cells from WT or TLR2−/− γδ T cell co-culture system. N= 5. Combined data from 3 experiments. (C-E) Bar graphs presenting the levels of IL-17A (C), IL-1β (D), and IL-23 (E) in the supernatants from WT or TLR2−/− γδ T cell co-culture system. Data was combined from 4 experiments (N= 9) for (C); and 2 experiments (N= 4) for (D-E). (A-E) Bars represent mean ± SEM with *P<0.05, **P<0.01, ***P <0.001, ****P<0.0001. Statistical significance was determined by Welch’s t-test (A) or two-way ANOVA (B-E).
Figure 3.
Figure 3.. TLR2 deficiency in γδ T cells blunts IL-17A and proliferative responses in vivo
A 1:1 mix of CD45 allotype-marked WT and TLR2−/− γδ T cells was infused into TCRδ−/− mice. Cells were collected after 2 weeks for ex vivo analysis after PMA/Ionomycin stimulation. (A) Schematic representation of the γδ T cell adoptive transfer experiment. (B) Representative FACS plots and bar plots showing the ratio of CD45.1+ WT γδ T cells and CD45.2+ TLR2−/− γδ T cells in the eye-draining lymph nodes from host mice 2 weeks after adoptive transfer with/without C. mast inoculation. N= 8. (C) The percentage of IL-17A+ cells and IL-17A expression (MFI) of WT and TLR2−/− γδ T cells in the eye-draining lymph nodes from host mice after adoptive transfer with/without C. mast inoculation. N= 8. (D) The percentage of Ki67+ cells from WT and TLR2−/− γδ T cells from host mice with/without C. mast inoculation. (B-D) N=8. Data were combined from 4 experiments. Bars represent mean ± SEM with *P<0.05, **P<0.01, ***P <0.001. Statistical significance was determined by two-way ANOVA (B-E).
Figure 4.
Figure 4.. TLR2−/− Vγ6 cells exhibit a more profoundly impaired response to C. mast than Vγ4 cells
C. mast ( CFU =108 ) or PBS was instilled into each eye of C57BL/6J wild-type mice( A-C) every 3 days for a total of 3 times. (A)Representative FACS plots and bar graphs representing the number of IL-17A+ Vγ1–Vγ4– γδ T and IL-17A+ Vγ4+ γδ T cells in the conjunctiva of wild-type mice with/without C. mast inoculation. N= 6. Data were combined from 2 experiments. (B)Representative FACS plots showing the percentage of Vγ4+, and Vγ6+ cells among IL-17A producing γδ T cells of eye-draining lymph nodes with C. mast inoculation. The results were representative of 2 independent experiments. (C)The percentage and the number of IL-17+ Vγ6 cells in eye-draining lymph nodes with or without C. mast inoculation. N= 4. (D-F)WT and TCRγ6 KO mice were inoculated with either C. mast (5 ×10⁵ CFU) or PBS every other day for three inoculations. 7 days after final inoculation, the conjunctiva and draining LNs were harvested. (D)Representative FACS plots showing the percentage of Vγ4, Vγ4- γδ TCRlow and Vγ4- γδ TCRhigh γδ T cells in the conjunctiva of indicated mice with/without C. mast inoculation. Dot plots showing the number of conjunctival γδ T cells. Each dot represents one animal. (E)Representative FACS plots and bar graphs showing the percentage and cell number of conjunctival neutrophils in WT and TCRγ6 KO mice with/without C. mast inoculation. Each dot represents one animal. (F) 7 days after the final C. mast association, WT and TCRγ6 KO mice were challenged with P. aeruginosa (1 ×10⁵ CFU/per eye). Twenty-four hours later, the affected eyes were harvested and homogenized in PBS. Bacterial load was determined by serial dilution. (N=8 per group). The results were representative of 2 independent experiments. (G) Representative FACS plots representing TLR2 expression in the indicated γδ Τ cell subset and bar graphs depicting normalized TLR2 mean fluorescein intensity (denoted as Δ MFI) of the indicated γδ subsets in eye draining lymph nodes. N=4. (Δ MFI = averaged MFI of TLR2 in C. mast+ group – Averaged MFI of TLR2 in C. mast– group) (H-I) Kinetic experiment showing cell numbers of IL17A+ Vγ4+ (E) and IL17A+ Vγ6+ (F) from WT and TLR2−/− mice with or without C. mast inoculation on the indicated days. N = 4. (J) Bar plot showing Ki-67 expression of γδ T cells in Vγ4 and Vγ6 subsets in WT and TLR2−/− mice with/without C. mast inoculation. N=17. Combined data from 3 experiments. Bars represent mean ± SEM with *P<0.05, **P<0.01, ***P <0.001, ****P<0.0001. Statistical significance was determined by Welch’s t-test (A,C,F) or two-way ANOVA (D-E, G-J).
Figure 5.
Figure 5.. Compromised IL-17A response in TLR2-deficient Vγ6 cells is due to reduced expression of IκBζ
TLR2−/− or WT mice were associated with C. mast on their ocular surface. (A) RNA-seq was performed on Vγ6 T cells isolated from the indicated mice. The PCA plot shows 4 groups: cells from naïve WT or TLR2−/− mice, and cells from C. mast+ WT or TLR2−/− mice. N= 3 per group. (B) Z scores of selected IL-17 pathway-related genes in WT and TLR2−/− Vγ6 cells from C. mast+ mice. Blue bars represent genes downregulated in TLR2−/− Vγ6 cells. Z scores = (mean gene counts in TLR2−/− C. mast+ group – mean gene counts in WT C. mast+ group)/ SD of corresponding WT C. mast+ group’s counts. (C) ATAC-seq data showing traces, to the same scale, for Il17a genomic region of CD27-CD44high Vγ6 from C. mast+ WT and TLR2−/− mice. N= 2 per group. (D) Bar plots show the reads of nfkbiz (encodes IκBζ) from RNA-seq of Vγ6 cells. N= 3 per group. Vγ1–Vγ4– cells(Vγ6 )were sorted from WT and TLR2−/− mice after C .mast inoculation. The gene expression of nfkbiz in sorted Vγ6 cells was quantified by real-time PCR and normalized to β-actin. N= 4–6 per group. (E) Vγ6 cells were stimulated with ΙL-7 alone (Control) or IL-7 plus TLR2 ligand Pam3CSK4 for 2 days. The expression of Nfkbiz and Il17a was quantified by real-time PCR and normalized to β-actin. Data were combined from 2 experiments. N=4. (F) Vγ6 cells were transfected with pooled CRISPR ribonucleoprotein complexes, targeting different regions of Nfkbiz (sg1 and sg2) or a non-targeting control (NTC) that does not target the mouse reference genomes. Three days later, CRISPR-edited samples stimulated with PAM3CSK4 for one day were evaluated for Il-17a expression by real-time PCR. Data were combined from 2 experiments. N=6. Bars represent mean ± SEM. Significance was determined by Welch’s t-test (D right box-F) or two-way ANOVA (D left box).
Figure 6.
Figure 6.. TLR2 deficient Vγ6 T cells show impaired FAO
γδ cells were collected from secondary lymphoid tissues of TLR2 −/− or WT mice and subjected to transcriptomic or Seahorse metabolic profiling. (A) Differentially expressed genes between C. mast+ WT Vγ6 T cells vs C. mast+ TLR2−/− Vγ6 T cells were subjected to Ingenuity Pathway Analysis. Orange bars represent pathways enriched in C. mast+ WT Vγ6 T cells. Blue bars represent pathways decreased in C. mast+ WT Vγ6 T cells. (B) Histogram and bar graphs showing the expression of mitochondrial membrane potential (MitoCMXros) in Vγ6 cells from WT and TLR2−/− mice with/without C. mast association. N= 8. (C) Measurement of ATP levels in PBS and C. mast-treated Vγ6 cells from WT or TLR2−/− mice. N=3. (D-E) OCR (oxygen consumption rate) assessment of WT and TLR2−/− Vγ6 T cells from C. mast+ Vγ6 transgenic (Tg) mice. Cells were sorted from eye-draining lymph nodes and treated with PMA + Ionomycin for 2h before the OCR measurement. Combined data from 2 independent experiments. The OCR was measured following treatment with Oligomycin (2.5 μM), FCCP(2.5 μM), and Rotenone + antimycin A (1μM). The percentages of basal and maximal OCR after inhibitor injection were calculated and are displayed in panel E. (F-G) A seahorse substrate oxidation stress test was performed in C. mast+ WT and TLR2−/− Vγ6 cells using the inhibitor ETOMOXIR. The percentages of basal and maximal OCR after inhibitor injection were calculated and are displayed in panel G. N= 4. Combined data from 2 independent experiments. Significance was determined by the two-way ANOVA in (B-C, G) or Welch’s t-test (E).
Figure 7.
Figure 7.. Impaired Cpt1 function underlies the defective IL-17A response of TLR2-deficient Vγ6 T cells
(A) UCSC genome browser output depicting ATAC-seq traces for the promoter and enhancer regions (ENCODE cCREs) of Cpt1a loci in CD27-CD44high Vγ6 cells from WT and TLR2−/− mice. (B) Vγ6 cells were sorted from C. mast-Vγ6 Τg mice and stimulated with ΙL-7 alone (Control) or IL-7 + Pam3CSK4 (Pam3CSK4) for one day. Expression of the Cpt1a gene is quantified by real-time PCR and normalized by the β-actin. N=4. (C) Vγ6 cells were stimulated with ΙL-7 alone (Control) or IL-7 plus TLR2 ligand Pam3CSK4 (Pam3CSK4) for 2 days, Εtomoxir (40 μM) was added for the final 12 hours. Expression of Il17a was quantified by real-time PCR and normalized to β-actin. N=4. (D) Vγ6 cells were transfected with pooled CRISPR ribonucleoprotein complexes targeting different regions of Cpt1a, or a non-targeting control (NTC) not targeting mouse reference genomes. Three days later, CRISPR-edited samples were stimulated with Pam3CSK4 for one day and evaluated for Il17a expression by real-time PCR. N=4. Each dot in the graph represents a repeated experiment. (E) Vγ6 cells were transfected with pooled CRISPR ribonucleoprotein complexes targeting different regions of Nfkbiz, or a non-targeting control (NTC) that did not target mouse reference genomes. Three days later, CRISPR-edited samples were stimulated with Pam3CSK4 for one day and evaluated for Cpt1a expression by real-time PCR. N=5. (B-C,E) Representative data of 2 independent experiments. Significance was determined by the Mann-Whitney test (B,E) or two-way ANOVA in (C-D).

References

    1. Li X., Bechara R., Zhao J., McGeachy M.J., and Gaffen S.L. (2019). IL-17 receptor–based signaling and implications for disease. Nature Immunology 20, 1594–1602. 10.1038/s41590-019-0514-y. - DOI - PMC - PubMed
    1. Acosta-Rodriguez E.V., Rivino L., Geginat J., Jarrossay D., Gattorno M., Lanzavecchia A., Sallusto F., and Napolitani G. (2007). Surface phenotype and antigenic specificity of human interleukin 17–producing T helper memory cells. Nature Immunology 8, 639–646. 10.1038/ni1467. - DOI - PubMed
    1. . Zhou L., Ivanov II, Spolski R., Min R., Shenderov K., Egawa T., Levy D.E., Leonard W.J., and Littman D.R. (2007). IL-6 programs T(H)-17 cell differentiation by promoting sequential engagement of the IL-21 and IL-23 pathways. Nat Immunol 8, 967–974. 10.1038/ni1488. - DOI - PubMed
    1. Gomez-Rodriguez J., Wohlfert E.A., Handon R., Meylan F., Wu J.Z., Anderson S.M., Kirby M.R., Belkaid Y., and Schwartzberg P.L. (2014). Itk-mediated integration of T cell receptor and cytokine signaling regulates the balance between Th17 and regulatory T cells. Journal of Experimental Medicine 211, 529–543. 10.1084/jem.20131459. - DOI - PMC - PubMed
    1. Sutton C.E., Lalor S.J., Sweeney C.M., Brereton C.F., Lavelle E.C., and Mills K.H. (2009). Interleukin-1 and IL-23 induce innate IL-17 production from gammadelta T cells, amplifying Th17 responses and autoimmunity. Immunity 31, 331–341. 10.1016/j.immuni.2009.08.001. - DOI - PubMed

Publication types