[Preprint]. 2024 Apr 23:2024.02.21.581471.
doi: 10.1101/2024.02.21.581471.

CYpHER: Catalytic extracellular targeted protein degradation with high potency and durable effect

Affiliations

CYpHER: Catalytic extracellular targeted protein degradation with high potency and durable effect

Zachary R Crook et al. bioRxiv. .

Update in

Abstract

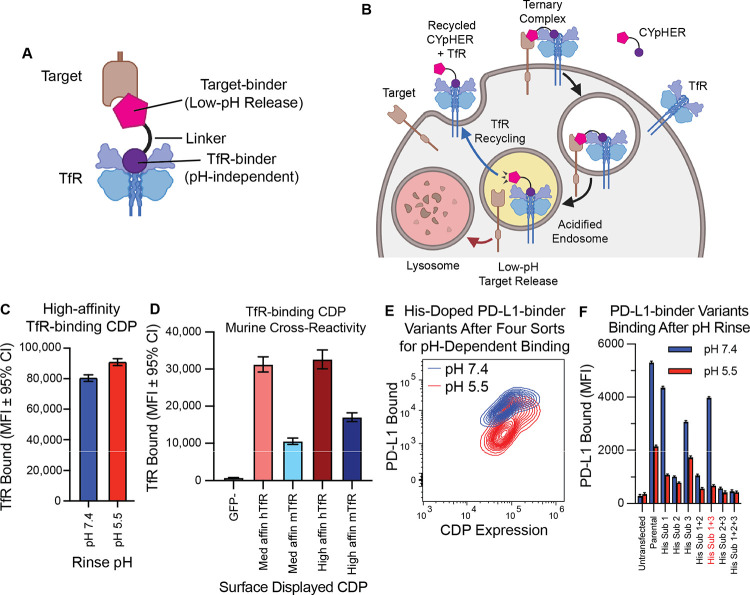
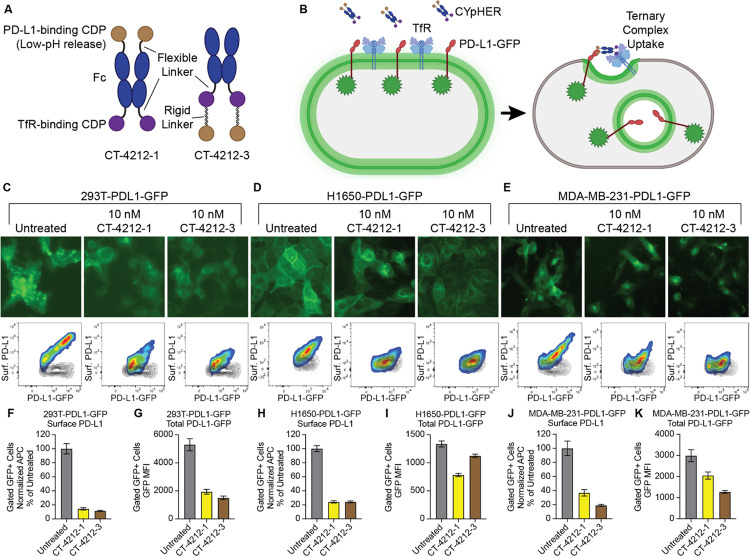
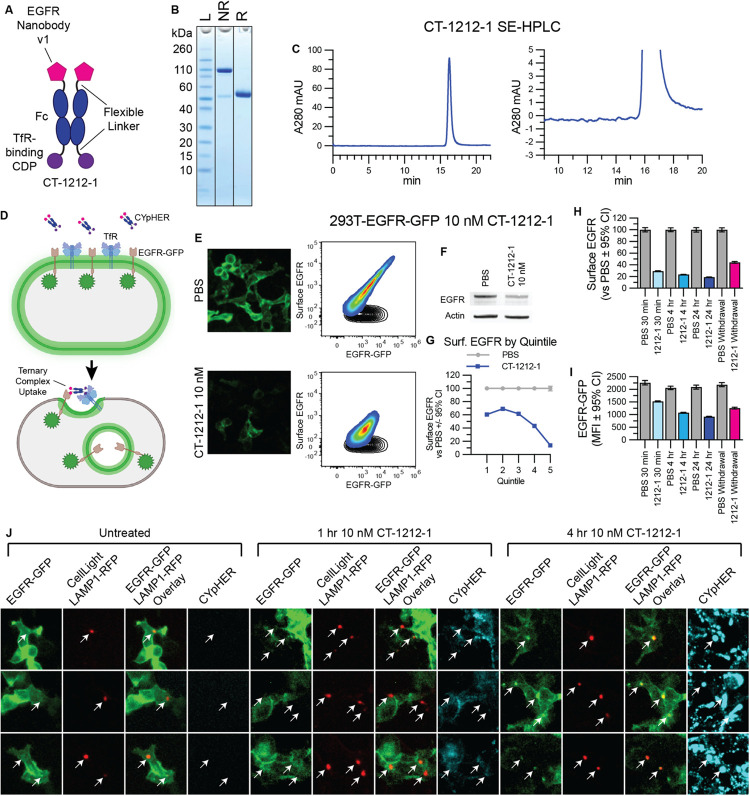
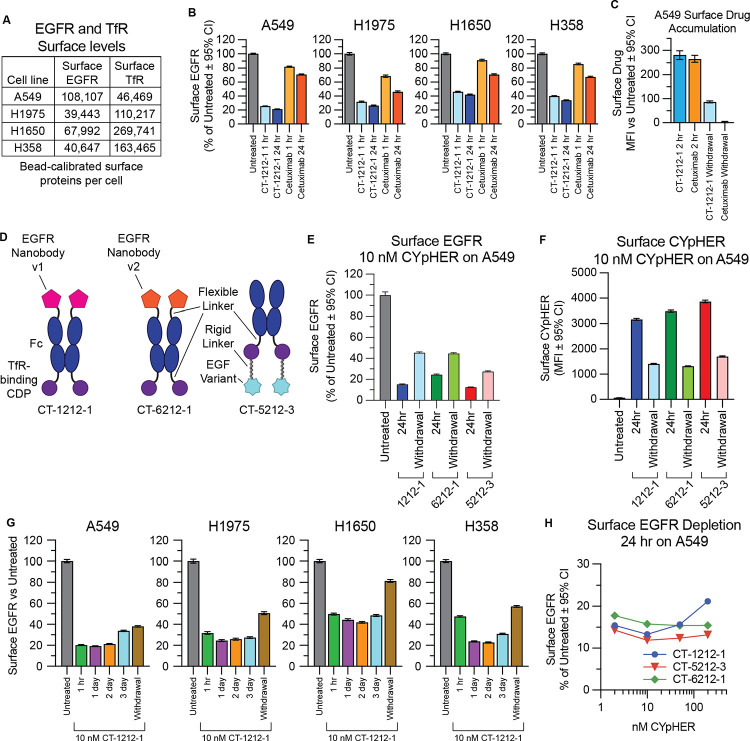
Many disease-causing proteins have multiple pathogenic mechanisms, and conventional inhibitors struggle to reliably disrupt more than one. Targeted protein degradation (TPD) can eliminate the protein, and thus all its functions, by directing a cell's protein turnover machinery towards it. Two established strategies either engage catalytic E3 ligases or drive uptake towards the endolysosomal pathway. Here we describe CYpHER (CatalYtic pH-dependent Endolysosomal delivery with Recycling) technology with potency and durability from a novel catalytic mechanism that shares the specificity and straightforward modular design of endolysosomal uptake. By bestowing pH-dependent release on the target engager and using the rapid-cycling transferrin receptor as the uptake receptor, CYpHER induces endolysosomal target delivery while re-using drug, potentially yielding increased potency and reduced off-target tissue exposure risks. The TfR-based approach allows targeting to tumors that overexpress this receptor and offers the potential for transport to the CNS. CYpHER function was demonstrated in vitro with EGFR and PD-L1, and in vivo with EGFR in a model of EGFR-driven non-small cell lung cancer.


Conflict of interest statement

Competing interests Cyclera Therapeutics Inc. retains intellectual property rights to the technology described in this manuscript. Z.R.C., G.P.S., and N.W.N. own stock in and are employees of Cyclera. J.M.O. owns stock in and is an advisor of Cyclera. Z.R.C., J.M.O., and N.W.N. are inventors on patent applications for this technology. P.Y., E.J.G., T-D.P., M.H., and J.P. have no competing interests.

Figures

Fig. 1.
Fig. 1.. Basic principles of CYpHER and component binders.
(A) CYpHER design including a pH-independent TfR-binding domain and a pH-dependent target-binding domain separated by a linker. (B) CYpHER mechanism. CYpHER induces ternary complex formation with target and TfR. Upon TfR-mediated uptake and endosomal acidification, target is released for endolysosomal system trafficking. TfR and CYpHER recycle to the surface for engagement with another target molecule. (C) 293F cells displaying a high-affinity TfR-binding CDP were stained with TfR and rinsed at pH 7.4 or pH 5.5 for 10 minutes, showing similar binding in both conditions. (D) 293F cells displaying medium or high affinity TfR-binding CDPs were stained with human TfR (hTfR) or mouse TfR (mTfR). (E) pH-dependent PD-L1 binding flow profile of 293F cells displaying a pool of histidine-doped variants of a PD-L1-binding CDP after four rounds of flow sorting; two for high binding after pH 7.4 rinse, two for low binding after pH 5.5 rinse. (F) Three His substitutions were tested as singletons and combinations for PD-L1-binding after 10 minutes pH 7.4 or pH 5.5 rinse. Variant with His substitutions 1 and 3 was chosen for further work.
Fig. 2.
Fig. 2.. PD-L1 CYpHER design and target depletion in cell pools overexpressing PD-L1-GFP.
(A) Two designs of PD-L1 CYpHERs, named CT-4212-1 and CT-4212-3, using a high-affinity TfR-binding CDP and a pH-dependent PD-L1-binding CDP. (B) Illustration of PD-L1-GFP trafficking induced by CYpHER. (C to E) Pools of 293T (C), H1650 (D), and MDA-MB-231 (E) cells transduced with lentivirus driving PD-L1-GFP were untreated or incubated with 10 nM CYpHER for 24 hr before GFP-channel microscopy (above) and flow cytometry (below) after staining for surface PD-L1. Black contour in flow profiles: cells stained without PD-L1 antibody. (F to K) Quantitation of normalized surface PD-L1 (F, H, and J) or total PD-L1-GFP (G, I, and K) signal in 293T-PDL1-GFP (F and G), H1650-PDL1-GFP (H and I), and MDA-MB-231-PDL1-GFP (J and K) cells with or without CYpHER treatment.
Fig. 3.
Fig. 3.. EGFR CYpHER based on VHH nanobody.
(A) CT-1212-1 design. (B) CT-1212-1 SDS-PAGE Coomassie stain. NR: non-reduced. R: DTT-reduced. (C) SE-HPLC of CT-1212-1; right is zoomed. (D) EGFR-GFP trafficking by CYpHER. (E) 293T-EGFR-GFP cells treated 24 hr with PBS or 10 nM CT-1212-1 before either GFP microscopy (left) or flow cytometry after staining for surface EGFR (right). Black contour: unstained cells. (F) 293T-EGFR-GFP cells treated with PBS or 10 nM CT-1212-1 for 24 hr and flow sorted for viable (DAPI-) cells prior to Western blotting. (G) Same cells and treatment as (E), stratified by surface EGFR quintile and normalized. (H and I) 293T-EGFR-GFP cells dosed with PBS or 10 nM CT-1212-1 for 30 min, 4 hr, 24 hr, or 24 hr followed by 24 hr without drug (“Withdrawal”) were flow analyzed for surface EGFR (H) or total EGFR-GFP (I) as in (E). (J) 293T-EGFR-GFP Cells (24 well dish, 500 μL media per well) were treated with 50 μL CellLight Lysosomes-RFP (delivering gene for LAMP1-RFP) for 24 hr, after which they were untreated or treated with 10 nM DyLight 755-labeled CT-1212-1 for 1 or 4 hours and then imaged on the GFP, RFP, and near IR channels. Arrows indicate location of LAMP1-RFP foci (i.e., lysosomes).
Fig. 4.
Fig. 4.. Performance comparison of different EGFR CYpHER designs.
(A) A549, H1975, H1650, and H358 cells were flow analyzed alongside calibration beads to quantitate surface EGFR and TfR protein levels. (B) Normalized surface EGFR levels in the four lines after 1 or 24 hr treatment with 10 nM CT-1212-1 or cetuximab. (C) A549 cells incubated with 10 nM CT-1212-1 or cetuximab for 2 hr or for 2 hr followed by 24 hr without drug (“Withdrawal”) followed by staining for human IgG to quantitate surface drug levels. (D) EGFR CYpHER designs. (E) Surface EGFR levels in A549 cells incubated with 10 nM CYpHER for 24 hr or for 24 hr followed by 24 hr without CYpHER (“Withdrawal”). (F) Same treatment as (E) but staining for human Fc to quantitate surface CYpHER levels. (G) A549, H1975, H1650, and H358 cells untreated or treated with 10 nM CT-1212-1 for 1 hr, 1 day, 2 days, 3 days, or 1 day followed by 1 day without drug (“Withdrawal”) and then analyzed by flow cytometry for surface EGFR levels. (H) A549 cells treated for 24 hr with 2 nM, 10 nM, 50 nM, or 200 nM CYpHER and then analyzed by flow cytometry for surface EGFR levels.
Fig. 5.
Fig. 5.. EGFR trafficking upon CYpHER treatment.
(A) Designs of various EGFR CYpHERs and control molecules. (B) A549-EGFR-GFP (knockin) cells treated with PBS or 10 nM CYpHER for either 48 hr with drug, or for 24 hr with followed by 24 hr without drug (“Withdrawal”) and imaged for GFP localization. (C) A549-EGFR-GFP cells imaged for GFP localization after 24 hr treatment with 10 nM CYpHER (CT-1212-1) or control molecule (CT-1232-1 or CT-3212-1). (D) A549-EGFR-GFP cells imaged for GFP localization after 20 min treatment with PBS or 10 nM CT-1212-1. (E) A549-EGFR-GFP cells treated without or with 10 μM human holoTF for 15 mins followed by addition of PBS or 10 nM CT-1212-1 for 4 hr and imaged for GFP localization. (F) Same experimental design as in (E) except altered amount of holoTF and analyzed by flow cytometry for surface EGFR. Dashed lines indicate quantitation of surface EGFR in untreated cells (upper) or cells treated with 10 nM CT-1212-1 but no holoTF (lower).
Fig. 6.
Fig. 6.. Catalytic soluble cargo uptake by CYpHER.
(A) Experimental design to quantitate fluorescent soluble cargo uptake in cells pre-treated with cargo-saturated CYpHER. Step 1: CYpHER is saturated with target (2:1 target:binding moiety ratio), then applied to cells for 2 hr. Step 2: After cells are thoroughly rinsed, new fluorescently-labeled soluble target is added to cells. Fluorescence accumulation is increased by CYpHER pre-treatment. (B) Designs and elements of CYpHERs used. (C) Soluble EGFRvIII uptake after 24 hr incubation with A549, H1650, H1975, or H358 cells either untreated (to quantitate passive uptake) or pre-treated for 2 hr with unlabeled-EGFR-saturated 10 nM CT-1212-1, normalized to each cell line’s untreated uptake levels. (D) Soluble EGFRvIII uptake in H1975 cells as in (C) comparing CT-1212-1, CT-6212-1, and CT-5212-3. (E) Soluble PD-L1 uptake as in (C) except with soluble PD-L1 as cargo, comparing CT-4212-1 and CT-4212-3 in MDA-MB-231 (left) or H1650 (right) cells.
Fig. 7.
Fig. 7.. Pharmacodynamic effects of CYpHER.
(A) Designs of various EGFR CYpHERs and control molecules. (B and C) A549 cells (unsorted, thus including live and dead cells) treated for 24 hr with PBS, 10 nM CYpHER, or 10 nM control molecule followed by no treatment (“–”, EGFR, Actin) or addition of 50 ng/mL EGF for 30 min (“+”) and analyzed by Western blot for pY1068 EGFR (“−” and “+”), total EGFR, or actin. (D to H) Triplicate 96 well plate growth for 4 days (A431) or 7 days (all others) with single dose (no media exchange) of CT-1212-1, cetuximab, gefitinib, or osimertinib in A431 (D), H1975 (E), H1650 (F), A549 (G), and H358 (H) cells. After treatment, cell levels per well were quantitated by CellTiter-Glo 2.0 assay. (I) EC50 values of the experiments in (D to H) from asymmetric sigmoidal (5PL) curve fit. Empty “X” box indicates no effect, as defined by failure to suppress growth by 20% at any dose tested.
Fig. 8.
Fig. 8.. Pharmacokinetics and pharmacodynamics of CYpHER in mice.
(A) Designs of various EGFR CYpHERs and control molecules. (B) NCr nu/nu mice were dosed with 1.5 mg/kg CT-1212-1, CT-1211-1, CT-1222-1, or CT-1232-1 IV. Serum samples were taken after 10 min, 30 min, 1 hr, 2 hr, 4 hr, 8 hr, 24 hr, 48 hr, 96 hr, or 168 hr. Three mice per time point were analyzed. Serum samples were quantitated by ELISA for human Fc domain in technical triplicate. Molecules exhibited a normal biphasic distribution curve, and as such, PK parameters were determined by non-compartmental analysis for IV bolus dosing using PKSolver 2.0. (C) Experimental design for tumor implantation and dosing. Female athymic nude mice (Foxn1nu) were implanted (subcutaneous flank) with 5×10⁶ H1975 cells. After 21 days, mice were enrolled and dosed IV on days 0 (enrollment day), 3, and 7. On day 8, tumors from three mice per dosage group were harvested and split in half for Western blot lysis or for histology. (D) Western blot analysis of total EGFR and actin. (E) Quantitation of the blots from (D). (F) IHC (hematoxylin/DAB) for total EGFR (top) and Ki67 (bottom) in vehicle, CT-1212-1 450 μg, and CT-1222-1 150 μg groups. Full EGFR fields can be found in fig. S7. (G) Quantitation of Ki67 positivity, derived from 6–9 regions of interest (ROI) per tumor, three tumors per group, pooled for analysis. *: P < 0.01 vs vehicle.

References

    1. Chang M. T., Shanahan F., Nguyen T. T. T., Staben S. T., Gazzard L., Yamazoe S., Wertz I. E., Piskol R., Yang Y. A., Modrusan Z., Haley B., Evangelista M., Malek S., Foster S. A., Ye X., Identifying transcriptional programs underlying cancer drug response with TraCe-seq. Nat Biotechnol 40, 86–93 (2022). - PubMed
    1. Dai W., Li Y., Zhou Q., Xu Z., Sun C., Tan X., Lu L., Cetuximab inhibits oral squamous cell carcinoma invasion and metastasis via degradation of epidermal growth factor receptor. J Oral Pathology Medicine 43, 250–257 (2014). - PubMed
    1. Lu Y., Li X., Liang K., Luwor R., Siddik Z. H., Mills G. B., Mendelsohn J., Fan Z., Epidermal Growth Factor Receptor (EGFR) Ubiquitination as a Mechanism of Acquired Resistance Escaping Treatment by the Anti-EGFR Monoclonal Antibody Cetuximab. Cancer Research 67, 8240–8247 (2007). - PubMed
    1. Du Z., Lovly C. M., Mechanisms of receptor tyrosine kinase activation in cancer. Mol Cancer 17, 58 (2018). - PMC - PubMed
    1. Abourehab M. A. S., Alqahtani A. M., Youssif B. G. M., Gouda A. M., Globally Approved EGFR Inhibitors: Insights into Their Syntheses, Target Kinases, Biological Activities, Receptor Interactions, and Metabolism. Molecules 26, 6677 (2021). - PMC - PubMed

Publication types