[Preprint]. 2024 Apr 23:2023.06.25.546449.
doi: 10.1101/2023.06.25.546449.

A mitochondrial surveillance mechanism activated by SRSF2 mutations in hematologic malignancies

Affiliations

A mitochondrial surveillance mechanism activated by SRSF2 mutations in hematologic malignancies

Xiaolei Liu et al. bioRxiv. .

Update in

Abstract

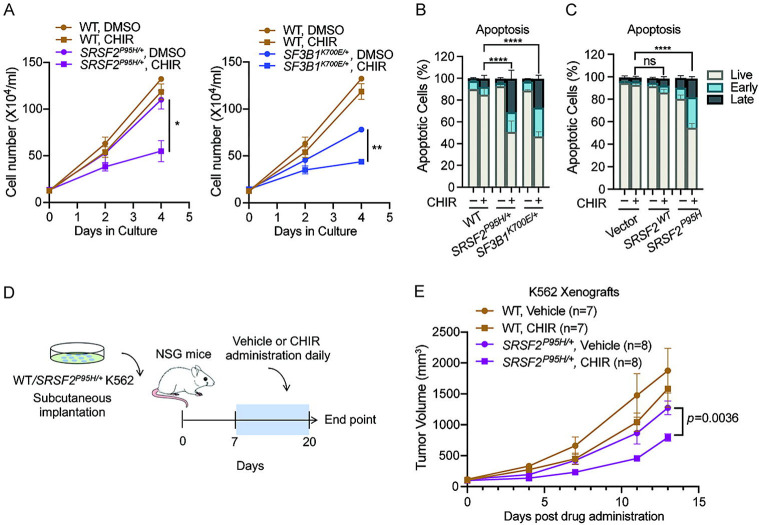
Splicing factor mutations are common in myelodysplastic syndrome (MDS) and acute myeloid leukemia (AML), but how they alter cellular functions is unclear. We show that the pathogenic SRSF2P95H/+ mutation disrupts the splicing of mitochondrial mRNAs, impairs mitochondrial complex I function, and robustly increases mitophagy. We also identified a mitochondrial surveillance mechanism by which mitochondrial dysfunction modifies splicing of the mitophagy activator PINK1 to remove a poison intron, increasing the stability and abundance of PINK1 mRNA and protein. SRSF2P95H-induced mitochondrial dysfunction increased PINK1 expression through this mechanism, which is essential for survival of SRSF2P95H/+ cells. Inhibition of splicing with a glycogen synthase kinase 3 inhibitor promoted retention of the poison intron, impairing mitophagy and activating apoptosis in SRSF2P95H/+ cells. These data reveal a homeostatic mechanism for sensing mitochondrial stress through PINK1 splicing and identify increased mitophagy as a disease marker and a therapeutic vulnerability in SRSF2P95H mutant MDS and AML.


Conflict of interest statement

Conflict of Interest Statement: PSK is collaborating with Blueprint Medicines under a sponsored research agreement unrelated to the current manuscript. OA-W has served as a consultant for H3B Biomedicine, Foundation Medicine Inc, Merck, Prelude Therapeutics, and Janssen, and is on the Scientific Advisory Board of Envisagenics Inc, AIChemy, Harmonic Discovery Inc, and Pfizer Boulder; OA-W has received prior research funding from H3B Biomedicine, Nurix Therapeutics, Minovia Therapeutics, and LOXO Oncology unrelated to the current manuscript. DCW is on the Scientific Advisory Boards of Pano Therapeutics and Medical Excellence Capital.

Figures

Figure 1.
Figure 1.. Preferential cytotoxicity of GSK-3i in SF-mutant leukemia over WT counterparts
(A) WT, SRSF2P95H/+ and SF3B1K700E/+ cells were cultured with DMSO or 3uM CHIR, and cell numbers were counted at 2 d and 4 d (mean ± SD). (B) Percentages of viable, early-, and late-apoptotic cells based on 7-AAD and Annexin V flow cytometric analysis of isogenic K562 WT, SRSF2P95H/+ and SF3B1K700E/+ cells treated with DMSO or 3uM CHIR in vitro for 4 d (mean ± SD). Statistical analysis of viable fraction in mutant cells treated with CHIR relative to WT counterparts was performed using a two-tailed Chi-squared test. **** p < 0.0001. (C) Percentages of viable, early-, and late-apoptotic cells of K562 parental, SRSF2wt-, or SRSF2P95H-overexprssing cells treated with vehicle or 3uM CHIR in vitro for 4 d (mean ± SD). Statistical analysis of viable fraction in SRSF2P95H-overexpressing cells treated with CHIR relative to SRSF2wt conterparts was performed using a two-tailed Chi-squared test. **** p < 0.0001. (D) Schematic of in vivo K562 xenograft experiment. (E) Mean tumor volume in NSG mice subcutaneously implanted with K562 isogenic WT or SRSF2P95H/+ cells. Mice received subcutaneous injections of vehicle or CHIR (30mg/kg) daily. Mean tumor volumes ± SEM are shown. For data in A, and E, *p < 0.05 and **p < 0.01 (2-way ANOVA with Sidak’s multiple comparisons test).
Figure 2.
Figure 2.. Selective cytotoxicity of GSK-3i in primary human leukemia cells with SF mutations
(A) CHIR induced higher levels of apoptosis in splicing factor mutant (mut) cells from patients with CMML (red) or AML (purple) compared to patients with wt splicing factors or CD34+ cells from healthy donors (black). Log2[fold change] in apoptosis in CHIR relative to DMSO treated is shown. Genetic information for each patient is shown in Data file S1. Statistical analysis was performed using a two-tailed Mann Whitney test. (B) Schematic of lentivirus infection in primary AML cells for apoptosis assay. (C) Primary AML cells from 3 patients were transduced with lentivirus encoding WT or mutant SRSF2 as in panel B and cultured in the absence or presence of 3uM CHIR (blue box indicates duration of drug treatment). The percentage of mCherry+ cells normalized to the number at day 3 (patients 1 and 2) or day 4 (patient 3) is shown. (D) Representative flow cytometric analysis (left) and quantification (right) of apoptosis in primary cells from patients with AML overexpressing either SRSF2+ or SRSF2P95H, as measured by Annexin V and 7-AAD staining in absence or presence of 3uM CHIR. Data in C and D are presented as mean ± SD; **p < 0.01 and ****p < 0.0001 (2-way ANOVA with Sidak’s multiple comparisons test).
Figure 3.
Figure 3.. GSK-3i is associated with global alterations in gene expression and splicing in human leukemic cells
(A) Schematic of deep RNA-Seq in WT, SRSF2P95H/+ and SF3B1K700E/+ K562 cells treated with DMSO or 3uM CHIR for 24 h. (B) Bar graphs show numbers of differential splicing events (FDR<0.05, dPSI>10%) in WT, SRSF2P95H/+ and SF3B1K700E/+ K562 cells treated with CHIR versus DMSO controls. A3SS, alternative 3’ splice site; A5SS, alternative 5’ splice site; MXE, mutually exclusive exon; RI, retained intron; SE, skipped exon. (C) Venn diagram showing the number of overlapping alternatively spliced genes between CHIR and DMSO in WT, SRSF2P95H/+ and SF3B1K700E/+ K562 cells. (D) Heat map of PSI values for overlapping alternatively spliced genes comparing CHIR and DMSO in WT, SRSF2P95H/+ and SF3B1K700E/+ K562 cells. (E) Scatterplots of cassette exon inclusion in WT, SRSF2P95H/+ and SF3B1K700E/+ K562 cells treated with 3uM CHIR relative to DMSO treated controls. Numbers in brown (left) and purple (right) indicate number of cassette exons whose inclusion is repressed or promoted, respectively, in CHIR treated relative to DMSO treated cells. p values were determined by 1-way ANOVA with Sidak’s multiple comparisons test. (F) Bar graphs show numbers of alternative 3’ splice site events upon CHIR treatment compared to DMSO in WT, SRSF2P95H/+ and SF3B1K700E/+ K562 cells. Purple and orange indicate intron-proximal 3’ splice sites whose usage is repressed or enhanced, respectively, in CHIR treated relative to DMSO treated cells. (G) Sashimi plots of DEPDC1 in WT and SRSF2P95H/+ cells treated with DMSO or CHIR (left). Bar plots shows quantification of percentage of exon inclusion based on rMATS analysis (top right) and on isoform specific qPCR validation (bottom right). Percentage of exon inclusion was quantified by RT-qPCR analysis of mRNA levels containing the cassette exons normalized to total mRNA levels. Data are presented as the mean ± SD. p values were determined by 2-way ANOVA with Sidak’s multiple comparisons test. ns: not significant.
Figure 4.
Figure 4.. GSK-3 regulates PINK1 splicing
(A) Venn diagram of genes differentially expressed (blue) or differentially spliced (green) in CHIR-treated WT, SRSF2P95H/+ and SF3B1K700E/+ K562 cells relative to DMSO-treated controls. (B) Sashimi plots of PINK1 in WT, SRSF2P95H/+ and SF3B1K700E/+ cells treated with DMSO or CHIR (left). Bar graph shows intron 6 retention as a percentage of total transcripts (right). (C) PINK1 mRNA levels in WT, SRSF2P95H/+ and SF3B1K700E/+ cells treated with DMSO or 3uM CHIR for 24 h detected by RT-qPCR using primers that span exons 1 and 2 (mean ± SD). For data in B and C, * p < 0.05, ** p < 0.01, *** p < 0.001, and ****p<0.0001 (2-way ANOVA with Sidak’s multiple comparisons test). (D) PINK1 nascent transcript detection by RT-qPCR using primers for intron 1 (left) and intron 5 (right) in WT, SRSF2P95H/+ and SF3B1K700E/+ cells treated with DMSO or 3uM CHIR for 24 h. (E-F) Representative RT-PCR with primers spanning exon 6 (E6), intron 6 (I6), and exon 7 (E7) of PINK1 in WT, SRSF2P95H/+, SF3B1K700E/+ K562 cells (E) and in CD34+ cells from healthy donors, primary AML cells, and CD34+ cells from CMML patients (F) treated with DMSO or 3uM CHIR for 24h. M: DNA marker. PCR product with retained intron 6 is 568bp and product for spliced exon6–7 (without retained intron) is 206bp. (G) RT-PCR analysis of PINK1 splicing in WT, GSK3A/B DKO, and GSK3A/B DKO cells overexpressing GSK-3β (HEK293T). (H) UPF1 mRNA levels detected in K562 cells transduced with lentivirus expressing shRNA against UPF1 compared to non-targeting control (left), and levels of intron-retained and -spliced PINK1 mRNAs following UPF1 knockdown compared to control measured by RT-PCR (right). Data are presented as mean ± SD. p value was determined by Student’s t test.
Figure 5.
Figure 5.. SRSF2P95H increases PINK1 expression and mitophagy
(A) Heat map shows z-scored expression of mitophagy related genes in WT and SRSF2P95H/+ K562 cells. (B) Representative confocal images of mitochondria (green, TOMM20+) and lysosomes (red, LAMP1+) in K562 WT, or SRSF2P95H/+ cells treated with DMSO or 3uM CHIR for 2d (left). Scale bar, 10 μm. Bar plot shows quantification of the co-localization of mitochondria with lysosomes (n=5 fields for each group. N=3). (C) Representative TEM images of WT and SRSF2P95H/+ K562 cells treated with DMSO or 3μM CHIR for 2d (left). Scale bar, 0.5 μm. Bar plot (right) shows quantification of the number of autophagic vacuoles per cell. Each circle represents one cell. (D) Bar graph shows mitophagic flux determined by mito-tracker green (MTG) staining in WT and SRSF2P95H/+ K562 treated with or without 2uM CHIR for 48h. Mitochondrial net flux was calculated by mitochondrial accumulation in the presence of 100uM Chloroquine (CQ) or 50uM Lys05 for 4h (31). Data are presented as the mean ± SD. * p<0.05, ** p<0.01, *** p<0.001, **** p<0.0001, by 2-way ANOVA with Sidak’s multiple comparisons test (B-D). (E) Immunoblotting of PINK1 and β-catenin in WT and SRSF2P95H/+ cells treated with DMSO or 3 uM CHIR for indicated times. (F) Violin plot of OPTN, and TOMM7 normalized expression in AML patients in the TCGA dataset (n = 581) with or without mutations in SRSF2. Statistical analysis was performed using two-tailed Mann-Whitney test.
Figure 6.
Figure 6.. The SRSF2 mutation is associated with accumulation of defective mitochondria
(A) Bubble plot for gene ontology enrichment analysis of differentially spliced genes in SRSF2 mutant cells versus WT K562 cells. The y-axis shows the number of genes, whereas the x-axis denotes −log(q-value). The size of each circle represents the −logP value. (B) Bar graph for gene ontology enrichment analysis of differentially spliced genes in SRSF2 mutant cells versus SRSF2+/+ primary CMML and AML patient samples shows significantly dysregulated pathway that is associated with mitochondrion organization, with Fisher’s exact test −log[q-value] on X-axis. (C) Venn diagram showing overlap of proteins differentially expressed in SRSF2P95H/+ versus WT K562 cells and MitoCarta 3.0 database. (D) Bar graph shows Log2 ratio of selected mitochondrial protein in SRSF2P95H/+ vs. SRSF2+/+ K562 cells. (E-H) Quantification of mitochondrial parameters in WT and SRSF2P95H/+ cells (mean ± SD). E, MTG. F, Mitochondrial DNA copy number. Data are shown as ratio of mitochondrial DNA (mt-ND1) to nuclear DNA (B2M) in wt and SRSF2P95H/+ cells. G, MMP per mitochondrion. H, mitochondrial reactive oxygen species (mtROS). (I) Basal, maximal, and complex I-linked mitochondrial respiratory capacity was measured in WT and SRSF2P95H/+ cells. Maximal respiratory capacity was measured after FCCP injection. Complex I-linked respiration was measured by sequential addition of the complex I-linked substrates pyruvate, malate, and glutamate (P/M/G) and ADP. Oxygen flux expressed as respiration per million cells [pmol/(s·106 cells], mean ± SD of N = 3 independent cultures. Each sample was measured in duplicate. p values were determined by Student’s t test (E-I). (J) Analysis of mitochondrial depolarization in WT and SRSF2P95H/+ cells treated with DMSO or 2μM CCCP for 24h using JC-1 staining, in which a high Red+:Green+ ratio indicates high MMP (n=3). Statistical analysis was performed using a two-tailed Chi-squared test. (K) Representive RT-PCR results of PINK1 splicing in WT and SRSF2P95H/+ cells treated with DMSO, 3μM CHIR or indicated concentrations of CCCP for 24h. (L) RT-qPCR analysis of PINK1 mRNA levels in WT and SRSF2P95H/+ cells treated with DMSO, 3μM CHIR, or 2μM CCCP for 24 h (mean ± SD). **p < 0.01, ***p < 0.001, and ****p < 0.0001 (2-way ANOVA with Sidak’s multiple comparisons test).
Figure 7.
Figure 7.. Targeting mitophagy in SRSF2 mutant hematologic malignancies
(A-B) Quantification of mitochondrial parameters in WT and SRSF2P95H/+ cells treated with DMSO or 3μM CHIR. A, MMP per mitochondrion. B, MTG. (C) GSEA showing mitochondrial related enrichment plots for CHIR versus DMSO treated WT and SRSF2P95H/+ cells. (D) Schematic of generating WT and SRSF2P95H/+ stable lines overexpressing PINK1 for apoptosis assay with or without CHIR. (E) Percentages of viable, early-, and late-apoptotic cells in PINK1 overexpressing WT and SRSF2P95H/+cells treated with DMSO or 3μM CHIR in vitro for 8d. (F) Quantification of mitochondrial mass by MTG staining in WT and SRSF2P95H/+ cells treated with vehicle or indicated concentrations of CQ for 6d. (G-H) Percentage of viable cells based on 7-AAD and Annexin V flow cytometric analysis of WT and SRSF2P95H/+ cells treated with vehicle, 20μM CQ (G), or 2uM Lys05 (H) in vitro. (I) Schematic representation of lentiviral delivery of SRSF2wt or SRSF2P95H to primary AML cells for Chloroquine and Lys05 treatment followed by apoptosis assay. (J-K) Representative flow cytometric analysis (left) and quantification (right) of apoptosis in primary cells from patient with AML overexpressing either WT or SRSF2P95H, as measured by Annexin V and 7-AAD staining in absence or presence of 15μM Chloroquine (J) or 2uM Lys05 (K) for 4d. Data in A, B, F, G and H are presented as the mean ± SD. *p < 0.05, ** p < 0.01, *** p < 0.001, and **** p < 0.0001 (2-way ANOVA with Sidak’s multiple comparisons test). For data in E, J, and K, statistical analysis was performed using a two-tailed Chi-squared test.
Figure 8.
Figure 8.. Proposed model
for dependency of SRSF2 mutant leukemias on PINK1-mediated mitophagy and preferential cytotoxicity of GSK-3i and mitophagy inhibitor Chloroquine and Lys05.

References

    1. Kim YJ, and Abdel-Wahab O. Therapeutic targeting of RNA splicing in myelodysplasia. Semin Hematol. 2017;54(3):167–73. - PubMed
    1. Dvinge H, Kim E, Abdel-Wahab O, and Bradley RK. RNA splicing factors as oncoproteins and tumour suppressors. Nature reviews Cancer. 2016;16(7):413–30. - PMC - PubMed
    1. Yoshida K, Sanada M, Shiraishi Y, Nowak D, Nagata Y, Yamamoto R, et al. Frequent pathway mutations of splicing machinery in myelodysplasia. Nature. 2011;478(7367):64–9. - PubMed
    1. Papaemmanuil E, Cazzola M, Boultwood J, Malcovati L, Vyas P, Bowen D, et al. Somatic SF3B1 mutation in myelodysplasia with ring sideroblasts. The New England journal of medicine. 2011;365(15):1384–95. - PMC - PubMed
    1. Graubert TA, Shen D, Ding L, Okeyo-Owuor T, Lunn CL, Shao J, et al. Recurrent mutations in the U2AF1 splicing factor in myelodysplastic syndromes. Nature genetics. 2011;44(1):53–7. - PMC - PubMed

Publication types