. 2024 May 7:13:e83712.
doi: 10.7554/eLife.83712.

CYRI-B-mediated macropinocytosis drives metastasis via lysophosphatidic acid receptor uptake

Affiliations

CYRI-B-mediated macropinocytosis drives metastasis via lysophosphatidic acid receptor uptake

Savvas Nikolaou et al. Elife. .

Abstract

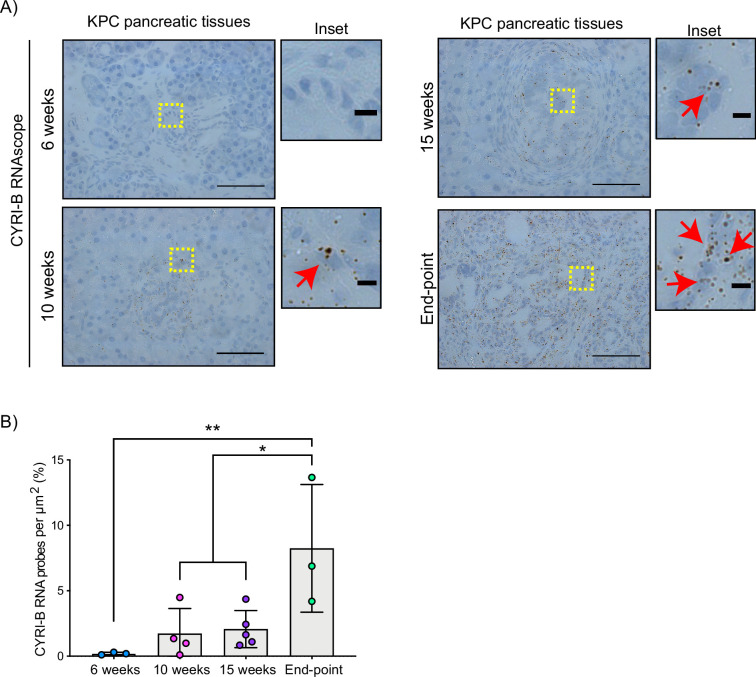
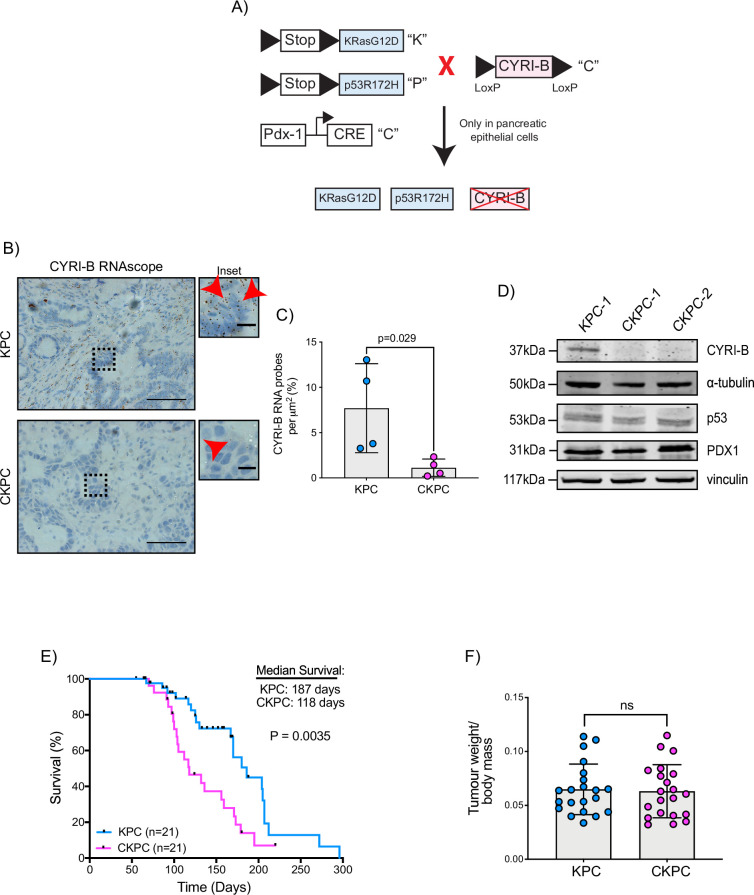
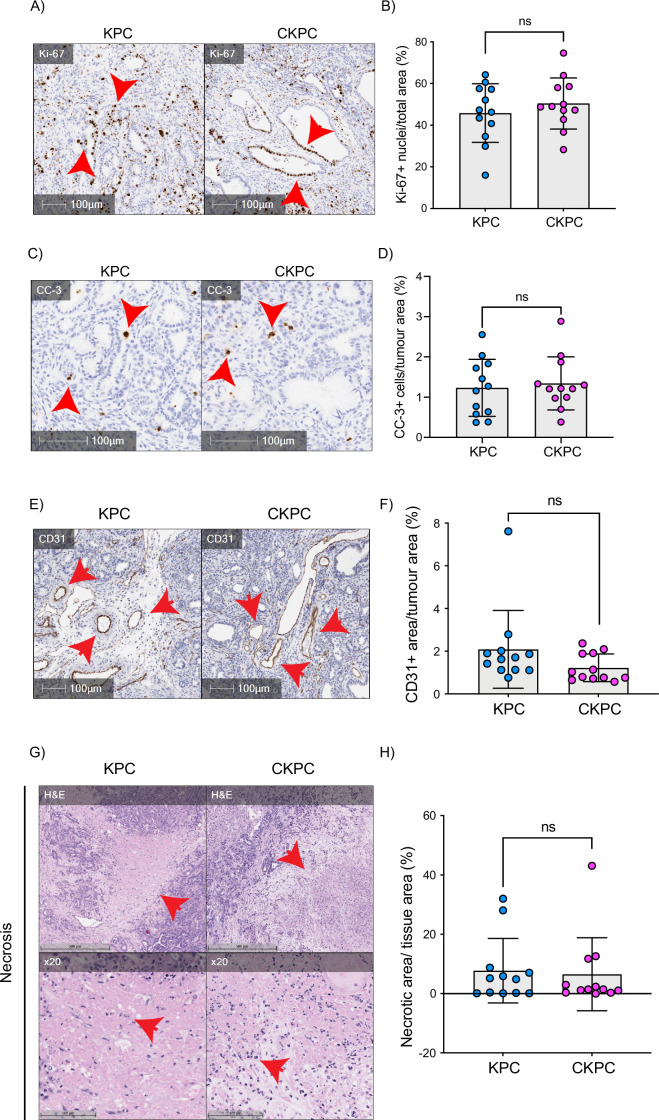
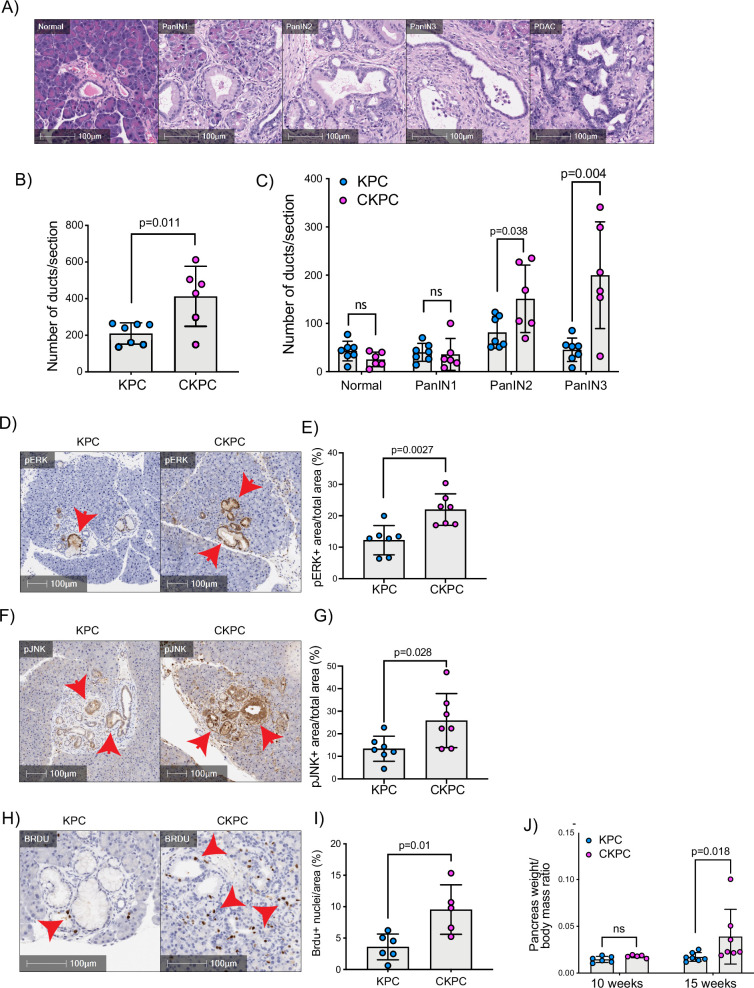
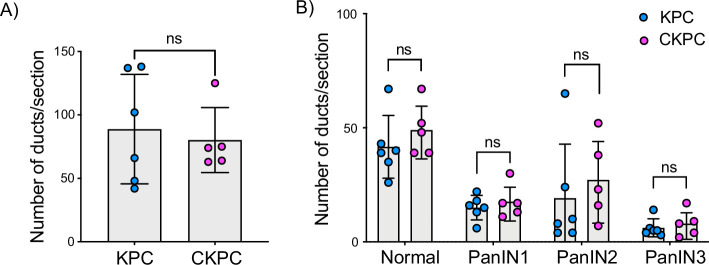
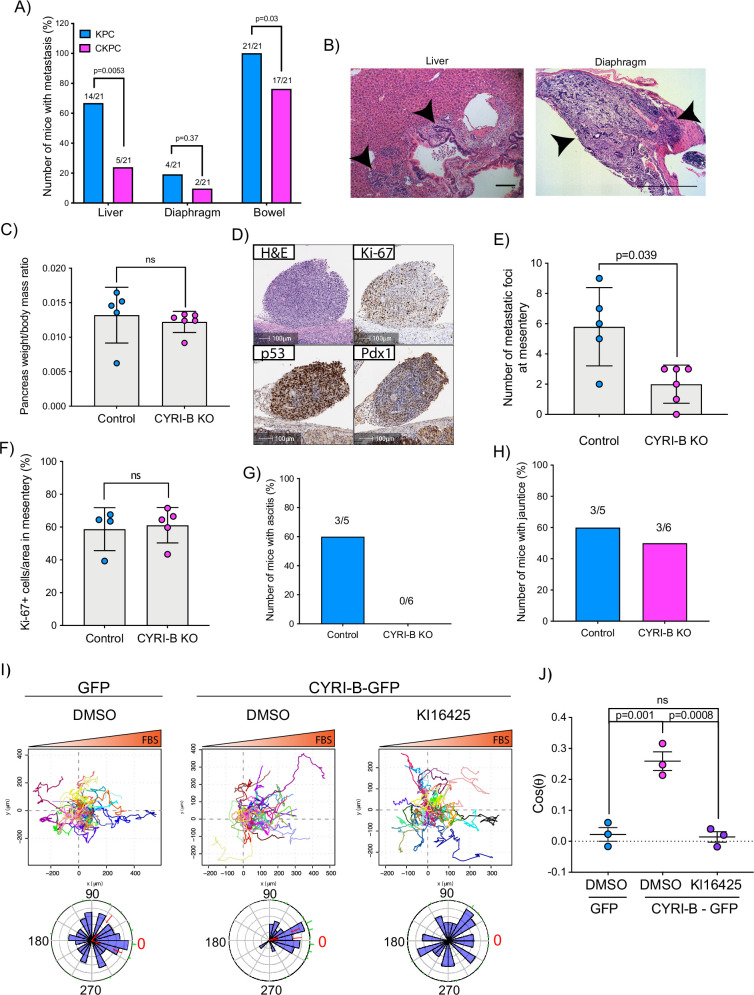
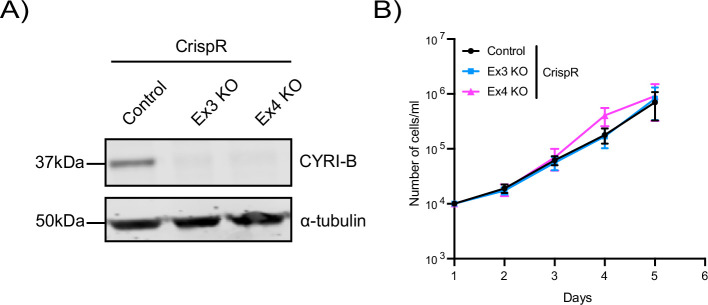
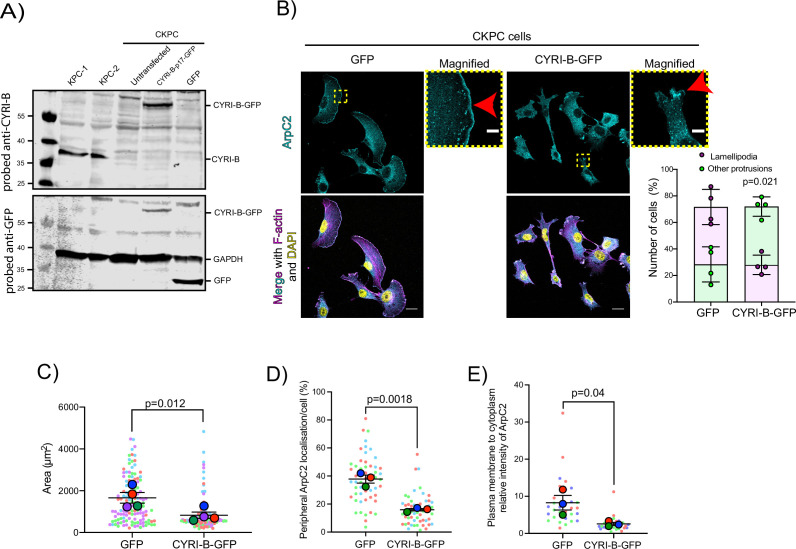
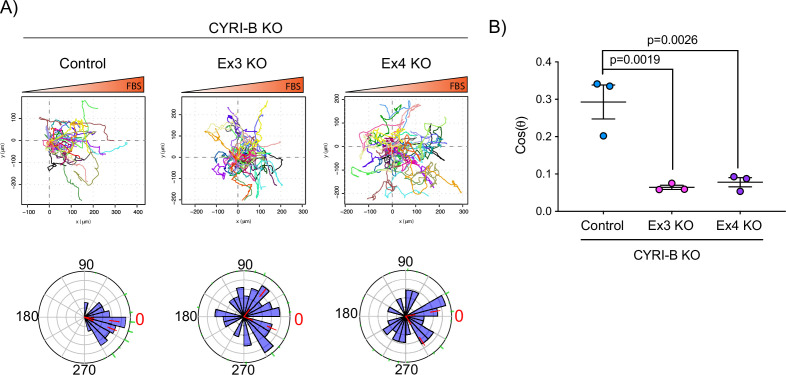
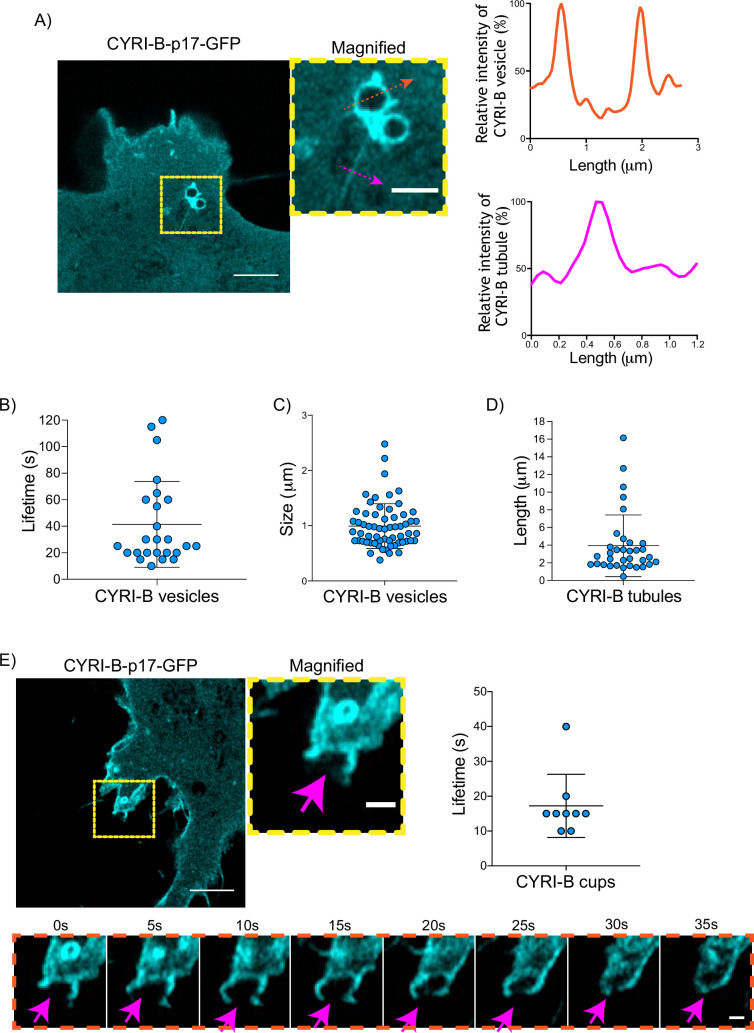
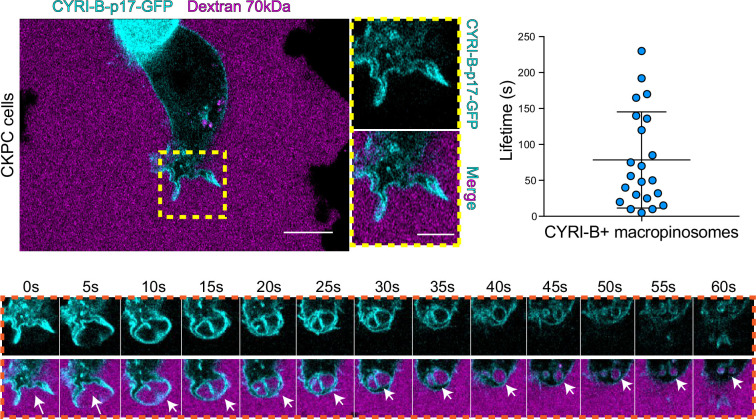
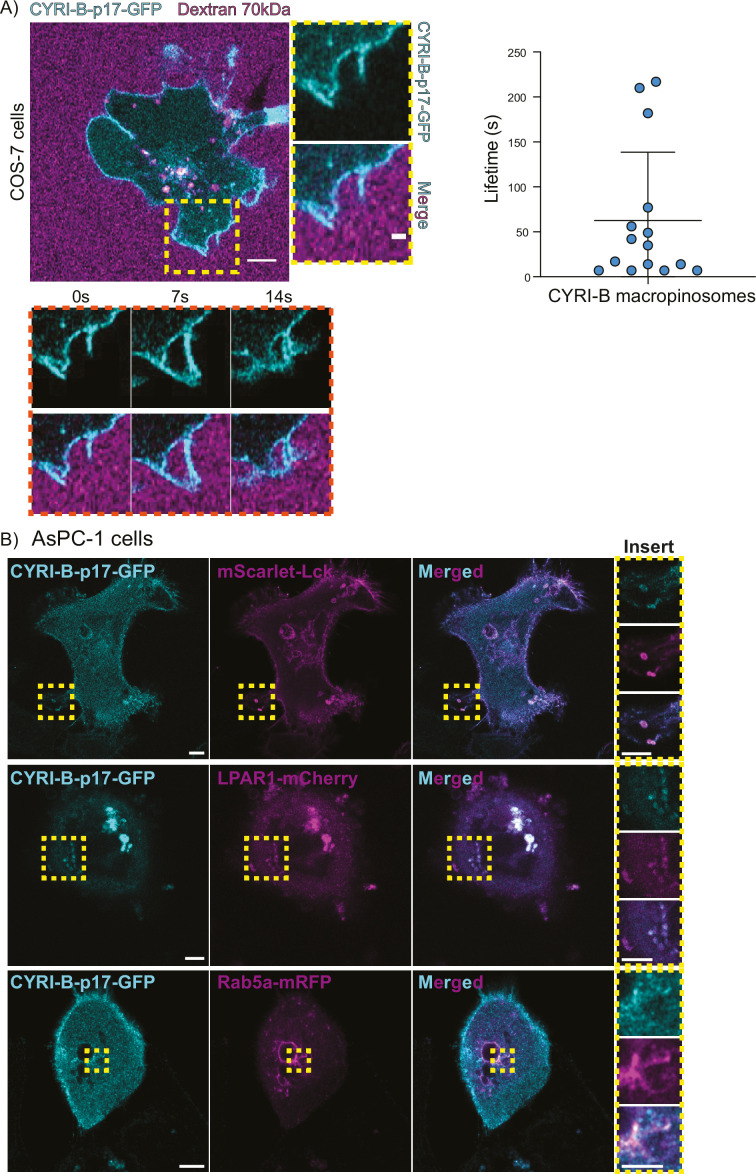
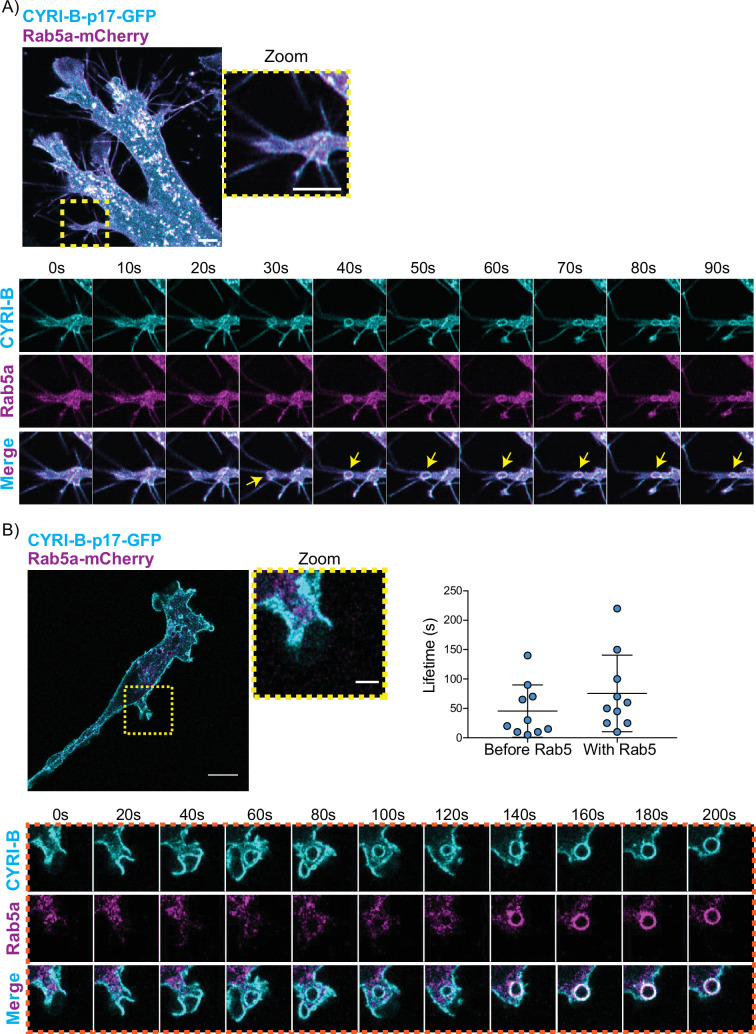
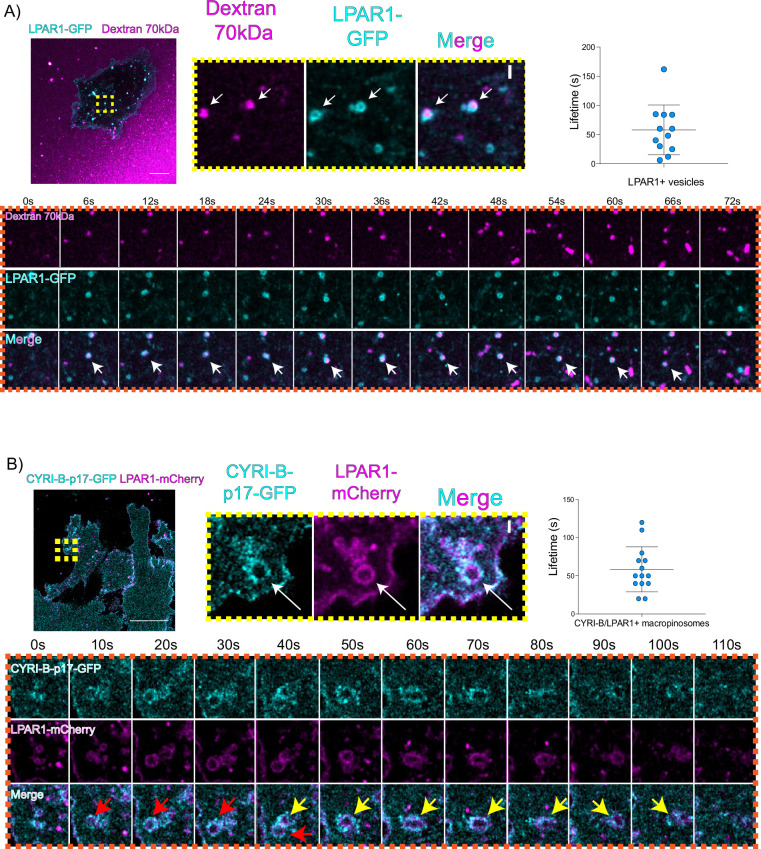
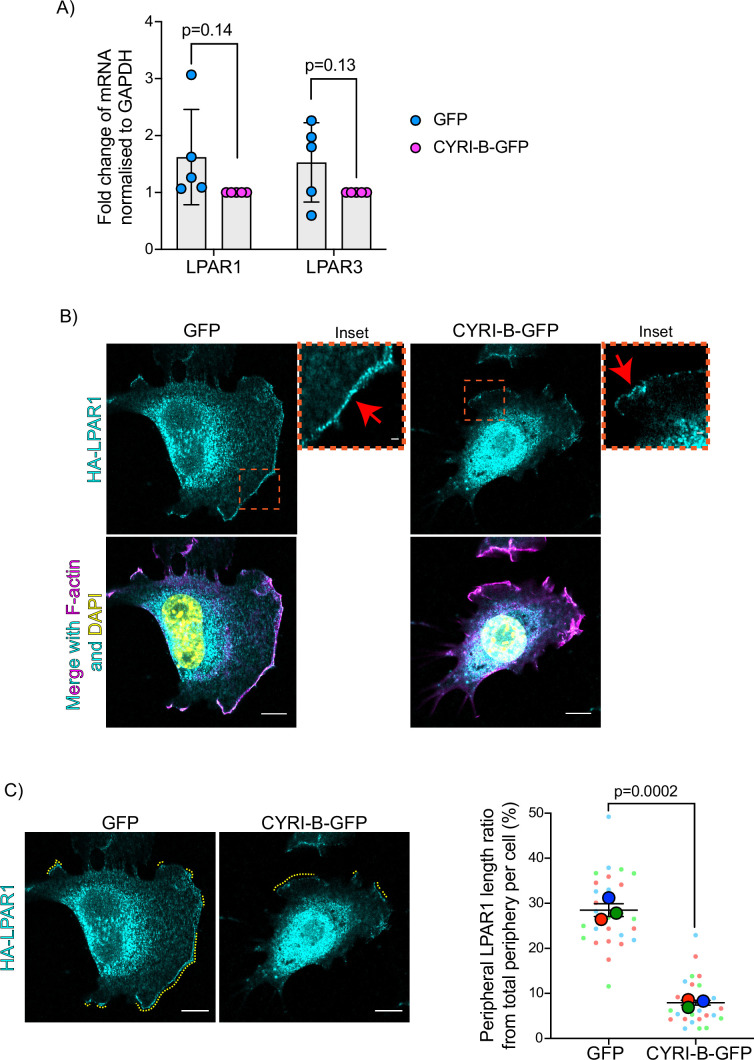
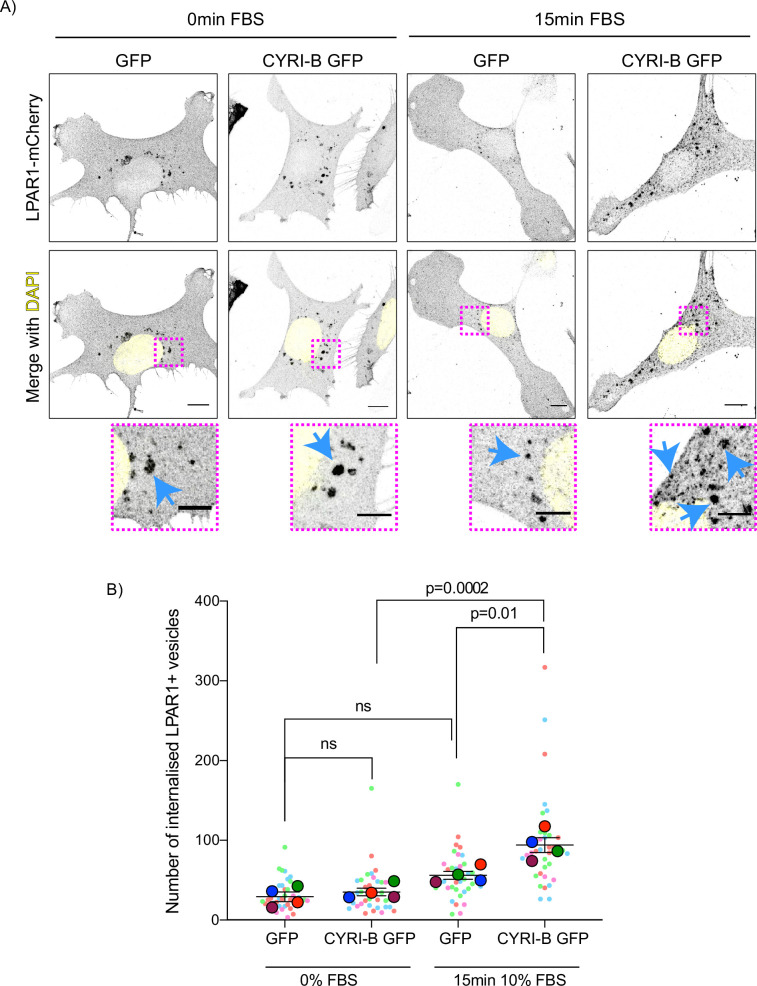
Pancreatic ductal adenocarcinoma carries a dismal prognosis, with high rates of metastasis and few treatment options. Hyperactivation of KRAS in almost all tumours drives RAC1 activation, conferring enhanced migratory and proliferative capacity as well as macropinocytosis. Macropinocytosis is well understood as a nutrient scavenging mechanism, but little is known about its functions in trafficking of signalling receptors. We find that CYRI-B is highly expressed in pancreatic tumours in a mouse model of KRAS and p53-driven pancreatic cancer. Deletion of Cyrib (the gene encoding CYRI-B protein) accelerates tumourigenesis, leading to enhanced ERK and JNK-induced proliferation in precancerous lesions, indicating a potential role as a buffer of RAC1 hyperactivation in early stages. However, as disease progresses, loss of CYRI-B inhibits metastasis. CYRI-B depleted tumour cells show reduced chemotactic responses to lysophosphatidic acid, a major driver of tumour spread, due to impaired macropinocytic uptake of the lysophosphatidic acid receptor 1. Overall, we implicate CYRI-B as a mediator of growth and signalling in pancreatic cancer, providing new insights into pathways controlling metastasis.

Keywords: actin cytoskeleton; cancer biology; cell biology; chemotaxis; endocytosis; macropinocytosis; metastasis; mouse; pancreatic cancer.

Plain language summary

Pancreatic cancer is an aggressive disease with limited treatment options. It is also associated with high rates of metastasis – meaning it spreads to other areas of the body. Environmental pressures, such as a lack of the nutrients metastatic cancer cells need to grow and divide, can change how the cells behave. Understanding the changes that allow cancer cells to respond to these pressures could reveal new treatment options for pancreatic cancer. When nutrients are scarce, metastatic cancer cells can gather molecules and nutrients by capturing large amounts of the fluid that surrounds them using a mechanism called macropinocytosis. They can also migrate to areas of the body with higher nutrient levels, through a process called chemotaxis. This involves cells moving towards areas with higher levels of certain molecules. For example, cancer cells migrate towards high levels of a lipid called lysophosphatidic acid, which promotes their growth and survival. A newly discovered protein known as CYRI-B has recently been shown to regulate how cells migrate and take up nutrients. It also interacts with proteins known to be involved in pancreatic cancer progression. Therefore, Nikolaou et al. set out to investigate whether CYRI-B also plays a role in metastatic pancreatic cancer. Experiments in a mouse model of pancreatic cancer showed that CYRI-B levels were high in pancreatic tumour cells. And when the gene for CYRI-B was removed from the tumour cells, they did not metastasise. Further analysis revealed that CYRI-B controls uptake and processing of nutrients and other signalling molecules through macropinocytosis. In particular, it ensures uptake of the receptor for lysophosphatidic acid, allowing the metastatic cancer cells to migrate. The findings of Nikolaou et al. reveal that CYRI-B is involved in metastasis of cancer cells in a mouse model of pancreatic cancer. This new insight into how metastasis is controlled could help to identify future targets for treatments that aim to prevent pancreatic cancer cells spreading to distant sites.


Conflict of interest statement

SN, AJ, JW, NP, LF, CN, HS, SB, LM No competing interests declared

Figures

Figure 1.
Figure 1.. CYRI-B is expressed during pancreatic ductal adenocarcinoma (PDAC) progression.
(A) Representative images of Cyrib RNAScope in situ hybridisation from 6-, 10-, 15-week-old and end-point KPC mouse tissues. RNA probes are visualised as brown dots. Haematoxylin was also used to stain the nuclei. Scale bars, 50 μm. Yellow boxes show the region of interest for magnified images (inset). Red arrows denote positive RNA probes. Scale bars, 5 µm. (B) Quantification of the CYRI-B RNA probes per μm2 from (A). Mean ± SD; one-way ANOVA with Tukey’s test was performed in n≥3 mice. *p<0.01, **p<0.001.
Figure 2.
Figure 2.. Loss of CYRI-B accelerates progression in the KPC mouse model of pancreatic ductal adenocarcinoma (PDAC).
(A) Schematic representation of the CKPC mouse model. (B) Representative images for Cyrib RNAScope staining of end-point tumours from KPC and CKPC mice. Scale bars, 50 µm. Inset panels are magnified from the black dashed box. Scale bars, 10 µm. Red arrows indicate the positive Cyrib RNA. (C) Histograms showing the Cyrib RNA probes per μm2 at end-point tumours in KPC and CKPC mice. Mean ± SD; unpaired t-test, n=4 KPC and 4 CKPC mice. (D) Representative western blot images of CYRI-B in cell lines established from one KPC (KPC-1) and two CKPC (CKPC-1 and CKPC-2) tumours. Membranes were also probed for anti-p53 and anti-PDX1 to validate the CKPC cells. α-Tubulin and vinculin were used as loading controls. Molecular weights as indicated on the side. (E) Survival (to end-point) curve (n=21 KPC, 21 CKPC independent mice). Log-rank (Mantel Cox) test used for comparing the KPC with CKPC survival curves. p-Value as indicated. (F) Histogram showing tumour to body mass ratios at sacrifice. Mean ± SD; unpaired t-test was performed in n=21 KPC and 21 CKPC mice. p-Value: not significant (ns).
Figure 2—figure supplement 1.
Figure 2—figure supplement 1.. End-point CKPC tumours show comparable proliferation, apoptosis vascularisation, and necrosis to KPC tumours.
(A) Representative images of pancreatic ductal adenocarcinoma (PDAC) sections in KPC and CKPC end-point mice, stained for Ki-67 (proliferation). Scale bars, 100 µm. Red arrows indicate the positive cells. (B) Quantification of Ki-67 positive nuclei per area from (A). Mean ± SD; unpaired t-test was performed in n=12 KPC and 12 CKPC independent mice. p-Value: not significant (ns). (C) Representative images of PDAC sections in KPC and CKPC end-point mice, stained for cleaved caspase 3 (CC-3, apoptosis). Scale bars, 100 µm. Red arrows indicate the positive cells. (D) Quantification of CC-3 positive cells per area from (C). Mean ± SD; unpaired t-test was performed in n=12 KPC and 12 CKPC independent mice. p-Value: ns. (E) Representative images of PDAC sections in KPC and CKPC end-point mice, stained for CD31 (endothelial marker). Scale bars, 100 µm. Red arrows indicate the positive area for CD31. (F) Quantification of CD31 positive area per tumour area from (E). Mean ± SD; Mann-Whitney test was performed in n=12 KPC and 12 CKPC independent mice. p-Value: ns. (G) Representative images of PDAC section in KPC and CKPC end-point mice, stained for haematoxylin and eosin (H&E) to identify necrotic areas. Scale bar, 500 µm. Red arrows indicate the positive area for necrosis. ×20 objective used to show the fragmented nuclei within the necrotic areas (red arrows). Scale bar, 100 µm. (H) Quantification of necrotic area per tumour area from (G). Mean ± SD; Mann-Whitney test was performed in n=12 KPC and 12 CKPC independent mice. p-Value: ns.
Figure 3.
Figure 3.. Loss of CYRI-B accelerates pancreatic intraepithelial neoplasm (PanIN) formation and increases pJNK, pERK, and proliferation.
(A) Representative haematoxylin and eosin (H&E) images from KPC mice of normal pancreatic ducts, PanIN1, -2, -3 and pancreatic ductal adenocarcinoma (PDAC) lesions. Scale bars, 100 µm. (B) Number of ducts present in pancreas from 15-week-old KPC and CKPC mice (n≥6 mice). Mean ± SD; unpaired t-test was performed. p-Value as indicated. (C) Classification and scoring of pancreatic ducts in pancreas from 15-week-old KPC and CKPC mice (n≥6 mice). Mean ± SD; unpaired t-test was performed. ns = not significant, p-value as indicated. (D) Representative images of pancreata from 15-week-old mice stained with pERK and haematoxylin (nuclei). Red arrows indicate the positive pERK staining. Scale bars, 100 µm. (E) pERK positive area from the total quantified area from (D). Mean ± SD; unpaired t-test was performed in n=7 KPC and CKPC independent mice. p-Value as indicated. (F) Representative images of pancreata from 15-week-old-mice stained with pJNK and haematoxylin (nuclei). Red arrows indicate the positive pJNK staining. Scale bars, 100 µm. (G) pJNK positive area from the total quantified area from (F). Mean ± SD; unpaired t-test was performed in n=7 KPC and CKPC independent mice. p-Value as indicated. (H) Representative images of pancreatic tissue from 15-week-old KPC and CKPC mice stained for BrdU (proliferation) and haematoxylin. Red arrows show the BrdU positive nuclei. Scale bars, 100 µm. (I) Quantification of BrdU positive nuclei from KPC and CKPC 15-week-old pancreatic tissues. Mean ± SD; unpaired t-test was performed in n=6 KPC and 5 CKPC independent mice. p-Value as indicated. (J) Quantification of the pancreas to body mass ratio at 10 weeks (n=6 mice in each mouse model) and 15 weeks (n=7 in each mouse model) in KPC and CKPC mice. Mean ± SD; unpaired t-test was performed. ns = not significant, p-value as indicated.
Figure 3—figure supplement 1.
Figure 3—figure supplement 1.. Loss of CYRI-B does not alter the formation of pancreatic intraepithelial neoplasm (PanIN) lesions in 10-week-old mice.
(A) Quantification of the number of ducts present in 10-week-old pancreas in KPC and CKPC mice (n≥5 mice). Mean ± SD; unpaired t-test was performed. ns = not significant. (B) Classification and scoring of pancreatic ducts in pancreas from 10-week-old KPC and CKPC mice (n≥5 mice). Mean ± SD; unpaired t-test was performed. ns = not significant.
Figure 4.
Figure 4.. Loss of CYRI-B reduces metastasis and chemotactic potential.
(A) Incidence of KPC or CKPC mice presenting with metastasis in liver, diaphragm, and bowel. Numbers above the bars show the fraction of mice with metastasis to the indicated site. Chi-square test was performed in n=21 KPC and CKPC mice. p-Value as indicated. (B) Representative haematoxylin and eosin (H&E) images of metastasis in the liver (scale bar, 50 µm) and diaphragm (scale bar, 100 µm). Black arrowheads denote metastatic lesions. (C) Histogram showing pancreas to body mass ratios at sacrifice. Mean ± SD; Mann-Whitney test was performed in n=5 for KPC control and n=6 mice for KPC Cyrib knockout (KO) cells. p-Value: not significant (ns). (D) Representative images of the mesenteric tumour foci from the in vivo transplantation assay. The metastatic foci were stained for H&E, Ki-67 (proliferation), p53, and PDX1 (for control). Scale bars, 100 µm. (E) Histogram of the number of metastatic foci at mesentery for KPC control and KPC Cyrib KO mice. Mean ± SD; Mann-Whitney test was performed in n≥5 mice for either control or Cyrib KO KPC injected cells. p-Value as indicated. (F) Quantification of the Ki-67 positive cells in the metastatic tumour foci. Mean ± SD; Mann-Whitney test was performed in n=4 for KPC control and n=5 mice for Cyrib KO KPC cells. p-Value: not significant (ns). (G) Incidence of mice presenting ascites (n≥5). (H) Incidence of mice presenting jaundice (n≥5). (I) Representative spider plots from n=3 independent chemotaxis assays of CKPC Cyrib KO and rescued cells. A chemotactic gradient of 10% foetal bovine serum (FBS) was established and cells were imaged for 16 hr (1 frame/15 min). Cells were also treated with either DMSO or the LPAR1/3 inhibitor KI16425 (10 mM) for 1 hr prior to imaging. Each cell trajectory is displayed with a different colour and the displacement of each cell is reported in the x- and y-axis. Orange gradient above shows the FBS gradient. Rose plot data are displayed for each condition below. Red dashed lines show the 95% confidence interval for the mean direction in the rose plots. The numbers represent degrees of the angle of migration relative to the chemoattractant gradient, with zero (red) denoting the direction of the chemoattractant gradient. (J) Quantification of the results in (I) showing the cos(θ) data (chemotactic index). Mean ± SEM from the average cos(θ) data of every repeat; one-way ANOVA followed by Tukey’s multiple comparisons test was performed. p-Values as indicated on the graph, ns = not significant.
Figure 4—figure supplement 1.
Figure 4—figure supplement 1.. Deletion of CYRI-B in KPC-1 cells does not affect proliferation.
(A) Representative western blot from KPC-1 cells for CYRI-B knockout (KO). Empty vector was used as control. For Cyrib KO, Ex3 and Ex4 sequences were used. Alpha-tubulin was used as loading control. Molecular weights as indicated on the side. (B) Proliferation assay of control or Cyrib KO KPC-1 cells from (A). 104 cells were seeded on day 1 and manually counted every day. Error bars represent mean ± SEM from n=3 independent repeats.
Figure 4—figure supplement 2.
Figure 4—figure supplement 2.. Loss of CYRI-B results in enhanced spreading and Arp2/3 leading edge recruitment in pancreatic ductal adenocarcinoma (PDAC) cells.
(A) Western blot images of CKPC-1 cells stably expressing CYRI-B-p17-GFP or GFP. KPC-1 and KPC-2 cell lines were used as control. Untransfected CKPC cells were also used as a control. Membranes were probed for anti-GFP (bottom blot) and anti-CYRI-B (top blot). GAPDH was used as loading control. Molecular weights are displayed on the side. (B) Representative immunofluorescence images of CKPC Cyrib knockout (KO) and rescued cells. Cells were seeded on fibronectin-coated coverslips, fixed and stained for F-actin (magenta), ArpC2 (cyan), and DAPI for nuclei (yellow). Scale bars, 20 μm. Yellow dotted boxes show the sites for the magnified images. Red arrows show the positive area for ArpC2 staining at the leading edge. Scale bars, 5 μm. Graph shows manual quantification of the number of cells presenting with lamellipodia (purple) or other protrusions (green) from (B). Mean ± S.D; paired t-test was performed in n=4. p-Value as indicated. (C) Quantification of cell area per cell from (B) based on the F-actin staining. Scatter plot here is presented as super plot and every independent biological repeat is coloured differently. Mean ± SEM; paired t-test was performed in n=4. p-Value as indicated. (D) Manual quantification of the length of the cell periphery showing strong ArpC2 accumulation, normalised to the total cell periphery. Scatter plot here is presented as a super plot and every independent biological repeat is coloured differently. Mean ± SEM; unpaired t-test was performed in n=3 (from a total of 30 cells). p-Value as indicated. (E) Manual quantification of the relative intensity of ArpC2 on the plasma membrane to cytoplasmic average intensity. Scatter plot here is presented as a super plot and every independent biological repeat is coloured differently. Mean ± SEM; unpaired t-test was performed in n=3. p-Value as indicated.
Figure 4—figure supplement 3.
Figure 4—figure supplement 3.. Deletion of CYRI-B abolishes chemotaxis.
(A) Representative spider plots from n=3 independent chemotaxis assays of KPC-1 control or Cyrib knockout (KO) (EX3 and EX4) cells. Cells were seeded on fibronectin-coated coverslips and the ‘Insall’ chamber was assembled. A chemotactic gradient of 10% foetal bovine serum (FBS) was established and cells were imaged for 16 hr (1 frame/15 min). Every cell trajectory is displayed with a different colour and the displacement of each cell is reported in the x- and y-axis. Orange gradient above shows the FBS gradient. Rose plot data are displayed for each condition below. Red dashed lines show the 95% confidence interval for the mean direction in the rose plots. The numbers represent degrees of the angle of migration relative to the chemoattractant, with zero (red) denoting the direction of the chemoattractant gradient. (B) Quantification of the results in (A) showing the cos(θ) data (chemotactic index). Mean ± SEM from the average cos(θ) data of every repeat; one-way ANOVA followed by Tukey’s multiple comparisons test was performed. Red dashed lines were indicated and show the 95% confidence interval for the mean direction in the rose plots. p-Values as indicated on the graph.
Figure 5.
Figure 5.. CYRI-B is localised at intracellular vesicles, tubules, and membrane cups.
(A) Still image from live-cell videos of COS-7 Cyrib knockout (KO) cells transfected with CYRI-B-p17-GFP (cyan) - see Figure 5—video 1. Scale bar, 5 μm. Yellow box denotes magnified area. Magenta and orange arrows show the quantification area. Scale bar, 1 μm. Right panels show the quantifications of the relative intensity of the vesicles/cups and tubules. Image and quantification are representative of n=25 vesicles from a total of 10 cells, over 3 independent biological repeats. (B) Scatter plot of the lifetime of vesicles from (A). Error bars show the mean ± SD. (C) Scatter plot of the size (diameter) of CYRI-B positive vesicles from (A). Error bars show the mean ± SD. (D) Scatter plot of the length of CYRI-B tubules from (A). Error bars show the mean ± SD. (E) Still image from live-cell videos of COS-7 CYRI-B KO cells transfected with CYRI-B-p17-GFP (cyan), showing a macropinocytic cup - see Figure 5—video 2. Scale bar, 5 μm. Yellow box denotes magnified area. Magenta arrows show the quantification area. Scale bar, 1 μm. Scatter plot on the right panel shows the lifetime of the CYRI-B cups. Error bars show the mean ± SD. Orange dotted box shows the montage of the CYRI-B cup over time (s). Scale bar, 1 μm. Magenta arrows show the area of interest. Image and quantification are representative of n=9 events from a total of 4 cells.
Figure 6.
Figure 6.. CYRI-B is recruited to macropinocytic cups.
Still image from live-cell imaging of CKPC-CYRI-B-GFP stable cell lines (cyan) - see Figure 6—video 1. 70 kDa Dextran was added to the medium to visualise macropinocytic events (magenta). Scale bar, 10 μm. Yellow box shows the magnified area of interest, showing the macropinocytic cups. Scale bar, 5 μm. Scatter plot represents the lifetime of CYRI-B+ macropinosomes once internalised. Mean ± SD. Orange box shows a representative montage of CYRI-B internalisation via macropinocytosis. Scale bar, 1 μm. White arrows show CYRI-B localisation at the cups and the macropinosomes once internalised. n=21 events from a total of 6 cells.
Figure 6—figure supplement 1.
Figure 6—figure supplement 1.. CYRI-B localises at macropinocytic cups in COS-7 cells.
(A) Still image from live-cell imaging of COS-7 Cyrib knockout (KO) cells transfected with CYRI-B-p17-GFP (cyan) (see also Figure 6—video 1). 70 kDa Dextran was added to the medium to visualise the macropinocytic events (magenta). Scale bar, 5 μm. Yellow box shows the magnified area of interest, showing the macropinocytic cups. Scale bar, 5 μm. Scatter plot represents the lifetime of CYRI-B+ macropinosomes once internalised. Mean ± SD. Orange box shows a representative montage of CYRI-B internalisation via macropinocytosis. n=15 events from a total of 6 cells. (B) Representative confocal images of AsPC1 cells transiently transfected with a combination of CYRI-B-p17-GFP (cyan) and mScarlet-Lck (top panel), LPAR1-mCherry (middle panel), or Rab5a-mCherry (bottom panel) (magenta) (see also Figure 6—video 2). Scale bar, 5 μm. Yellow boxes show the magnified area of interest, showing the co-localisation between CYRI-B and mScarlet-Lck, LPAR1-mCherry, or Rab5a-mCherry at macropinosomes. Scale bar, 5 μm except for Rab5a-mCherry. Scale bar, 2.5 μm.
Figure 7.
Figure 7.. CYRI-B precedes Rab5 recruitment.
(A) Still image from live-cell imaging of AsPC1 cells transiently transfected with CYRI-B-p17-GFP (cyan) and Rab5-mCherry (magenta) - see Figure 7—video 1. Scale bar, 5 μm. Yellow box shows the magnified area of interest, showing the macropinocytic cups. Scale bar, 5 μm. Yellow arrows show macropinosome. (B) Still image from live-cell imaging of COS-7 Cyrib knockout (KO) cells transfected with CYRI-B-p17-GFP (cyan) and mRFP-Rab5 (magenta) - see Figure 7—video 2. Scale bar, 10 μm. Yellow box show the magnified area of interest, showing the macropinocytic cups. Scale bar, 5 μm. Orange boxes show a representative montage of CYRI-B internalisation and the recruitment of Rab5 at the nascent macropinosomes. Scale bar, 5 μm. Scatter plots represent the lifetime of CYRI-B+ macropinosomes once internalised before and after Rab5 recruitment. Error bars show the mean ± SD; n=10 events from a total of 6 cells.
Figure 8.
Figure 8.. LPAR is internalised via CYRI-B positive macropinocytosis.
(A) Still images from live-cell imaging of COS-7 cells transfected with LPAR1-GFP (cyan) - see Figure 8—video 1. 70 kDa Dextran was added to the medium to visualise the macropinosomes (magenta). Scale bar, 10 μm. Yellow box shows the magnified area of interest, showing the LPAR1+ macropinocytic vesicles/cups. White arrows denote structures of interest. Scale bar, 1 μm. Scatter plot represents the lifetime of LPAR1+ vesicles once internalised. Mean ± SD. Orange box shows a representative montage of LPAR1 internalisation via macropinocytosis. Scale bar, 1 μm. White arrows show the vesicle of interest. n=12 events from a total of 3 cells. (B) Still image from live-cell imaging of CKPC-1 cells transfected with CYRI-B-p17-GFP (cyan) and LPAR1-mCherry (magenta) - see Figure 8—video 2. Scale bar, 20 μm. Yellow box shows the magnified area of interest, showing the LPAR1 co-localisation with CYRI-B+ macropinosomes. White arrows show the vesicle of interest. Scale bar, 1 µm. Scatter plot represents the lifetime of LPAR1 and CYRI-B vesicles once internalised. Mean ± SD. Orange box shows a representative montage of LPAR1 and CYRI-B internalisation. Red and yellow arrows show the vesicles of interest. n=14 events from a total of 4 cells.
Figure 8—figure supplement 1.
Figure 8—figure supplement 1.. Loss of CYRI-B alters membrane localisation of LPAR1 but not its expression.
(A) Quantitative polymerase chain reaction (qPCR) analysis for endogenous gene expression of LPAR1 and LPAR3 in CKPC-1 stable cells either transfected with GFP or CYRI-B-GFP. The histogram shows the relative mRNA expression from rescued CYRI-B-GFP and normalised from GAPDH expression. Error bars show the mean ± SD; unpaired t-test was performed in n=5 independent repeats. p-Value as indicated. (B) Representative immunofluorescence images of CKPC-1 Cyrib knockout (KO) and rescued cells. Cells were transfected with LPAR1-HA, then seeded on fibronectin-coated coverslips, fixed and stained for F-actin (magenta), anti-HA (cyan), and DAPI for nuclei (yellow). Scale bars, 10 μm. Orange dotted boxes show the sites for the magnified images (inset). Red arrows show the positive area for LPAR1 staining at the leading edge. Scale bars, 1 μm. (C) Representative immunofluorescence images from (B) as an example of how analysis was performed. Yellow dotted lines show the LPAR1-positive area at the periphery of the cells. Right panel shows the manual quantification of the length of LPAR1 in the periphery of the cells, normalised to the total cell length. Scatter plot here is presented as super plots and every independent biological repeat is coloured differently. Mean ± SEM; unpaired t-test was performed in n=3 (from a total of 28 cells). p-Value as indicated. Scale bars, 10 μm.
Figure 9.
Figure 9.. Loss of CYRI-B reduces LPAR1 internalisation upon serum stimulation.
(A) Immunofluorescence images of CKPC-1 stable cells transfected with GFP or CYRI-B-p17-GFP. Cells were transfected with LPAR1-mCherry and seeded on fibronectin-coated coverslips. Cells were starved overnight and the next day 10% foetal bovine serum (FBS) was used to stimulate the uptake of LPAR1. Vesicles (marked by LPAR1-mCherry) are shown as black dots, DAPI (yellow) was used to visualise the nuclei. Scale bars, 10 µm. Magenta dotted boxes show the magnified area of interest and cyan arrows show the internalised vesicles. Scale bars, 5 µm. (B) Quantification of the number of LPAR1-positive vesicles in each condition. Scatter plot is presented as super plots and every independent biological repeat is coloured differently. Mean ± SEM; one-way ANOVA followed by Tukey’s multiple comparisons test was performed, n=4 (from a total of ≥35 cells for each condition). p-Value as indicated, ns = not significant.

Update of

  • doi: 10.1101/2022.11.23.517689

Similar articles

Cited by

References

    1. Bagrodia S, Dérijard B, Davis RJ, Cerione RA. Cdc42 and PAK-mediated signaling leads to Jun kinase and p38 mitogen-activated protein kinase activation. The Journal of Biological Chemistry. 1995;270:27995–27998. doi: 10.1074/jbc.270.47.27995. - DOI - PubMed
    1. Bailey P, Chang DK, Nones K, Johns AL, Patch AM, Gingras MC, Miller DK, Christ AN, Bruxner TJC, Quinn MC, Nourse C, Murtaugh LC, Harliwong I, Idrisoglu S, Manning S, Nourbakhsh E, Wani S, Fink L, Holmes O, Chin V, Anderson MJ, Kazakoff S, Leonard C, Newell F, Waddell N, Wood S, Xu Q, Wilson PJ, Cloonan N, Kassahn KS, Taylor D, Quek K, Robertson A, Pantano L, Mincarelli L, Sanchez LN, Evers L, Wu J, Pinese M, Cowley MJ, Jones MD, Colvin EK, Nagrial AM, Humphrey ES, Chantrill LA, Mawson A, Humphris J, Chou A, Pajic M, Scarlett CJ, Pinho AV, Giry-Laterriere M, Rooman I, Samra JS, Kench JG, Lovell JA, Merrett ND, Toon CW, Epari K, Nguyen NQ, Barbour A, Zeps N, Moran-Jones K, Jamieson NB, Graham JS, Duthie F, Oien K, Hair J, Grützmann R, Maitra A, Iacobuzio-Donahue CA, Wolfgang CL, Morgan RA, Lawlor RT, Corbo V, Bassi C, Rusev B, Capelli P, Salvia R, Tortora G, Mukhopadhyay D, Petersen GM, Munzy DM, Fisher WE, Karim SA, Eshleman JR, Hruban RH, Pilarsky C, Morton JP, Sansom OJ, Scarpa A, Musgrove EA, Bailey UMH, Hofmann O, Sutherland RL, Wheeler DA, Gill AJ, Gibbs RA, Pearson JV, Waddell N, Biankin AV, Grimmond SM. Genomic analyses identify molecular subtypes of pancreatic cancer. Nature. 2016;531:47–52. doi: 10.1038/nature16965. - DOI - PubMed
    1. Bucci C, Wandinger-Ness A, Lütcke A, Chiariello M, Bruni CB, Zerial M. Rab5a is a common component of the apical and basolateral endocytic machinery in polarized epithelial cells. PNAS. 1994;91:5061–5065. doi: 10.1073/pnas.91.11.5061. - DOI - PMC - PubMed
    1. Buckley CM, King JS. Drinking problems: mechanisms of macropinosome formation and maturation. The FEBS Journal. 2017;284:3778–3790. doi: 10.1111/febs.14115. - DOI - PubMed
    1. Canton J. Macropinocytosis: new insights into its underappreciated role in innate immune cell surveillance. Frontiers in Immunology. 2018;9:2286. doi: 10.3389/fimmu.2018.02286. - DOI - PMC - PubMed

MeSH terms