. 2024 May 7;134(12):e173214.
doi: 10.1172/JCI173214.

SUCNR1 regulates insulin secretion and glucose elevates the succinate response in people with prediabetes

Affiliations

SUCNR1 regulates insulin secretion and glucose elevates the succinate response in people with prediabetes

Joan Sabadell-Basallote et al. J Clin Invest. .

Abstract

Pancreatic β cell dysfunction is a key feature of type 2 diabetes, and novel regulators of insulin secretion are desirable. Here, we report that succinate receptor 1 (SUCNR1) is expressed in β cells and is upregulated in hyperglycemic states in mice and humans. We found that succinate acted as a hormone-like metabolite and stimulated insulin secretion via a SUCNR1-Gq-PKC-dependent mechanism in human β cells. Mice with β cell-specific Sucnr1 deficiency exhibited impaired glucose tolerance and insulin secretion on a high-fat diet, indicating that SUCNR1 is essential for preserving insulin secretion in diet-induced insulin resistance. Patients with impaired glucose tolerance showed an enhanced nutrition-related succinate response, which correlates with the potentiation of insulin secretion during intravenous glucose administration. These data demonstrate that the succinate/SUCNR1 axis is activated by high glucose and identify a GPCR-mediated amplifying pathway for insulin secretion relevant to the hyperinsulinemia of prediabetic states.

Keywords: Beta cells; Endocrinology; G protein–coupled receptors; Insulin; Metabolism.


Figures

Figure 1
Figure 1. SUCNR1 is expressed in islets and β cells.
(A) Sucnr1 mRNA levels analyzed in subcutaneous white adipose tissue (scWAT), visceral WAT tissue (vWAT), and liver, pancreas, and muscle tissue from male mice by quantitative PCR (n = 3–4). (B) Immunohistochemical (IHC) staining of SUCNR1 in male human and male mouse pancreas sections, and chromogranin A IHC staining or H&E staining. Scale bars: 50 μm. (C) Analysis of Sucnr1 mRNA expression in α and β cells isolated by FACS from male rat islets (n = 4). (D) In silico study of SUCNR1 gene expression regulation by genomic sequences and specific human adult islet transcriptional factors, and single-nucleotide polymorphisms (SNPs) associated with T2D localized within or surrounding the SUCNR1 locus. TFBS, transcription factor binding site. Data are presented as mean ± SEM.
Figure 2
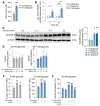
Figure 2. SUCNR1 levels in islets are dysregulated in obesity and T2D.
(A) Sucnr1 mRNA expression in the entire pancreas of wild-type mice fed normal chow diet (NCD) and high-fat diet (HFD) and db/db mice on NCD (n = 4–5). (B) SUCNR1 and GLP1R mRNA expression in islets from healthy donors (n = 7) and donors with obesity (n = 3). (C) SUCNR1 protein levels in human islet lysates from healthy donors (n = 6) and donors with obesity (n = 3) and T2D (n = 7). (D) Linear correlations between the BMI of donors and SUCNR1 mRNA (n = 10) and protein (n = 16) expression. Data are presented as mean ± SEM. *P < 0.05 vs. control (Student’s t test in A and B, Kruskal-Wallis test with Dunn’s test for multiple comparisons in C, or Pearson’s correlation coefficient in D).
Figure 3
Figure 3. The succinate/SUCNR1 axis enhances glucose-stimulated insulin secretion in β cells.
(A) Succinate quantification in the conditioned medium (CM) of MIN6 cells cultured in low- or high-glucose conditions (n = 6). (B) Sucnr1 mRNA expression in MIN6 cells stimulated with different concentrations of glucose for 3 or 24 hours (n = 4). (C) SUCNR1 protein levels in EndoC-βH1 cells stimulated with different concentrations of glucose for 24 hours (n = 6). (D) Insulin quantification in the CM of MIN6 cells stimulated with succinate or cis-epoxysuccinic acid (cESA) at 2.8 mM or 16.7 mM glucose (n = 4). (E) Insulin secretion in glucose-stimulated insulin secretion assays in EndoC-βH5 cells stimulated with 500 μM succinate or 50 μM cESA at 0 mM or 20 mM glucose, determined in the CM by ELISA (n = 4). (F) Insulin secretion in EndoC-βH5 cells incubated with a human-specific SUCNR1 antagonist (1 μM NF-56-EJ40) and 500 μM succinate or 50 μM cESA (n = 4). Data are presented as mean ± SEM. *P < 0.05, **P < 0.01, ***P < 0.001 vs. basal conditions; ###P < 0.001 vs. succinate (Student’s t test in A, ANOVA with Dunnett’s test for multiple comparisons in BE, or ANOVA with Tukey’s test for multiple comparisons in F).
Figure 4
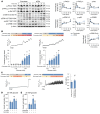
Figure 4. SUCNR1 activation in β cells induces proximal signaling and Ca2+ mobilization, and is dependent on Gq and PKC pathways in β cells.
(A) Western blot analysis of several phosphoproteins in MIN6 cells stimulated with 500 μM succinate or 50 μM cESA at different time points (n = 4–5). (B) Ca2+ mobilization in MIN6 cells stimulated with glucose and succinate assessed by Fura-2 AM fluorometric ratio. Left: Representative trace and quantification of the response to sequential increases in succinate concentration before and after high glucose exposure (n = 4). Right: Representative trace and quantification of the response to succinate concentrations elevated similarly after high glucose exposure (n = 6). (C) Intracellular Ca2+ mobilization in perifused islets from wild-type C57BL/6 male mice assessed by Fura-2 AM fluorometric ratio. Left: Representative trace of 1 mM succinate’s effect on intracellular Ca2+ mobilization at a basal glucose concentration (2.8 mM), followed by exposure to 16.7 mM glucose (n = 7 islets from 3 mice). Right: Representative trace and quantification of 1 mM succinate’s effect on intracellular Ca2+ mobilization at 8 mM glucose (n = 7 islets from 2 mice). (D) Insulin secretion in EndoC-βH5 cells incubated with 500 μM succinate and 1 μM of PKC inhibitor Gö 6983 (n = 4). (E) Insulin secretion in EndoC-βH5 cells incubated with 500 μM succinate and 1 μM of Gq inhibitor FR900359 (n = 4). Data are presented as mean ± SEM. *P < 0.05, **P < 0.01, ***P < 0.001, succinate vs. basal condition; #P < 0.05, ##P < 0.01, cESA vs. basal condition or an inhibitor vs. succinate (ANOVA with Dunnett’s test for multiple comparisons in A and B, paired Student’s t test in C, or ANOVA with Tukey’s test for multiple comparisons in D and E).
Figure 5
Figure 5. SUCNR1 in β cells is required for preserving insulin secretion and glucose homeostasis in HFD-fed male mice.
(A) IHC staining of SUCNR1 in pancreas sections of control and Sucnr1-βKO mice accompanied by serial H&E staining. Scale bars: 50 μm. (B) Body mass of control and Sucnr1-βKO mice under HFD for 8 weeks (n = 8–9). (C) Blood glucose levels in control and Sucnr1-βKO mice in fasted or random-fed conditions (n = 8). (D) Plasma insulin levels in control and Sucnr1-βKO mice in fasted or random-fed conditions (n = 7–8). (E) Morphometric analysis of control and Sucnr1-βKO mice by H&E staining (n = 3). Scale bars: 50 μm. (F) Morphometric analysis of control and Sucnr1-βKO mice by immunofluorescence staining with insulin and glucagon and counterstaining with DAPI (n = 3–4). Scale bars: 50 μm. (G) Intraperitoneal (i.p.) and oral glucose tolerance tests in control and Sucnr1-βKO mice (n = 6–7). Displayed are the blood glucose levels, AUC, plasma insulin (n = 5–6), and GLP-1 levels (n = 5). (H) Insulin tolerance test in control and Sucnr1-βKO mice (n = 6–8). (I) HOMA-IR for control and Sucnr1-βKO mice (n = 5). (J) Insulin secretion in isolated islets from control and Sucnr1-βKO mice stimulated with or without 1 mM succinate or 100 μM cESA at 2.8 or 16.7 mM glucose (n = 5 islet pools from 5–6 mice). Data are presented as mean ± SEM or as box-and-whisker plots indicating median, first and third quartiles, and maximum and minimum values. *P < 0.05, **P < 0.01, ***P < 0.001 vs. control mice, comparing experimental groups in orally administered mice, or in indicated pairwise comparisons; ##P < 0.01, ###P < 0.001 comparing experimental groups in i.p.-administered mice (Student’s t test in B, E, F, and I comparing 2 groups, or 2-way ANOVA with Bonferroni’s test for multiple comparisons in C, D, G, H, and J).
Figure 6
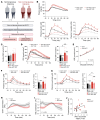
Figure 6. Succinate response is heightened in patients without NGT and is associated with potentiation of insulin secretion.
(A) Study cohort and study schematic. (B) Plasma glucose, insulin, and C-peptide levels during the oral glucose tolerance test (OGTT) and isoglycemic intravenous glucose infusion (IIGI) in patients with NGT (n = 12) and those without NGT (non-NGT; n = 18). (C) Fasting insulin secretion rate (ISR) in NGT and non-NGT groups. (D) ISR during OGTT and IIGI tests in NGT and non-NGT groups. (E) β Cell glucose sensitivity represented as a dose-response function between ISR and glucose concentrations for both groups. (F) Plasma GLP-1 levels during OGTT and IIGI for both groups. (G) Plasma succinate levels during OGTT and IIGI for both groups. (H) Incretin-related potentiation calculated during OGTT in relation to IIGI for both groups. (I) Potentiation calculated during IIGI for both groups. (J) Correlation between the potentiation factor mean and the AUC of succinate during IIGI for both groups (n = 30). Data are presented as mean ± SEM. ***P < 0.001 comparing OGTT and IIGI; #P < 0.05, ##P < 0.01 comparing NGT and non-NGT individuals (paired and unpaired Student’s t tests in C, D, F, and G, Mann-Whitney U test in D, F, and G, Wilcoxon’s test in D, F, and G, 2-way ANOVA tests in EI, or Spearman’s rank correlation coefficient in J).

References

    1. Wahl S, et al. Epigenome-wide association study of body mass index, and the adverse outcomes of adiposity. Nature. 2017;541(7635):81–86. doi: 10.1038/nature20784. - DOI - PMC - PubMed
    1. Cerf ME. Beta cell dysfunction and insulin resistance. Front Endocrinol (Lausanne) 2013;4:37. doi: 10.3389/fendo.2013.00037. - DOI - PMC - PubMed
    1. Fonseca VA. Defining and characterizing the progression of type 2 diabetes. Diabetes Care. 2009;32(suppl 2):S151–S156. doi: 10.2337/dc09-S301. - DOI - PMC - PubMed
    1. Shigeta H, et al. Lifestyle, obesity, and insulin resistance. Diabetes Care. 2001;24(3):608. doi: 10.2337/diacare.24.3.608. - DOI - PubMed
    1. Rorsman P, Ashcroft FM. Pancreatic β-cell electrical activity and insulin secretion: of mice and men. Physiol Rev. 2018;98(1):117–214. doi: 10.1152/physrev.00008.2017. - DOI - PMC - PubMed