. 2024 May 7;9(11):e177002.
doi: 10.1172/jci.insight.177002.

Neuronal DAMPs exacerbate neurodegeneration via astrocytic RIPK3 signaling

Affiliations

Neuronal DAMPs exacerbate neurodegeneration via astrocytic RIPK3 signaling

Nydia P Chang et al. JCI Insight. .

Abstract

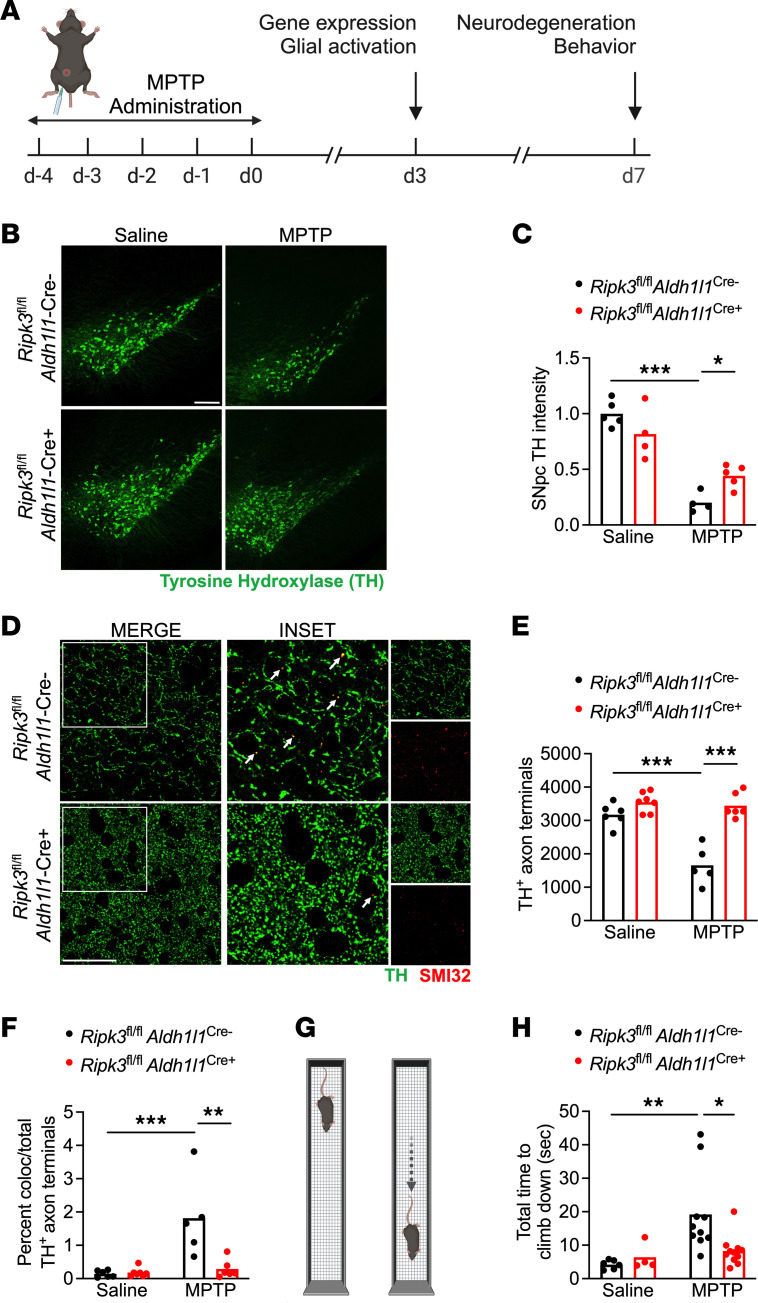
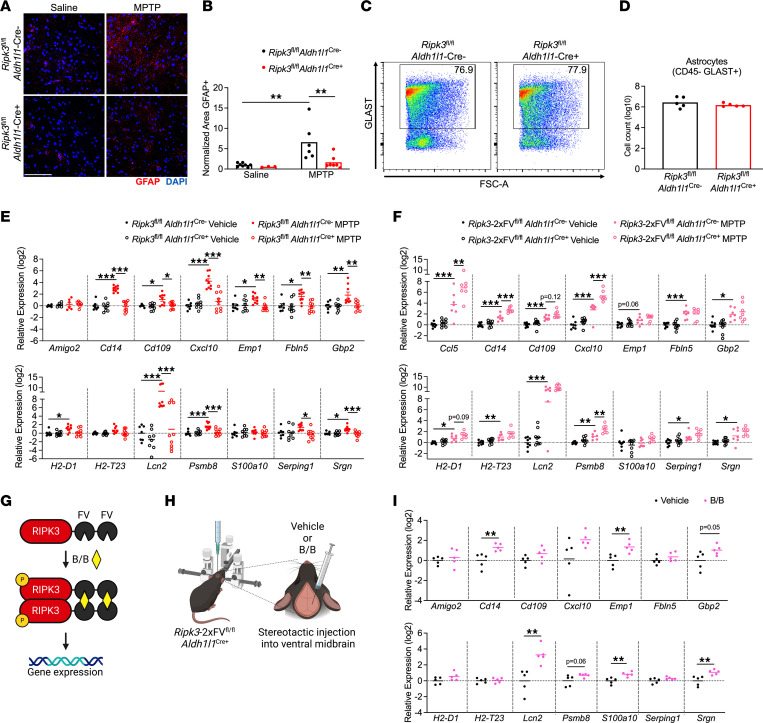
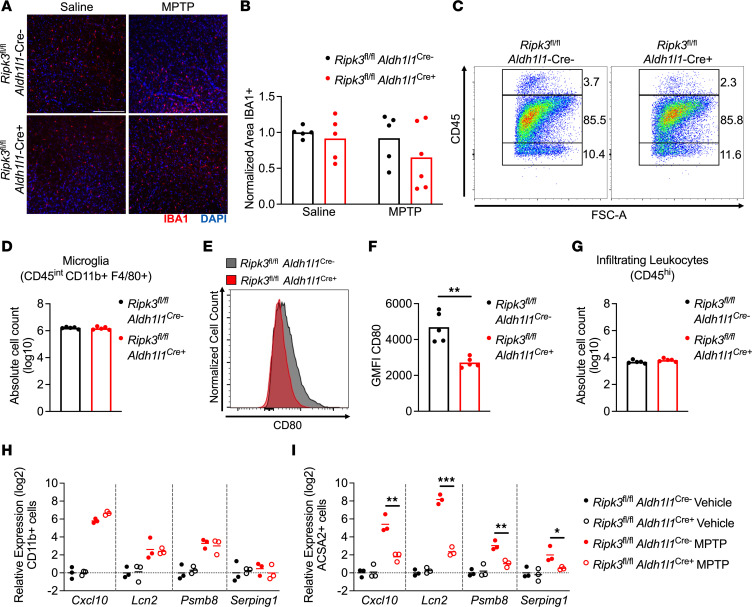
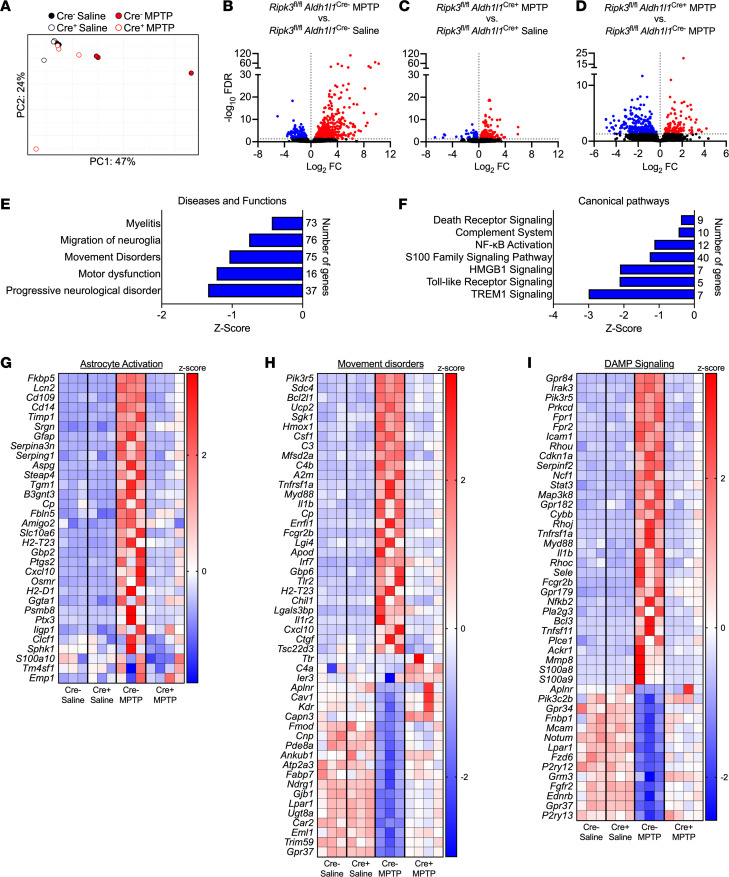
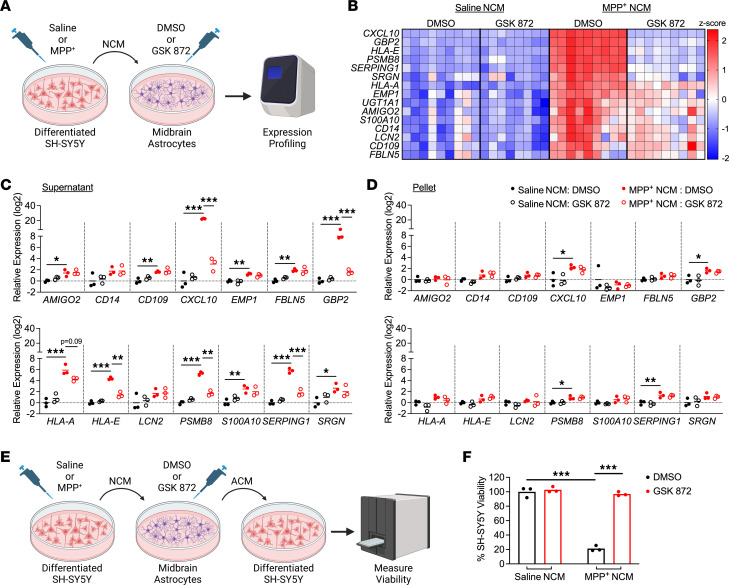
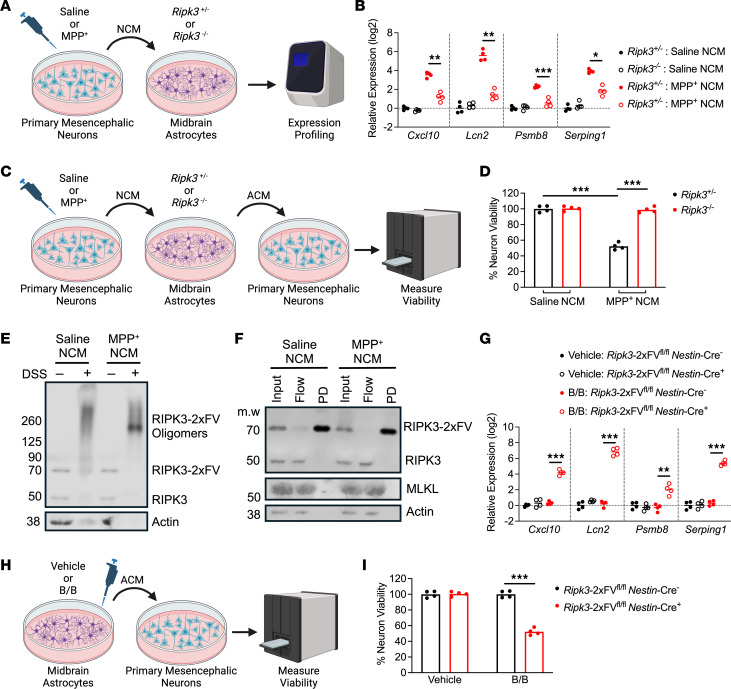
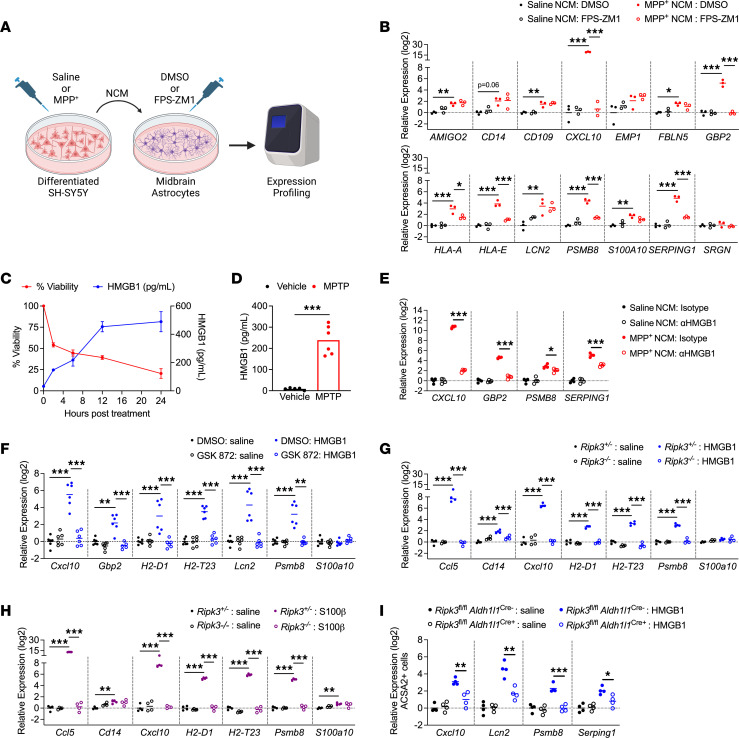
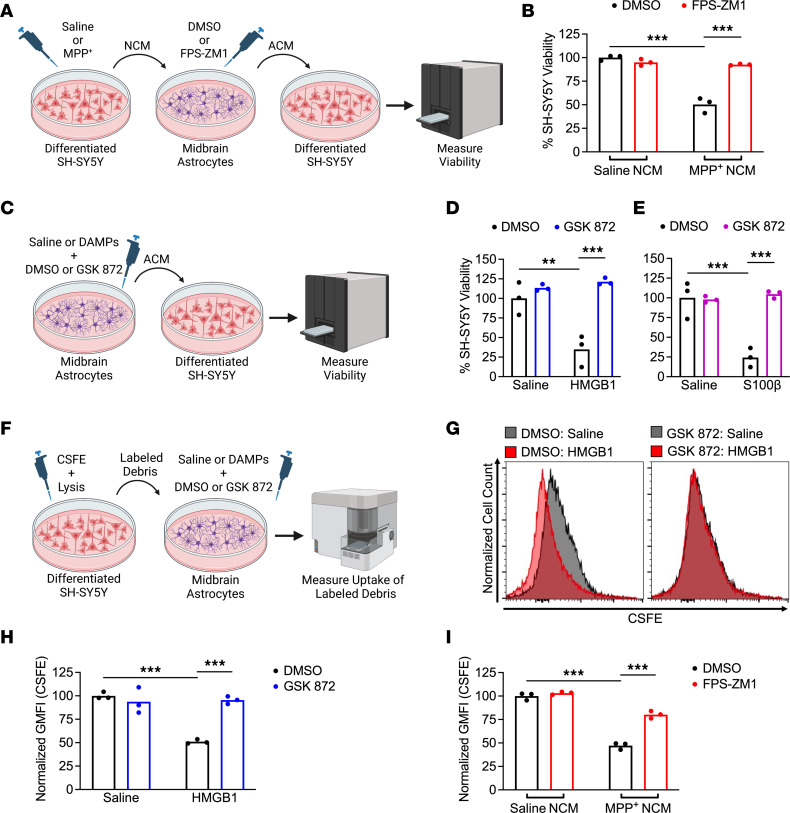
Astrocyte activation is a common feature of neurodegenerative diseases. However, the ways in which dying neurons influence the activity of astrocytes is poorly understood. Receptor interacting protein kinase-3 (RIPK3) signaling has recently been described as a key regulator of neuroinflammation, but whether this kinase mediates astrocytic responsiveness to neuronal death has not yet been studied. Here, we used the 1-methyl-4-phenyl-1, 2, 3, 6-tetrahydropyridine model of Parkinson's disease to show that activation of astrocytic RIPK3 drives dopaminergic cell death and axon damage. Transcriptomic profiling revealed that astrocytic RIPK3 promoted gene expression associated with neuroinflammation and movement disorders, and this coincided with significant engagement of damage-associated molecular pattern signaling. In mechanistic experiments, we showed that factors released from dying neurons signaled through receptor for advanced glycation endproducts to induce astrocytic RIPK3 signaling, which conferred inflammatory and neurotoxic functional activity. These findings highlight a mechanism of neuron-glia crosstalk in which neuronal death perpetuates further neurodegeneration by engaging inflammatory astrocyte activation via RIPK3.

Keywords: Immunology; Innate immunity; Neurodegeneration; Neuroscience.


Conflict of interest statement

Conflict of interest: The authors have declared that no conflict of interest exists.

Figures

Figure 1
Figure 1. Astrocytic RIPK3 signaling promotes neurodegeneration in the MPTP model of Parkinson’s disease.
(A) Schematic diagram showing treatment paradigm for the subacute MPTP model with selected experimental endpoints used in this study. (B and C) IHC analysis of tyrosine hydroxylase (TH) staining in the substantia nigra pars compacta (SNpc) in indicated genotypes 7 days following either saline or MPTP treatment (scale bar = 200 μm). (DF) IHC analysis of TH+ axons with colabeling with the damaged axon marker SMI32 in the striatum in indicated genotypes 7 days following either saline or MPTP treatment (scale bar = 20 μm). Insets represent 2× digital zoom of the original 40× images. Arrows represent colocalized puncta for both TH and SMI32 staining. (G) Schematic diagram for the vertical grid test. (H) Behavioral performance in the vertical grid test 7 days after injection with MPTP or saline. n = 4–5 mice/group (B and C), 5–7 mice/group (DF), 4–11 mice/group (H). Data are represented as mean values with scatterplots depicting individual biological replicate values. All comparisons via 2-way ANOVA with Holm-Šídák multiple-comparison test. *P < 0.05, **P < 0.01, ***P < 0.001. A and G were created with Biorender.com.
Figure 2
Figure 2. RIPK3 drives inflammatory transcriptional activation but not proliferation in midbrain astrocytes.
(A and B) IHC analysis of GFAP staining in the SNpc in indicated genotypes 3 days after MPTP treatment (scale bar = 200 μm). (C and D) Flow cytometric analysis of GLAST+ astrocytes in midbrain homogenates derived from indicated genotypes 3 days after MPTP treatment. (E and F) qRT-PCR analysis of indicated genes in midbrain homogenates derived from astrocyte-specific Ripk3 knockouts (E) or astrocyte-specific Ripk3-overexpressing (F) mice 3 days after MPTP treatment. (G and H) Schematic of inducible RIPK3 activation system (G) and stereotactic delivery of dimerization drug into the ventral midbrain (H). (I) qRT-PCR analysis of indicated genes in midbrain homogenates derived from Ripk3-2xFVfl/fl Aldh1l1-Cre+ mice 24 hours following administration of B/B homodimerizer or vehicle control. n = 3–8 mice/group (A and B), 5 mice/group (C and D), 6–9 mice/group (E), 7–8 mice/group (F), 5 mice/group (I). Data are represented as mean values with scatterplots depicting individual biological replicate values. Comparisons via 2-tailed Student’s t test (D) or 2-way ANOVA with Holm-Šídák multiple-comparison test (B, E, F, and I). *P < 0.05, **P < 0.01, ***P < 0.001. G and H were created with Biorender.com.
Figure 3
Figure 3. Astrocytic RIPK3 signaling has minimal impact on microglial activation in the MPTP model.
(A and B) IHC analysis of IBA1 staining in the SNpc in indicated genotypes 3 days post-MPTP treatment (scale bar = 200 μm). (C) Representative flow cytometric plot depicting leukocyte populations in midbrain homogenates derived from indicated genotypes 3 days post-MPTP treatment. (D) Quantification of absolute numbers of microglia derived from flow cytometric analysis. (E and F) Representative histogram (E) and quantification of geometric mean fluorescence intensity (GMFI) (F) derived from analysis of CD80 expression on microglial populations in D. (G) Quantification of absolute numbers of CD45hi leukocytes derived from flow cytometric analysis. (H and I) qRT-PCR analysis of indicated genes in sorted microglia (H) or astrocytes (I) derived from astrocyte-specific Ripk3-knockout mice 3 days post-MPTP treatment. n = 5–6 mice/group (A and B), 5 mice/group (CG), 3 mice/group (H and I). Data are represented as mean values with scatterplots depicting individual biological replicate values. Comparisons via 2-tailed t test (D, F, and G) or 2-way ANOVA with Holm-Šídák multiple-comparison test (B, H, and I). *P < 0.05, **P < 0.01, ***P < 0.001.
Figure 4
Figure 4. Astrocytic RIPK3 activation drives a transcriptomic state associated with inflammation and neurodegeneration in the midbrain.
(AI) Midbrains were harvested from mice of indicated genotypes 3 days posttreatment with MPTP or saline and subjected to bulk RNA-Seq. (A) Principal component analysis demonstrating separation of treatment groups and genotypes in the RNA-Seq data set. (BD) Volcano plots showing differentially expressed genes derived from indicated comparisons. Data points in red are genes exhibiting upregulated expression, while those in blue exhibit downregulated expression. Genes with an FDR < 0.05 were considered significant. (E and F) Selected significantly enriched disease and function terms (E) or canonical pathways (F) derived from Ingenuity Pathway Analysis comparing Cre versus Cre+ MPTP-treated groups. (GI) Heatmaps showing significantly differentially expressed genes for selected pathways. n = 3–4 mice/group in all panels.
Figure 5
Figure 5. Secreted factors from dying neurons drive RIPK3-dependent astrocyte activation.
(A) Schematic of experimental design for DAMP transfer experiments. Differentiated SH-SY5Y cells were treated with MPP+ or saline for 24 hours, and medium (NCM) was then transferred to cultures of primary human midbrain astrocytes. Astrocytes were treated with NCM in the presence of GSK872 or control for 24 hours prior to qRT-PCR profiling. (B) Heatmap showing expression of astrocyte activation–associated genes in astrocyte cultures treated as in A. (C and D) qRT-PCR profiling of indicated genes in astrocytes treated for 24 hours with clarified NCM supernatants (C) or pelleted SH-SY5Y debris (D). (E) Schematic of experimental design for neurotoxicity assay. Astrocytes were treated with NCM as in A for 24 hours. Astrocytes were then washed and media replaced for another 24 hours. This new astrocyte-conditioned medium (ACM) was then transferred to fresh SH-SY5Y cells for cell viability measurement. (F) CellTiter-Glo analysis of SH-SY5Y viability 24 hours following treatment with ACM derived from indicated conditions. n = 9 cultures/group (A), 3 cultures/group (C, D, and F). Data are represented as mean values with scatterplots depicting individual biological replicate values. All comparisons via 2-way ANOVA with Holm-Šídák multiple-comparison test. *P < 0.05, **P < 0.01, ***P < 0.001. A and E were created with Biorender.com.
Figure 6
Figure 6. RIPK3 activation is sufficient to induce astrocyte-mediated killing of primary neurons.
(A) Schematic of experimental design for DAMP transfer experiments. (B) qRT-PCR profiling of indicated genes in astrocytes treated for 24 hours with clarified NCM supernatants. (C) Schematic of experimental design for neurotoxicity assay. (D) CellTiter-Glo analysis of neuron viability 24 hours following treatment with ACM derived from indicated conditions. (E and F) Western blot analysis of indicated proteins in astrocytes expressing FLAG-tagged RIPK3 following 24 hours of treatment with NCM and DSS cross-linking (E) or bead-mediated FLAG pulldown (F). (G) qRT-PCR profiling of indicated genes in astrocytes of indicated genotypes treated for 24 hours with B/B homodimerizer. (H) Schematic of experimental design for neurotoxicity assay in which astrocytes expressing (or not) RIPK3-2xFV were treated with B/B homodimerizer or vehicle solution for 24 hours. Astrocytes were then washed and media replaced for another 24 hours. ACM was then transferred to WT primary neurons for cell viability measurement. (I) CellTiter-Glo analysis of viability in WT neurons 24 hours following treatment with ACM derived from indicated conditions. n = 4 cultures/per group in all panels. Data are represented as mean values with scatterplots depicting individual biological replicate values. All comparisons via 2-way ANOVA with Holm-Šídák multiple-comparison test. *P < 0.05, **P < 0.01, ***P < 0.001. A, C, and H were created with Biorender.com.
Figure 7
Figure 7. DAMP signaling via RAGE drives inflammatory activation in midbrain astrocytes.
(A) Schematic of experimental design for DAMP transfer experiments. Astrocytes were treated with NCM in the presence of FPS-ZM1 or control for 24 hours prior to qRT-PCR profiling. (B) qRT-PCR profiling of indicated genes in astrocytes treated for 24 hours with NCM derived from indicated conditions. (C and D) ELISA analysis of HMGB1 protein levels in supernatants of SH-SY5Y cells treated with MPP+ (C) or midbrain homogenates from WT mice 3 days post-MPTP treatment (D). n = 4–8 replicates per time point in C. (E) qRT-PCR profiling of indicated genes in human midbrain astrocytes treated for 24 hours with NCM derived from indicated conditions in the presence of neutralizing antibodies against HMGB1 (1 μg/mL) or an isotype control antibody. (FH) qRT-PCR analysis of indicated genes in WT murine midbrain astrocytes (F) or midbrain astrocytes derived from indicated genotypes (G and H) 24 hours following treatment with recombinant HMGB1 (F and G) or S100β (H). (I) qRT-PCR analysis of indicated genes in ACSA2+ astrocytes sorted via MACS from brains of mice 24 hours following ICV administration of HMGB1 (200 ng). n = 3 cultures/group (B), 8 cultures/group for viability data and 2–4 cultures per group for HMGB1 expression (C), 5–6 mice/group (D), 6 cultures/group (E), 4 cultures/group (F and G), and 4 mice/group (H). Data are represented as mean values with scatterplots depicting individual biological replicate values, except in C, where data are represented as mean values ± SEM. Comparisons via 2-tailed t test (D) or 2-way ANOVA with Holm-Šídák multiple-comparison test (B and EI). *P < 0.05, **P < 0.01, ***P < 0.001. A was created with Biorender.com.
Figure 8
Figure 8. Activation of RIPK3 by DAMP signaling drives pathogenic functional changes in midbrain astrocytes.
(A) Schematic of experimental design for neurotoxicity experiments. Astrocytes were treated with NCM in the presence of FPS-ZM1 or control for 24 hours. ACM was then transferred to fresh SH-SY5Y cells for cell viability measurement. (B) CellTiter-Glo analysis of SH-SY5Y viability 24 hours following treatment with ACM derived from indicated conditions. (C) Schematic showing treatment of primary human midbrain astrocytes with recombinant DAMPs for 24 hours prior to transfer of ACM to SH-SY5Y cultures. (D and E) CellTiter-Glo analysis of SH-SY5Y viability 24 hours following treatment with ACM derived from indicated conditions. (F) Schematic showing generation and transfer of CSFE-labeled neuronal debris to midbrain astrocytes treated with recombinant DAMPs with or without GSK872. Astrocytes were cultured in the presence of labeled debris for 24 hours. (G and H) Representative histograms (G) and quantification of GMFI (H) of CSFE signal in astrocytes treated as in F. (I) GMFI of CSFE internalization in astrocytes treated as in F but with NCM rather than recombinant DAMPs and FPS-ZM1 rather than GSK872. n = 3 cultures/group in all panels. Data are represented as mean values with scatterplots depicting individual biological replicate values. All comparisons via 2-way ANOVA with Holm-Šídák multiple-comparison test. **P < 0.01, ***P < 0.001. A, C, and F were created with Biorender.com.

Update of

References

    1. Gilhus NE, Deuschl G. Neuroinflammation - a common thread in neurological disorders. Nat Rev Neurol. 2019;15(8):429–430. doi: 10.1038/s41582-019-0227-8. - DOI - PubMed
    1. Boyd RJ, et al. Neuroinflammation represents a common theme amongst genetic and environmental risk factors for Alzheimer and Parkinson diseases. J Neuroinflammation. 2022;19(1):223. doi: 10.1186/s12974-022-02584-x. - DOI - PMC - PubMed
    1. Giovannoni F, Quintana FJ. The role of astrocytes in CNS inflammation. Trends Immunol. 2020;41(9):805–819. doi: 10.1016/j.it.2020.07.007. - DOI - PMC - PubMed
    1. Endo F, et al. Molecular basis of astrocyte diversity and morphology across the CNS in health and disease. Science. 2022;378(6619):eadc9020. doi: 10.1126/science.adc9020. - DOI - PMC - PubMed
    1. Patani R, et al. Functional roles of reactive astrocytes in neuroinflammation and neurodegeneration. Nat Rev Neurol. 2023;19(7):395–409. doi: 10.1038/s41582-023-00822-1. - DOI - PubMed

MeSH terms

Substances