. 2024 May 7;9(10):e176166.
doi: 10.1172/jci.insight.176166.

Differential effects of FcRn antagonists on the subcellular trafficking of FcRn and albumin

Affiliations

Differential effects of FcRn antagonists on the subcellular trafficking of FcRn and albumin

Guanglong Ma et al. JCI Insight. .

Abstract

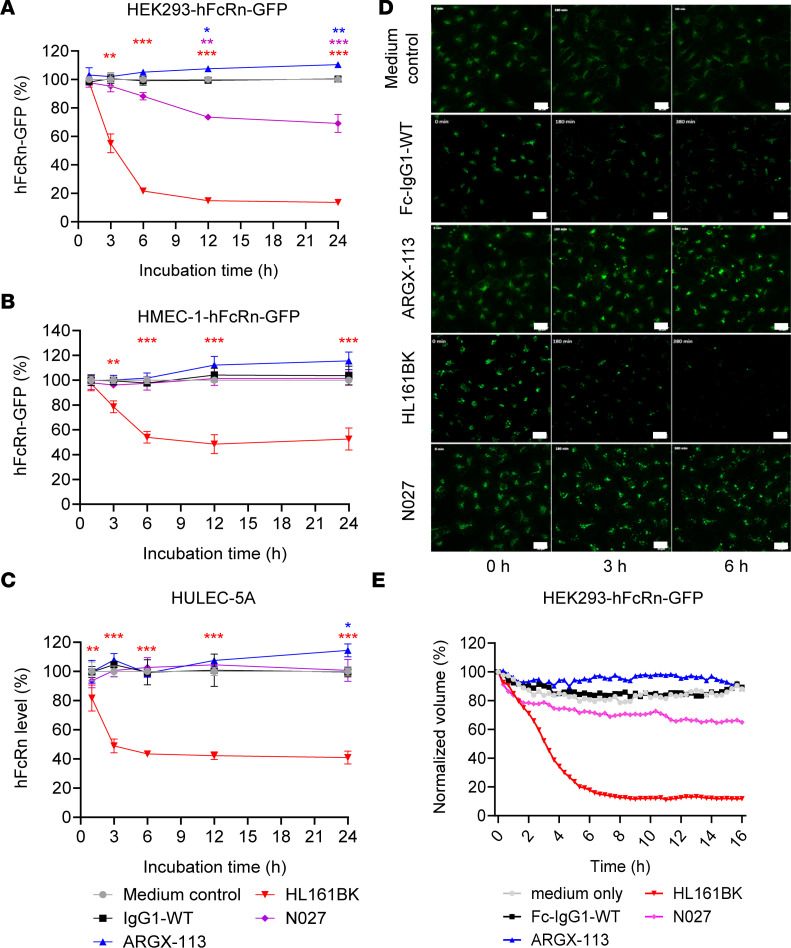
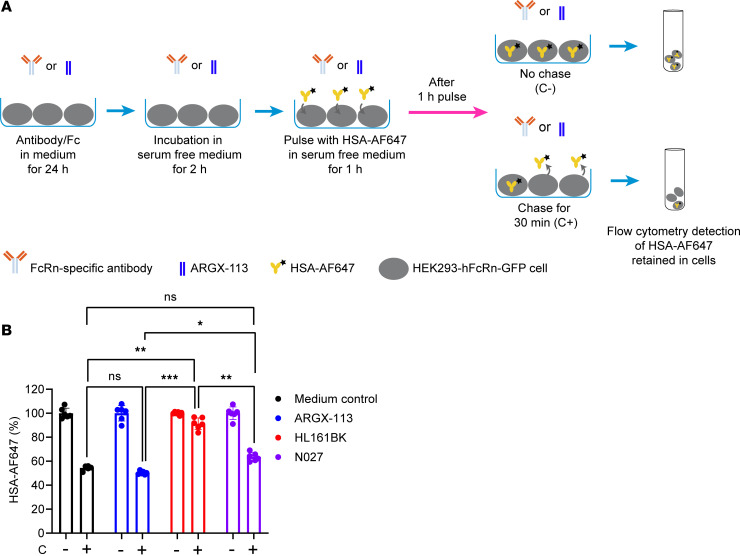
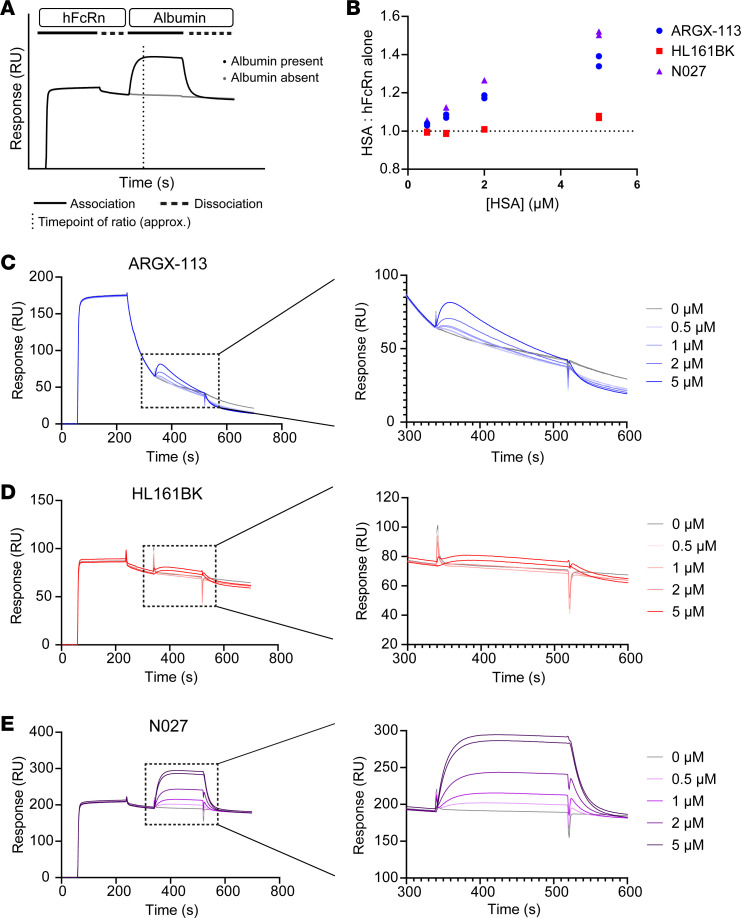
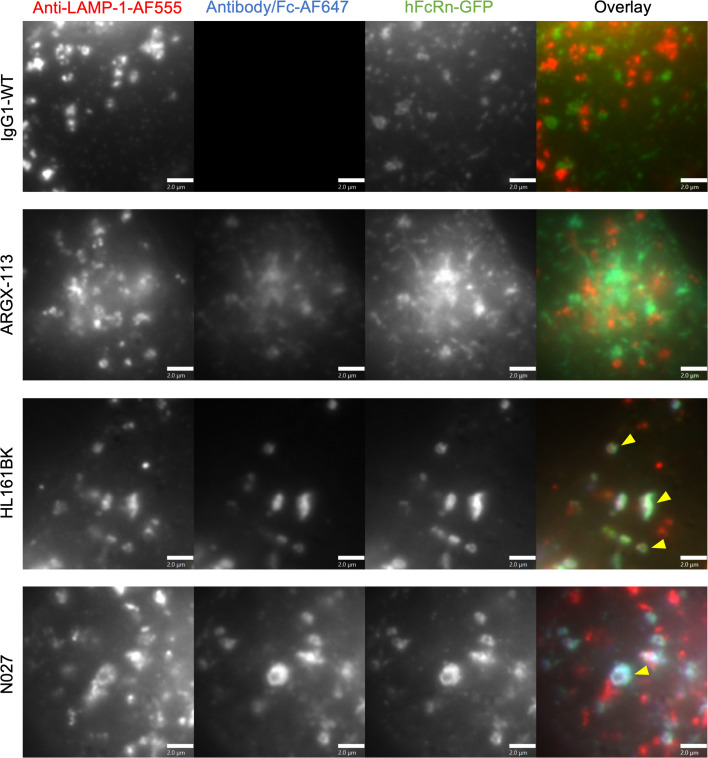
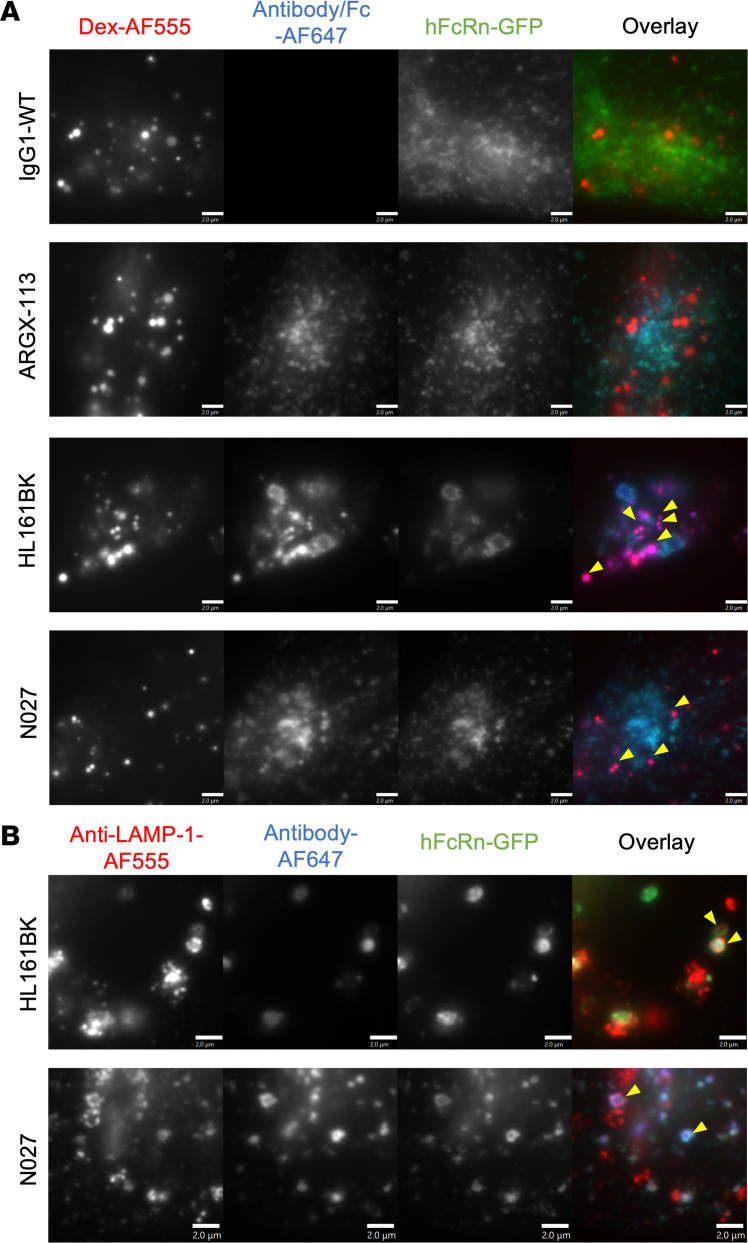
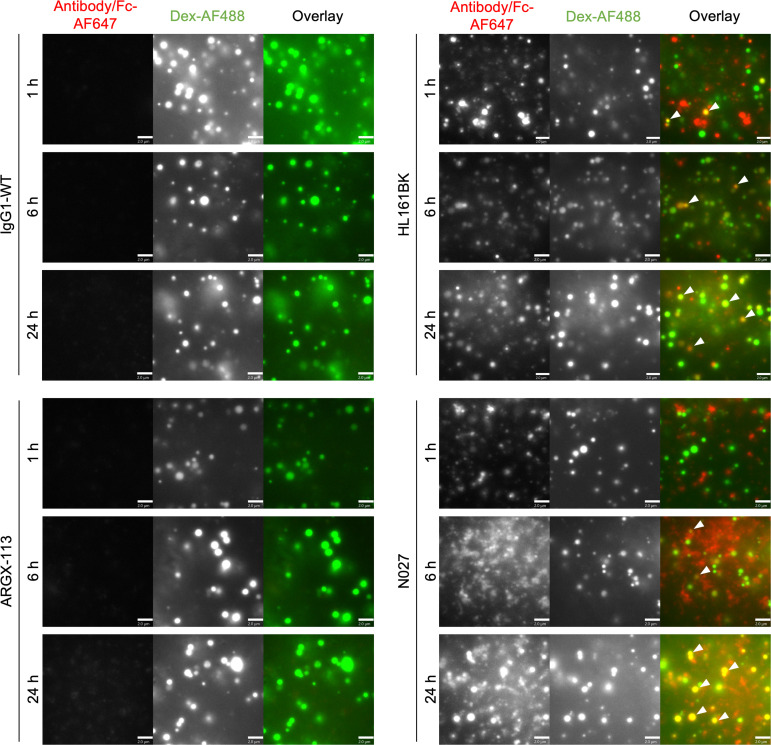
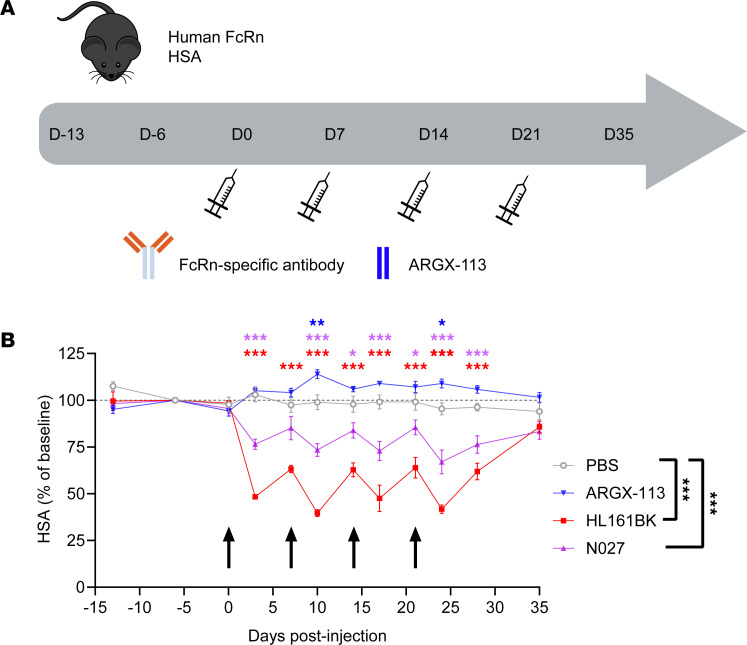
The homeostasis of IgG is maintained by the neonatal Fc receptor, FcRn. Consequently, antagonism of FcRn to reduce endogenous IgG levels is an emerging strategy for treating antibody-mediated autoimmune disorders using either FcRn-specific antibodies or an engineered Fc fragment. For certain FcRn-specific antibodies, this approach has resulted in reductions in the levels of serum albumin, the other major ligand transported by FcRn. Cellular and molecular analyses of a panel of FcRn antagonists have been carried out to elucidate the mechanisms leading to their differential effects on albumin homeostasis. These analyses have identified 2 processes underlying decreases in albumin levels during FcRn blockade: increased degradation of FcRn and competition between antagonist and albumin for FcRn binding. These findings have potential implications for the design of drugs to modulate FcRn function.

Keywords: Autoimmune diseases; Autoimmunity; Immunoglobulins; Immunology.


Figures

Figure 1
Figure 1. Analyses of hFcRn levels in FcRn antagonist–treated cell lines.
hFcRn-expressing cell lines were incubated with 50 nM FcRn antagonist or medium alone (as a control) for the indicated times. The levels of GFP fluorescence were determined using flow cytometry in stably transfected HEK293-hFcRn-GFP (A) and transiently transfected HMEC-1-hFcRn-GFP (B) cells. Endogenous hFcRn levels in HULEC-5A cells (C) were assessed by fixing and permeabilizing the cells before staining with a fluorescently labeled Fab fragment specific for FcRn (Synt002-Fab-AF647) and determining AF647 levels using flow cytometry. At each time point, the MFIs are normalized to the corresponding medium control. These data are combined from 2 independent experiments, with triplicate samples in each experiment. Statistical analysis was performed with a linear mixed model, and significant differences compared with medium control are denoted: *P ≤ 0.05, **P ≤ 0.01, ***P ≤ 0.001. Error bars indicate the standard deviation of the mean. GFP levels over the 16-hour incubation with 500 nM of each FcRn antagonist were also monitored in HEK293-hFcRn-GFP cells using live-cell microscopy on a confocal spinning disk system (ZEISS). (D and E) GFP fluorescence is presented as maximum intensity projections at 0, 3, and 6 hours (D) and as normalized volume (sum of voxels) relative to t0 (E). The data shown for the live-cell imaging are representative of 3 independent experiments. GFP is pseudocolored green. Scale bars = 20 μm.
Figure 2
Figure 2. Effects of FcRn antagonists on recycling of HSA by HEK293-hFcRn-GFP cells.
HEK293-hFcRn-GFP cells were incubated with 50 nM FcRn antagonist or medium for 24 hours. The cells were then incubated in serum-free medium for 2 hours, pulsed with 250 μg/mL AF647-labeled HSA (HSA-AF647) in serum-free medium for 1 hour, washed, and chased in serum-free medium for 0 (C-) or 30 minutes (C+) at 37°C in a 5% CO2 incubator. The cell-associated HSA-AF647 levels following the indicated treatments were determined using flow cytometry. (A) Schematic illustration of HSA recycling assay. (B) Data normalized against pulse-only levels (represented as 100%). These data are combined from 2 independent experiments, with triplicate samples in each experiment. One-way ANOVA was used for statistical analysis. Statistically significant differences are shown as *P ≤ 0.05, **P ≤ 0.01, ***P ≤ 0.001. Error bars indicate the standard deviation of the mean.
Figure 3
Figure 3. Analyses of competition between FcRn antagonists and HSA for binding to FcRn.
hFcRn was injected at a concentration of 350 nM at pH 6.0 across flow cells coupled with FcRn antagonists. Following a brief dissociation period, HSA at concentrations of 0, 0.5, 1, 2, or 5 μM was injected at pH 6.0. The ability of hFcRn to simultaneously bind to HSA and antagonist was evaluated by calculating the maximum ratio of responses (RU) between each HSA injection and PBS-only control. (A) Schematic representation of the assay based on the interaction of N027, hFcRn, and albumin. The dotted vertical line approximates the point at which the largest ratios were found. (B) Representative data for ratios of signals for HSA/PBS only. Each injection was carried out in duplicate, and the results are representative of 2 independent experiments. Sensorgrams are shown for ARGX-113 (C), HL161BK (D), and N027 (E) in full (left panels) and with the highlighted regions containing the HSA injections expanded (right panels).
Figure 4
Figure 4. Late endosomal/lysosomal trafficking analysis in HEK293-hFcRn-GFP cells.
HEK293-hFcRn-GFP cells were incubated with 50 nM AF647-labeled FcRn antagonist or IgG1-WT (control) for 3 hours. Following incubation, cells were fixed and permeabilized, and detection of late endosomes/lysosomes was carried out using anti–LAMP-1 antibody followed by AF555-labeled goat anti-mouse IgG conjugate. Yellow arrowheads indicate the detection of hFcRn-GFP and AF647 antagonists in anti–LAMP-1–positive compartments. Images for the AF555 channel were adjusted for visualization. Data are representative of 2 independent experiments, each consisting of at least 2 dishes per condition, and at least 6 images for each dish. AF555, AF647, and GFP are pseudocolored red, blue, and green, respectively. Each image represents part of a single cell. Scale bars = 2 μm.
Figure 5
Figure 5. Late endosomal/lysosomal trafficking analyses in HMEC-1-hFcRn-GFP cells.
(A) HMEC-1-hFcRn-GFP cells were pulsed (1 hour) and chased (6 hours) with 500 μg/mL AF555-labeled dextran (Dex-AF555). Following the 1-hour pulse, cells were incubated with 50 nM AF647-labeled FcRn antagonists or IgG1-WT (control) for 6 hours (i.e., the 6-hour chase of dextran and incubation of FcRn antagonists overlapped). Following incubation, cells were washed, fixed, and imaged. Images were adjusted for the AF555 channel for visualization. Yellow arrowheads indicate the detection of HL161BK/N027-AF647 in dextran-positive compartments. (B) HMEC-1-hFcRn-GFP cells were incubated with 50 nM AF647-labeled HL161BK or N027 for 6 hours. Cells were subsequently fixed and permeabilized, and detection of late endosomes/lysosomes was carried out using anti–LAMP-1 antibody followed by AF555-labeled goat anti-mouse IgG conjugate. Yellow arrowheads indicate the detection of HL161BK/N027 and hFcRn-GFP in anti–LAMP-1–positive compartments. Data are representative of 2 independent experiments, each consisting of 2 dishes per condition, and at least 6 images from each dish. AF555, AF647, and GFP are pseudocolored red, blue, and green, respectively. Each image represents part of a single cell. Scale bars = 2 μm.
Figure 6
Figure 6. Lysosomal trafficking analyses in HULEC-5A cells.
HULEC-5A cells were incubated with 50 nM AF647-labeled FcRn antagonist or an IgG1-WT control for 1, 6, and 24 hours. During these incubations, cells were pulsed (1 hour) and chased (6 hours) with 500 μg/mL Dex-AF488. Following incubation, cells were washed, fixed, and imaged. White arrowheads in the panels indicate the detection of AF647-labeled HL161BK or N027 in dextran-positive compartments. Images were adjusted for the AF488 channel for visualization. Data are representative of 2 independent experiments, each consisting of 2 dishes per condition, and at least 6 images for each dish. AF647 and AF488 are pseudocolored red and green, respectively. Each image represents part of a single cell. Scale bars = 2 μm.
Figure 7
Figure 7. Effects of FcRn antagonists on HSA levels in mice humanized to express hFcRn and HSA.
Female or male 14- to 15-week-old Albumus Rag1-deficient (KO) mice were IP injected with antagonist (100 mg/kg for N027 or HL161BK, n = 5 per treatment group; 35 mg/kg for ARGX-113, n = 8) or PBS (n = 3) on days 0, 7, 14, and 21. We collected 20 μL blood samples to establish baseline levels of endogenous HSA on days –13 and –6 (predose). We collected 20 μL blood samples from each mouse 1 hour after each injection and samples on days 3, 10, 17, 24, 28, and 35. HSA concentrations were assessed by ELISA. (A) Schematic representation of dosing and sample collection. (B) HSA levels normalized to day –6; black arrows indicate days of IP injections. Data for PBS, HL161BK, and N027 are representative of 2 individual experiments (n = 3 for PBS, n = 5 for HL161BK and N027 in each experiment); data for ARGX-113 (n = 8) are from 1 experiment. Statistical analysis for each day was performed with a longitudinal model, and significant differences compared with the PBS control are denoted above each time point: *P ≤ 0.05, **P ≤ 0.01, ***P ≤ 0.001. One-way ANOVA with Dunnett’s multiplicity adjustment was used for the analysis of the overall average percentage changes in HSA levels from baseline (PBS control; D0–D35) for the individual mouse profiles over time, summarized as AUC (significant differences denoted on the right of the key). Error bars indicate the standard error of the mean.

References

    1. Simister NE, Mostov KE. An Fc receptor structurally related to MHC class I antigens. Nature. 1989;337(6203):184–187. doi: 10.1038/337184a0. - DOI - PubMed
    1. Simister NE, Rees AR. Isolation and characterization of an Fc receptor from neonatal rat small intestine. Eur J Immunol. 1985;15(7):733–738. doi: 10.1002/eji.1830150718. - DOI - PubMed
    1. Kim JK, et al. Localization of the site of the murine IgG1 molecule that is involved in binding to the murine intestinal Fc receptor. Eur J Immunol. 1994;24(10):2429–2434. doi: 10.1002/eji.1830241025. - DOI - PubMed
    1. Raghavan M, et al. Analysis of the pH dependence of the neonatal Fc receptor/immunoglobulin G interaction using antibody and receptor variants. Biochemistry. 1995;34(45):14649–14657. doi: 10.1021/bi00045a005. - DOI - PubMed
    1. Chaudhury C, et al. The major histocompatibility complex-related Fc receptor for IgG (FcRn) binds albumin and prolongs its lifespan. J Exp Med. 2003;197(3):315–322. doi: 10.1084/jem.20021829. - DOI - PMC - PubMed

Substances