

A Genome-wide Association Study of Susceptibility to Upper Urinary Tract Infections
- PMID: 38713594
- PMCID: PMC11646603
- DOI: 10.1093/infdis/jiae231
A Genome-wide Association Study of Susceptibility to Upper Urinary Tract Infections
Abstract
Background: Our goal was to identify genetic and modifiable risk factors for upper urinary tract infections (UTIs).
Methods: We used data from UK Biobank, the Trøndelag Health Study, and the Michigan Genomics Initiative to conduct genome-wide association studies and sex-stratified analyses on upper UTI. Mendelian randomization (MR) analyses were conducted to examine potential causal relationships between cardiometabolic risk factors and upper UTIs.
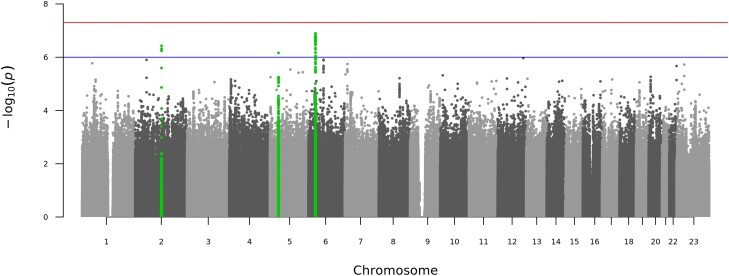
Results: One genome-wide significant (P ≤ 5E-08) locus was associated with the susceptibility to upper UTI, located near TSN in the female-only analysis. Additionally, we identified suggestive (P ≤ 5E-06) loci near DNAI3 for females, SCAMP1-AS1 for males, and near TSN, LINC00603, and HLA-DQA2 for both sexes. In MR analyses, higher genetically predicted lifetime smoking scores were associated with an increased risk of developing upper UTI for females and both sexes (odds ratio [OR], 4.84, P = 4.50E-06 and OR, 2.79, P = 3.02E-05, respectively).
Conclusions: We found that genetic variants near TSN was associated with the risk of upper UTIs among females. In addition, we found several genetic loci with suggestive associations with the risk of upper UTIs. Finally, MR analyses found smoking to be a potential causal risk factor for upper UTIs.
Keywords: Mendelian randomization; genome-wide association study; pyelonephritis; smoking; upper urinary tract infection.
© The Author(s) 2024. Published by Oxford University Press on behalf of Infectious Diseases Society of America.
Conflict of interest statement
Potential conflicts of interest. All authors: No reported conflicts. All authors have submitted the ICMJE Form for Disclosure of Potential Conflicts of Interest. Conflicts that the editors consider relevant to the content of the manuscript have been disclosed.
Figures


References
-
- Zeng Z, Zhan J, Zhang K, Chen H, Cheng S. Global, regional, and national burden of urinary tract infections from 1990 to 2019: an analysis of the Global Burden of Disease Study 2019. World J Urol 2022; 40:755–63. - PubMed
-
- Foxman B. The epidemiology of urinary tract infection. Nat Rev Urol 2010; 7:653–60. - PubMed
-
- Lundstedt A-C, Leijonhufvud I, Ragnarsdottir B, Karpman D, Andersson B, Svanborg C. Inherited susceptibility to acute pyelonephritis: a family study of urinary tract infection. J Infect Dis 2007; 195:1227–34. - PubMed
-
- Stauffer CM, van der Weg B, Donadini R, Ramelli GP, Marchand S, Bianchetti MG. Family history and behavioral abnormalities in girls with recurrent urinary tract infections: a controlled study. J Urol 2004; 171:1663–5. - PubMed
MeSH terms
Grants and funding
LinkOut - more resources
Full Text Sources
Medical
Research Materials
