. 2024 May 14;121(20):e2312855121.
doi: 10.1073/pnas.2312855121. Epub 2024 May 7.

Tumor-neutrophil cross talk orchestrates the tumor microenvironment to determine the bladder cancer progression

Affiliations

Tumor-neutrophil cross talk orchestrates the tumor microenvironment to determine the bladder cancer progression

Weiqiang Jing et al. Proc Natl Acad Sci U S A. .

Abstract

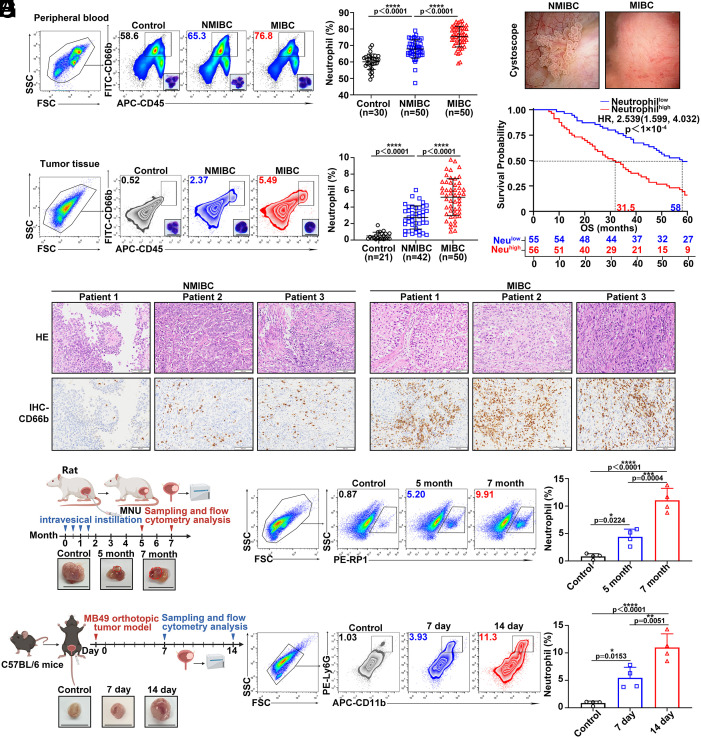
The immune landscape of bladder cancer progression is not fully understood, and effective therapies are lacking in advanced bladder cancer. Here, we visualized that bladder cancer cells recruited neutrophils by secreting interleukin-8 (IL-8); in turn, neutrophils played dual functions in bladder cancer, including hepatocyte growth factor (HGF) release and CCL3highPD-L1high super-immunosuppressive subset formation. Mechanistically, c-Fos was identified as the mediator of HGF up-regulating IL-8 transcription in bladder cancer cells, which was central to the positive feedback of neutrophil recruitment. Clinically, compared with serum IL-8, urine IL-8 was a better biomarker for bladder cancer prognosis and clinical benefit of immune checkpoint blockade (ICB). Additionally, targeting neutrophils or hepatocyte growth factor receptor (MET) signaling combined with ICB inhibited bladder cancer progression and boosted the antitumor effect of CD8+ T cells in mice. These findings reveal the mechanism by which tumor-neutrophil cross talk orchestrates the bladder cancer microenvironment and provide combination strategies, which may have broad impacts on patients suffering from malignancies enriched with neutrophils.

Keywords: IL-8; bladder cancer; c-Fos; neutrophil; urine biomarker.


Conflict of interest statement

Competing interests statement:The authors declare no competing interest.

Figures

Fig. 1.
Fig. 1.
Neutrophil enrichment in bladder cancer associated with disease progression and poor patient survival. (A and B) Gating strategy, representative plots and quantification diagrams of human CD45+CD66b+ neutrophils in peripheral blood and tumor tissue from NMIBC and MIBC patients. The images of neutrophils were processed with the Wright-Giemsa staining to define nuclear morphology. (Scale bar, 10 μm.) Control blood samples were obtained from healthy donors. Control tissues were obtained from normal bladder tissues adjacent to tumors in bladder cancer patients with total cystectomy. (C) Cystoscopic view of the bladder tumor from NMIBC and MIBC patients. (D) Hematoxylin and eosin staining (H&E) and IHC (CD66b for neutrophils) staining of bladder tumor samples from NMIBC and MIBC patients (3 representative patients). (Scale bar, 100 μm.) (E) Kaplan–Meier survival curve for overall survival of patients with MIBC stratified by neutrophil percentage in tumor tissue. (n = 55 patients with neutrophil low density in tumor; and n = 56 patients with neutrophil high density in tumor; median cutoff, 5.8% neutrophils in tumor tissue). (F) Schematic of the in vivo assay corresponding to rat carcinogen-induced bladder cancer model establishment and sampling (Upper). Representative images showing the bladder tumors (red dashed lines) at indicated time points (Bottom). (Scale bar, 1 cm.) (G) Gating strategy, representative plots (Left) and quantification graph (Right) of RP1+ neutrophils in bladder tumor from rat model (n = 4). (H) Schematic of the in vivo assay corresponding to mouse MB49 orthotopic bladder cancer model establishment and sampling (Upper). Representative images showing the bladder tumors at time points (Bottom). (Scale bar, 1 cm.) (I) Gating strategy, representative plots (Left) and quantification graph (Right) of CD11b+Ly6G+ neutrophils in bladder tumor from the mouse model. *P < 0.05, **P < 0.01, ***P < 0.001, ****P < 0.0001. Statistical values were calculated using one-way ANOVA (A, B, G, and I) or log-rank (Mantel–Cox) test (E).
Fig. 2.
Fig. 2.
Bladder cancer cells recruit neutrophils through IL-8. (A) Schematic of neutrophil under-agarose migration assay. (B) Chemotaxis of human neutrophils toward T24 bladder cancer cells versus culture medium for 2 h. (Scale bar, 150 μm.) (C) Chemotaxis of mouse neutrophils toward MB49 bladder cancer cells versus culture medium for 12 h. (Scale bar, 150 μm.) (D) Schematic of the experimental setup for the in vivo neutrophil chemotaxis model in zebrafish. (E) Representative images of zebrafish after injection of T24 bladder cancer cells versus PBS. (Scale bar, 150 μm.) (F) Time-lapse confocal images of T24 bladder cancer cells (green)-mediated chemotaxis of neutrophils (red) in zebrafish at 5 time points. (Scale bar, 150 μm.) (G) Representative image and quantification of human chemokine array from T24 cell culture supernatant. (H) Representative image and quantification of mouse chemokine array from MB49 cell culture supernatant. (I) Chemotaxis of human neutrophils toward IL-8high/low human primary bladder cancer cells for 2 h (Left). Cell displacement and full cell tracks were shown after 2 h (Right). (Scale bar, 150 μm.) The Bottom panel shows velocities with representative cell shapes at 2 h of neutrophil chemotaxis. (J) Migration of human neutrophils with/without SX-682 treatment toward IL-8high human primary bladder cancer cells for 2 h (Left). Cell displacement and full cell tracks were shown after 2 h (Right). (Scale bar, 150 μm.) The Bottom panel shows velocities with representative cell shapes at 2 h of neutrophil chemotaxis. (K) Representative images of zebrafish after injection of IL-8high/low human primary tumor cells. (Scale bar, 150 μm.) (L) Representative plots (Left) and quantification (Right) of human CD45+CD66b+ neutrophils in human tumor tissue from IL-8low (n = 46) and IL-8high (n = 46) bladder cancer patients. (M) Schematic of tumor growth experiment where C57BL/6 mice were inoculated with MB49 bladder cancer cells and treated with SX-682. (N) Representative images of mouse bladder tumors at day 14 after inoculation. (Scale bar, 1 cm.) (O) Representative plots (Left) and quantification (Right) of CD11b+Ly6G+ neutrophils in bladder tumor-bearing mice treated with SX-682 versus control (n = 4). Means ± SD. ***P < 0.001, ****P < 0.0001. Statistical values were calculated using Student's t test (L and O).
Fig. 3.
Fig. 3.
HGF secreted by neutrophils promotes the proliferation of bladder cancer. (A) Confocal microscopy images (Left) and diameter quantification (Right) of MB49 spheroid and MB49-neutrophil cocultured spheroid (n = 4). MB49 bladder cancer cells were transfected with red fluorescent protein (RFP) label. Neutrophils were labeled with CFDA-SE dye (green). (Scale bar, 150 μm.) (B) Scheme of Ly6GDTR transgenic mouse model which expressed DTR in Ly6G+ cells. (C) Schematic of tumor growth experiment of wild type (WT) and Ly6GDTR mice inoculated with MB49 bladder cancer cells and treated with DT. (D) Bioluminescence images (Left) and statistical graph (Right) of MB49 tumor-bearing WT and Ly6GDTR mice treated with DT (n = 5). (E) Representative images of bladder tumors (Left) and tumor weight quantification (Right) at day 22 after inoculation (n = 6). (Scale bar, 1 cm.) (F) H&E staining sections and ultrasound images of bladder tumors (red dashed lines). (Scale bar for H&E, 500 μm; Scale bar for ultrasound, 2 mm.) (G) Representative plots (Left) and quantification (Right) of CD11b+Ly6G+ neutrophils in bladder tumor from mice treated with DT (n = 4). (H) Representative image and quantification of mouse cytokine array from supernatant derived from neutrophils sorted from bladder cancer tissue and cultured for 24 h in vitro. (I) Confocal microscopy images (Left) and diameter quantification (Right) of Mock/MET-KO MB49 cell spheroids cocultured with neutrophils (n = 4). (J) Confocal microscopy images (Left) and diameter quantification (Right) of spheroids that MB49 cells with/without capmatinib treatment cocultured with neutrophils (n = 4). (K) Scheme of the Ly6g-cre; HGFflox/flox transgenic mouse model. (L) Representative images of bladder tumors (Left) and tumor weight quantification (Right) (n = 6). (M) Representative IF images of cytokeratin (CK7, green), Ki67 (red), and DAPI (blue) stained histological sections of bladder tumors. (Scale bar, 20 μm.) (N) H&E staining and ultrasound images of bladder tumors (red dashed lines). (Scale bar for H&E, 500 μm; Scale bar for ultrasound, 2 mm.) (O) Confocal microscopy images (Left) and diameter quantification (Right) of spheroids that MB49 cells cocultured with WT/HGF-KO neutrophils (n = 4). Means ± SD. ***P < 0.001, ****P < 0.0001. Statistical values were calculated using one-way ANOVA (E, G, I, J, L, and O) or two-way ANOVA (D) or Student's t test (A).
Fig. 4.
Fig. 4.
c-Fos mediates the increase of IL-8 secretion in bladder cancer cells induced by HGF. (A) IL-8 mRNA expression in T24 treated with HGF (100 and 500 ng/mL) (n = 6). (B) Representative histogram (Left) and quantification (Right) showing the protein levels of IL-8 in the supernatant of T24 cells treated with HGF (100 and 500 ng/mL) (n = 4). (C) Differential expression profile between T24 clusters and T24 treated with HGF clusters (n = 3). (D) Radar plot showing 26 up-regulated IL-8-transcription factor–related gene expression between T24 clusters and T24 treated with HGF clusters. (E) Representative histogram (Left) and quantification (Right) showing the protein levels of IL-8 in the supernatant of T24 cells transfected with different siRNAs under HGF stimulation (n = 4). NS: nonsilencing control. (F) IL-8 mRNA levels in T24 cells treated with HGF and T-5224 (n = 6). (G) Representative histogram (Left) and quantification (Right) showing the protein levels of IL-8 in the supernatant of T24 cells treated with HGF and T-5224 (n = 4). (H) c-Fos mRNA levels in T24 cells treated with HGF (100 and 500 ng/mL) (n = 6). (I) c-Fos protein expression from T24 cells treated with HGF (100 and 500 ng/mL). (J) IGV tracks showing the ChIP-seq enrichment signals at IL-8 (CXCL8) promoter in T24 cells treated with HGF (Left). The motif visualized the corresponding nucleotide sequence encompassing the predicted c-Fos binding site in the CXCL8 gene (Right). (K) The expression levels of p-MET, t-MET, p-ERK1/2, and t-ERK1/2 from T24 cells treated with HGF (100 and 500 ng/mL). (L) The expression levels of p-ERK1/2, t-ERK1/2, and c-Fos from T24 cells treated with HGF and ravoxertinib. (M) Representative histogram (Left) and quantification (Right) showing the protein levels of IL-8 in the supernatant of T24 treated with HGF and ravoxertinib (n = 4). (N) Representative IHC (c-Fos and CD66b) images of human bladder tumor samples from c-Foslow and c-Foshigh bladder cancer patients. (Scale bar, 100 μm.) (O) Representative plots (Left) and quantification (Right) of CD45+CD66b+ neutrophils in human bladder tumor from c-Foslow (n = 46) and c-Foshigh (n = 46) bladder cancer patients. (P) Kaplan–Meier curves of bladder cancer patients stratified based on high versus low expression of c-Fos gene signature. Data were derived from the Human Protein Atlas Database. (Q) H&E staining and ultrasound images of bladder tumors (red dashed lines) from MB49 tumor-bearing mice treated with vehicle or T-5224. (Scale bar for H&E, 500 μm; Scale bar for ultrasound, 2 mm.) (R) Representative images of bladder tumors (Left) and tumor weight quantification (Right) at day 22 after inoculation (n = 6). (Scale bar, 1 cm.) (S) Representative plots (Left) and quantification (Right) of CD11b+Ly6G+ neutrophils in bladder tumor from MB49 tumor-bearing mice treated with vehicle versus T-5224 (n = 4). (T) Schematics highlighting the major mechanism of this study. Means ± SD. **P < 0.01, ***P < 0.001, ****P < 0.0001. Statistical values were calculated using one-way ANOVA (A, B, EH, M, R, and S) or Student's t test (O) or log-rank (Mantel–Cox) test (P).
Fig. 5.
Fig. 5.
Poor clinical outcome and reduced clinical benefit of ICB associated with elevated uIL-8 in bladder cancer. (A) Expression plot showing that patients were ordered by the expression level of the IL-8 gene using the PrognoScan database. (B) Kaplan–Meier survival curves comparing the high and low expression level of IL-8 in bladder cancer using the PrognoScan database. (C) Kaplan–Meier analysis of the OS for IL-8 high and low expression groups in tumor tissues from mUC patients received atezolizumab treatment (IMvigor210, n = 174 for tIL-8low patients and n = 174 for tIL-8high patients). (D) Kaplan–Meier survival curve for overall survival of patients with MIBC bladder cancer stratified by serum IL-8 (sIL-8) (n = 52 for sIL-8low patients and n = 59 for sIL-8high patients, median cutoff, 21.2 pg/mL). (E) Kaplan–Meier survival curve for overall survival of patients with MIBC bladder cancer stratified by uIL-8 (n = 43 for uIL-8low patients and n = 68 for uIL-8high patients, median cutoff, 500 pg/mL). (F) ROC curve and AUC value between serum and uIL-8 for predicting bladder cancer patient prognosis. ROC = receiver operating characteristic; AUC = area under the ROC curve. (G) Comparison of overall relapse proportion within 1 y after TURBT surgery between sIL-8low (n = 30) and sIL-8high (n = 35) patients from high-risk NMIBC patients treated with BCG and anti-PD1 antibody. Median cutoff, 21.2 pg/mL; P = 0.3331. (H) Comparison of overall relapse proportion within 1 y after TURBT surgery between uIL-8low (n = 21) and uIL-8high (n = 44) patients from high-risk NMIBC patients treated with BCG and anti-PD1 antibody. Median cutoff, 500 pg/mL; P = 0.0158. Means ± SD. Statistical values were calculated using log-rank (Mantel–Cox) test (CE) or Chi-square test (G and H).
Fig. 6.
Fig. 6.
Combination of neutrophil targeting and anti-PD1 therapy displays excellent antitumor activity in neutrophil enrichment bladder cancer. (A) Schematic of tumor growth experiment of WT and Ly6GDTR mice inoculated with MB49 followed with DT and anti-PD1 treatment. (B) Bioluminescence images (Left) and statistical graph (Right) of MB49 tumor-bearing WT and Ly6GDTR mice treated with DT and anti-PD1 antibody (n = 5). (C) Representative images (Left) of bladder tumors and tumor weight quantification (Right) at day 22 after inoculation (n = 6). (Scale bar, 1 cm.) (D) Survival curves of WT and Ly6GDTR mice with DT and anti-PD1 treatment (n = 10). (E) H&E staining and ultrasound images of bladder tumors (red dashed lines). (Scale bar for H&E, 500 μm; Scale bar for ultrasound, 2 mm.) (F) Representative plots (Left) and histogram (Right) showing the proportion of CD3+CD8+ T cells in mouse bladder tumors (n = 4). (G) Representative plots (Left) and histogram (Right) showing the proportion of granzyme B+ cells in CD8+ T cells in mouse bladder tumors (n = 4). (H) Representative plots (Left) and histogram (Right) showing the proportion of perforin+ cells in CD8+ T cells in mouse bladder tumors (n = 4). (I) Schematic of tumor growth experiment where C57BL/6 mice were inoculated with MB49 and treated with SX-682 and anti-PD1 antibody. (J) Representative images of bladder tumors (Left) and tumor weight quantification (Right) at day 22 after inoculation (n = 6). (K) Bioluminescence images (Left) and statistical graph (Right) of MB49 tumor-bearing C57BL/6 mice treated with SX-682 and anti-PD1 antibody (n = 5). (L) Kaplan–Meier plot showing overall survival of mice with SX-682 and anti-PD1 treatment (n = 10). **P < 0.01, ***P < 0.001, ****P < 0.0001. Statistical values were calculated using one-way ANOVA (C, FH, and J) or two-way ANOVA (B and K) or log-rank (Mantel–Cox) test (D and L).

References

    1. Patel V. G., Oh W. K., Galsky M. D., Treatment of muscle-invasive and advanced bladder cancer in 2020. CA Cancer J. Clin. 70, 404–423 (2020). - PubMed
    1. Lenis A. T., Lec P. M., Chamie K., Mshs M. D., Bladder cancer: A review. JAMA. 324, 1980–1991 (2020). - PubMed
    1. Cao D., et al. , Retinoic acid-related orphan receptor C regulates proliferation, glycolysis, and chemoresistance via the PD-L1/ITGB6/STAT3 signaling axis in bladder cancer. Cancer Res. 79, 2604–2618 (2019). - PubMed
    1. Hedrick C. C., Malanchi I., Neutrophils in cancer: Heterogeneous and multifaceted. Nat. Rev. Immunol. 22, 173–187 (2022). - PubMed
    1. Szczerba B. M., et al. , Neutrophils escort circulating tumour cells to enable cell cycle progression. Nature 566, 553–557 (2019). - PubMed

Publication types

MeSH terms

LinkOut - more resources