. 2024 May 7;20(5):e1011230.
doi: 10.1371/journal.pgen.1011230. eCollection 2024 May.

Deciphering novel TCF4-driven mechanisms underlying a common triplet repeat expansion-mediated disease

Affiliations

Deciphering novel TCF4-driven mechanisms underlying a common triplet repeat expansion-mediated disease

Nihar Bhattacharyya et al. PLoS Genet. .

Abstract

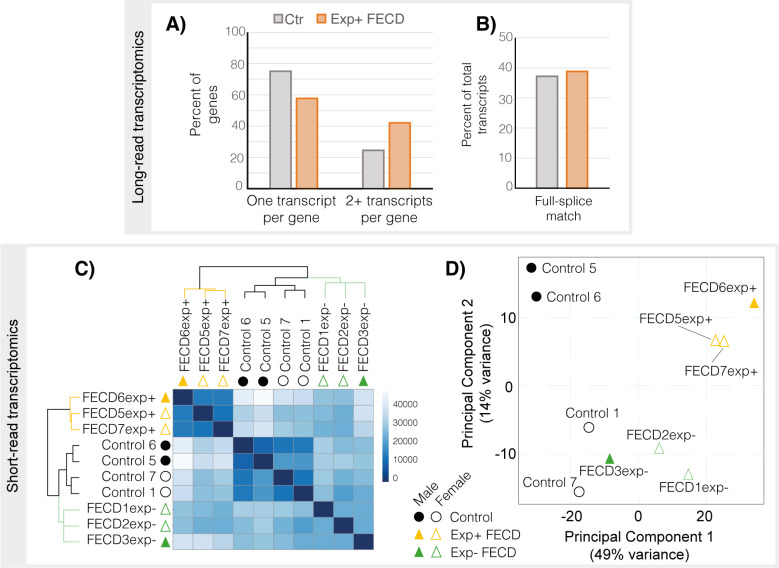
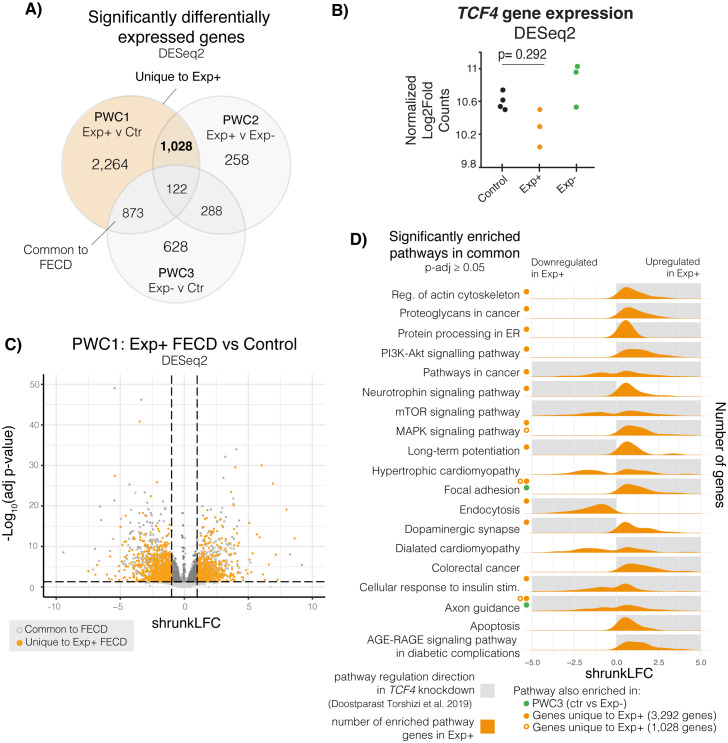
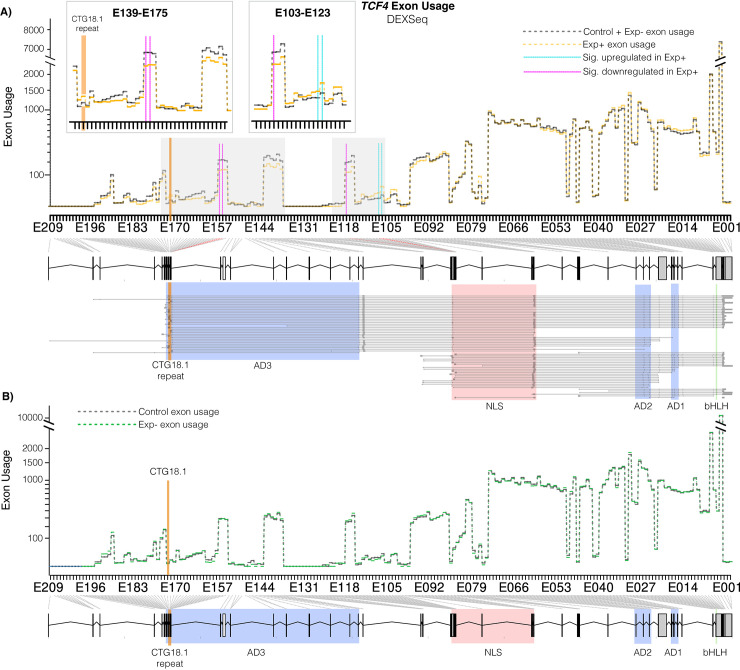
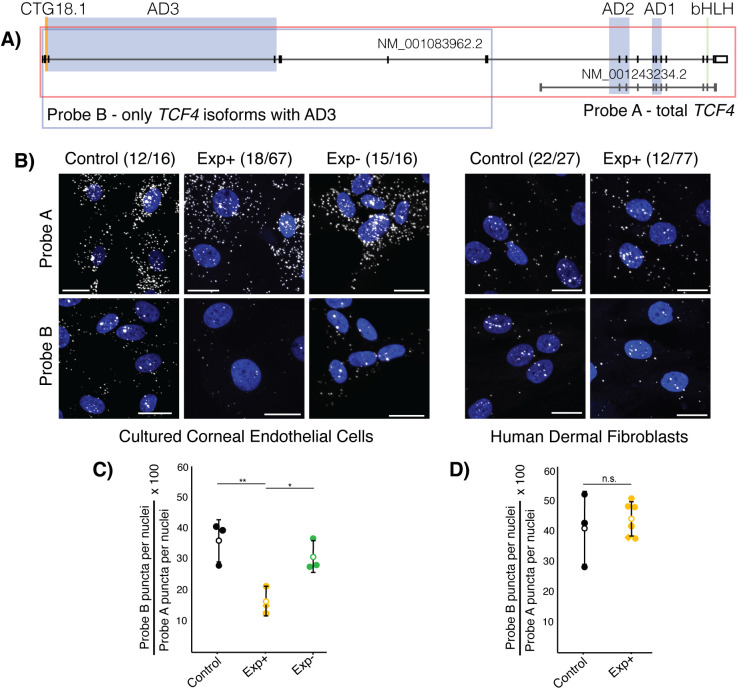
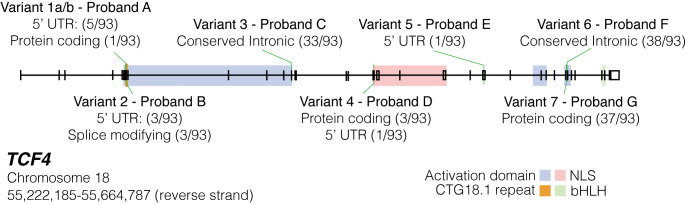
Fuchs endothelial corneal dystrophy (FECD) is an age-related cause of vision loss, and the most common repeat expansion-mediated disease in humans characterised to date. Up to 80% of European FECD cases have been attributed to expansion of a non-coding CTG repeat element (termed CTG18.1) located within the ubiquitously expressed transcription factor encoding gene, TCF4. The non-coding nature of the repeat and the transcriptomic complexity of TCF4 have made it extremely challenging to experimentally decipher the molecular mechanisms underlying this disease. Here we comprehensively describe CTG18.1 expansion-driven molecular components of disease within primary patient-derived corneal endothelial cells (CECs), generated from a large cohort of individuals with CTG18.1-expanded (Exp+) and CTG 18.1-independent (Exp-) FECD. We employ long-read, short-read, and spatial transcriptomic techniques to interrogate expansion-specific transcriptomic biomarkers. Interrogation of long-read sequencing and alternative splicing analysis of short-read transcriptomic data together reveals the global extent of altered splicing occurring within Exp+ FECD, and unique transcripts associated with CTG18.1-expansions. Similarly, differential gene expression analysis highlights the total transcriptomic consequences of Exp+ FECD within CECs. Furthermore, differential exon usage, pathway enrichment and spatial transcriptomics reveal TCF4 isoform ratio skewing solely in Exp+ FECD with potential downstream functional consequences. Lastly, exome data from 134 Exp- FECD cases identified rare (minor allele frequency <0.005) and potentially deleterious (CADD>15) TCF4 variants in 7/134 FECD Exp- cases, suggesting that TCF4 variants independent of CTG18.1 may increase FECD risk. In summary, our study supports the hypothesis that at least two distinct pathogenic mechanisms, RNA toxicity and TCF4 isoform-specific dysregulation, both underpin the pathophysiology of FECD. We anticipate these data will inform and guide the development of translational interventions for this common triplet-repeat mediated disease.


Conflict of interest statement

I have read the journal’s policy and the authors of this manuscript have the following competing interests: AED has previously acted as a paid consultant for Triplet Therapeutics Ltd, LoQus23 Therapeutics Ltd, Design Therapeutics Ltd and had a research collaboration with ProQR Therapeutics. AED’s has an ongoing research collaboration with Prime Medicine.

Figures

Fig 1
Fig 1. Exp+ FECD samples are transcriptomically distinct in both short- and long-read datasets when compared to controls.
A) Bar chart showing proportion of annotated genes in long read transcriptomic dataset with only one transcript detect vs 2 or more transcripts in Control and Exp+ samples. Exp+ long-read samples have a higher proportion of genes with more than one isoform identified. B) Proportion of annotated transcripts with full splice matches. Exp+ FECD and Control samples have similar percentages of full splice matches suggesting additional splicing diversity seen in Exp+ is not predominantly due to aberrant splicing. C) Hierarchical clustering heatmap of sample-to-sample distances within short-read RNA-Seq data. Darker colours denote higher similarities between samples, demonstrating that Exp+ and control are more similar within each subgroup than with other samples. Exp- shows a similar result but is less pronounced, likely due to differences in unidentified underlying genetic causes. D) Principal component plot (PCA) of all short-read samples with sex, disease state and ethnicity as covariates. All three subsets of data cluster separately in the PCA plot. Control samples appear as circles, FECD Exp+ appear as orange triangles, FECD Exp- appear as green triangles. Male individuals are represented as filled shapes while female individuals are outlined.
Fig 2
Fig 2. Differential gene expression analysis on Exp+ FECD, Exp- FECD, and control primary corneal endothelial cell (CEC) transcriptomes.
A) Differential gene expression was assessed via DESeq2. Three pairwise comparisons were conducted: PWC1 (Exp+ vs control), PWC2 (Exp+ vs Exp-), and PWC3 (Exp- vs control). Venn diagrams show overlap of significantly differentially expressed genes (adjusted p-value < 0.05) within these three comparisons. B) Total TCF4 expression showed no significant dysregulation between the different groups. C) Volcano plot shows the distribution of gene expression in Exp+ FECD compared to the control group. Horizontal dotted lines denote the boundary between significance (adjusted p-value < 0.05), whereas vertical dotted lines show a shrunkLFC cutoffs for -1 and 1. Dark grey solid markers show significantly expressed genes with a fold change magnitude greater than 1. Solid orange markers delineate uniquely Exp+ differentially expressed genes. D) Pathways enriched in Exp+ vs Control (g:profiler). Shaded grey boxes show direction of pathway enrichment in TCF4 knockdown models (Doostparast Torshizi et al. 2019) [33]. Green dots show pathways that are significantly enriched in PWC3 as well. Solid orange dots and open orange circle show that pathway enrichment persists in genes unique to Exp+ (1,028 genes and 3,292 genes, respectively).
Fig 3
Fig 3. CTG18.1 expansion-mediated FECD results in alternative TCF4 exon usage within corneal endothelial cells (CECs).
A) Differences in exon usage between control (grey dotted line) and Exp+ (orange dotted line) CECs. Significantly upregulated and downregulated exons are highlighted with blue and red vertical lines, respectively. The location of CTG18.1 is depicted with an orange line. Inset boxes magnify dysregulated regions. A genomic schematic of TCF4 with transcripts aligned is presented below the axis. Key protein domains highlighted (green—basic helix loop helix (bHLH) domain, blue—activation domains (ADs), red—main nuclear localization signal (NLS). B) Differences in exon usage between control (grey dotted line) and Exp- (green dotted line) CECs. No exons were statistically dysregulated.
Fig 4
Fig 4. RNAScope probes targeting TCF4 transcripts demonstrate that longer transcripts containing activation domain 3 (AD3) account for a smaller proportion of total transcripts specifically in Exp+ FECD corneal endothelial cells (CECs).
A) Probe targeting schematic for TCF4. Probe A targets all exons in NM_001083962.2 and visualises total TCF4 transcripts, while Probe B targets only the 5’ exons, excluding those that are contained within shorter transcripts (NM_001243234.2). Probe B visualises the longer subset of AD3-containing transcripts within the cell. CTG18.1 is highlighted in orange. Green bar denotes TCF4 bHLH region, blue regions highlight TCF4 activation domains, red box shows the bipartite TCF4 NLS signal and orange shows the genomic region containing the CTG18.1 repeat. Key domains highlighted (green—basic helix loop helix (bHLH) domain, blue—activation domains (ADs), red—main nuclear localization signal (NLS)). B) Representative confocal images of Exp+, Exp- and control CECs and Exp+ and control fibroblasts with nuclei (blue, DAPI) and TCF4 puncta (visualised with Cy3 but represented here with white). Scale bars represent 20 μm. C) Plotting the proportion of longer AD3-containing TCF4 transcripts in Exp+ (orange), control (black), and Exp- (green) shows that Exp+ have significantly lower proportion of AD3-containing transcripts compared to both control (p = 0.0145) and Exp- (p = 0.0213) CECs, while there is no significant difference between control and Exp- (p = 0.362). D) Plotting the proportion of longer AD3-containing TCF4 transcripts in Exp+ (orange), and control (black) shows that there is no statistically significant (p = 0.61) difference in TCF4 isoform ratios between the two groups. Open circle denotes mean and error bars show standard deviation. Diamond datapoint shows bi-allelic expanded FECD cells. Significance determined with student T-test.
Fig 5
Fig 5. Schematic map of rare and potentially deleterious variants identified in individuals with molecularly unsolved FECD within TCF4, without CTG18.1 expansions.
All 8 rare (minor allele frequency (MAF)<0.005) and potentially pathogenic (CADD>15) variants in 7 Exp- Probands are mapped along TCF4 genomic region and transcriptomic locations contextualised. Proband A variants are found in cis within the proband. Conserved intronic transcripts refer to variants located in intronic regions identified as conserved via Genomic Evolutionary Rate Profiling (GERP) conservation scores on Ensembl. Splice modifying refers to transcripts where the variant identified would induce alternative splicing. Transcript numbers where the variant occurred within introns were not included. UTR: untranslated region. NLS: nuclear localization signal. bHLH: basic helix loop helix.

References

    1. Mathews P, Benbow A, Corcoran K, DeMatteo J, Philippy B, Van Meter W. 2022 Eye Banking Statistical Report—Executive Summary. Eye Bank Corneal Transplant. 2023. Sep;2(3):e0008.
    1. NHSBT. NHS Blood and Transplant Annual Activity Report: Cornea Activity [Internet]. Available from: http://nhsbtdbe.blob.core.windows.net/umbraco-assets-corp/27122/section-...
    1. Matthaei M, Hribek A, Clahsen T, Bachmann B, Cursiefen C, Jun AS. Fuchs Endothelial Corneal Dystrophy: Clinical, Genetic, Pathophysiologic, and Therapeutic Aspects. Annu Rev Vis Sci. 2019;5(1):151–75. doi: 10.1146/annurev-vision-091718-014852 - DOI - PubMed
    1. Fautsch MP, Wieben ED, Baratz KH, Bhattacharyya N, Sadan AN, Hafford-Tear NJ, et al.. TCF4-mediated Fuchs endothelial corneal dystrophy: Insights into a common trinucleotide repeat-associated disease. Prog Retin Eye Res. 2021. Mar 1;81:100883. doi: 10.1016/j.preteyeres.2020.100883 - DOI - PMC - PubMed
    1. Thaung C, Davidson AE. Fuchs endothelial corneal dystrophy: current perspectives on diagnostic pathology and genetics—Bowman Club Lecture. BMJ Open Ophthalmol. 2022. Jul 1;7(1):e001103. doi: 10.1136/bmjophth-2022-001103 - DOI - PMC - PubMed

MeSH terms

LinkOut - more resources