. 2024 Jun;20(6):4043-4065.
doi: 10.1002/alz.13821. Epub 2024 May 7.

Proteomic changes in the human cerebrovasculature in Alzheimer's disease and related tauopathies linked to peripheral biomarkers in plasma and cerebrospinal fluid

Affiliations

Proteomic changes in the human cerebrovasculature in Alzheimer's disease and related tauopathies linked to peripheral biomarkers in plasma and cerebrospinal fluid

Aleksandra M Wojtas et al. Alzheimers Dement. 2024 Jun.

Abstract

Introduction: Cerebrovascular dysfunction is a pathological hallmark of Alzheimer's disease (AD). Nevertheless, detecting cerebrovascular changes within bulk tissues has limited our ability to characterize proteomic alterations from less abundant cell types.

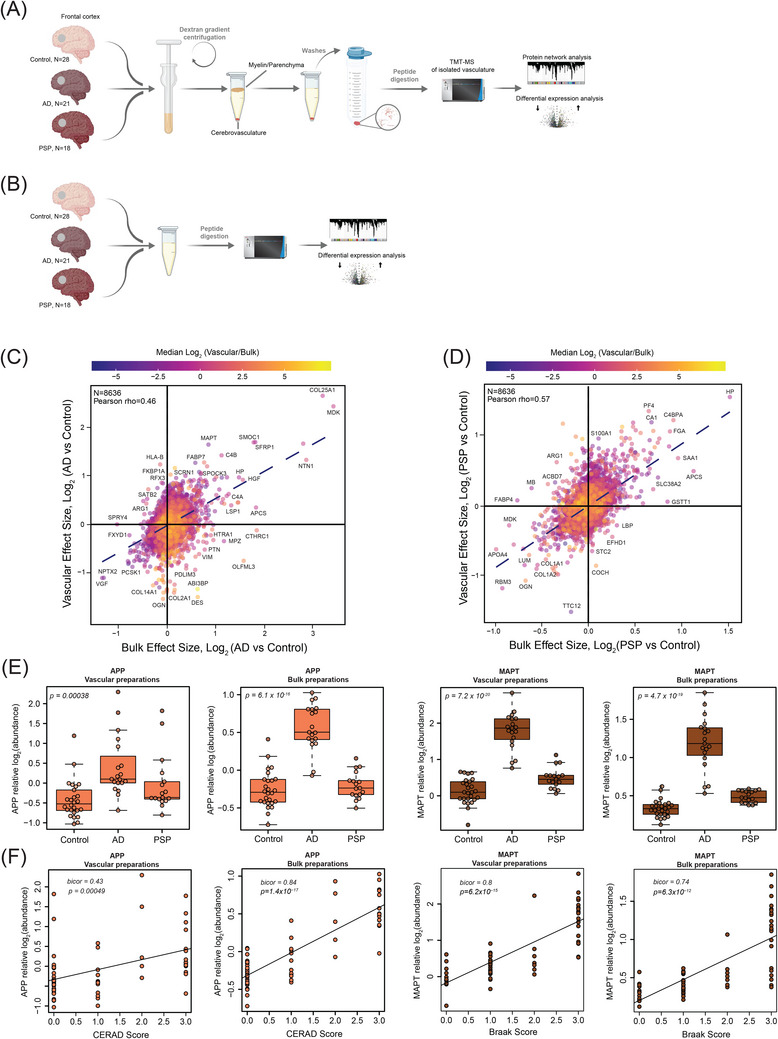
Methods: We conducted quantitative proteomics on bulk brain tissues and isolated cerebrovasculature from the same individuals, encompassing control (N = 28), progressive supranuclear palsy (PSP) (N = 18), and AD (N = 21) cases.

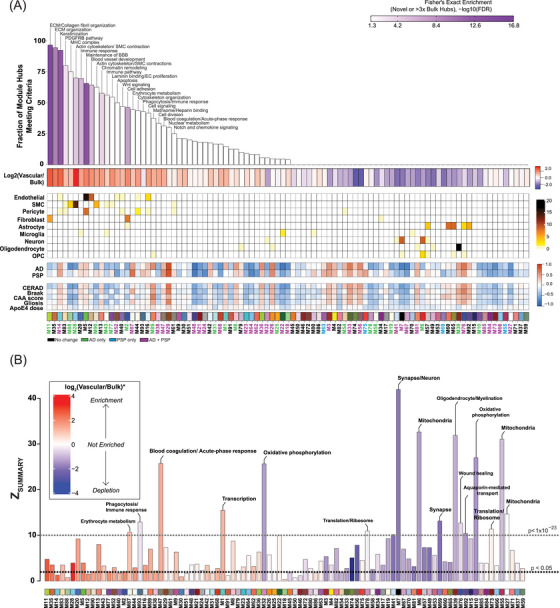
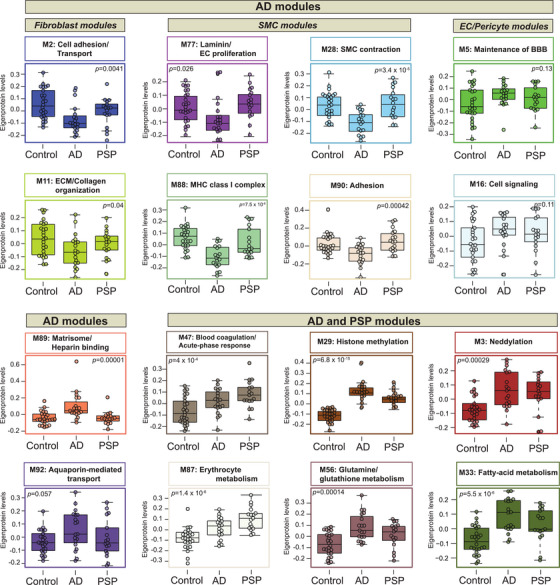
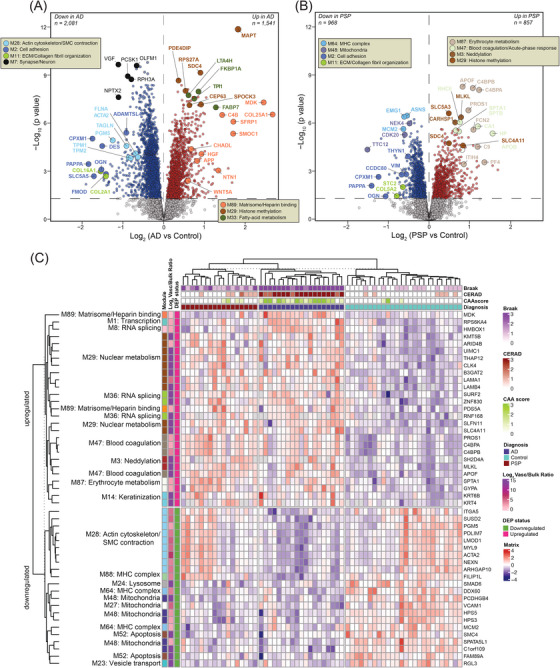
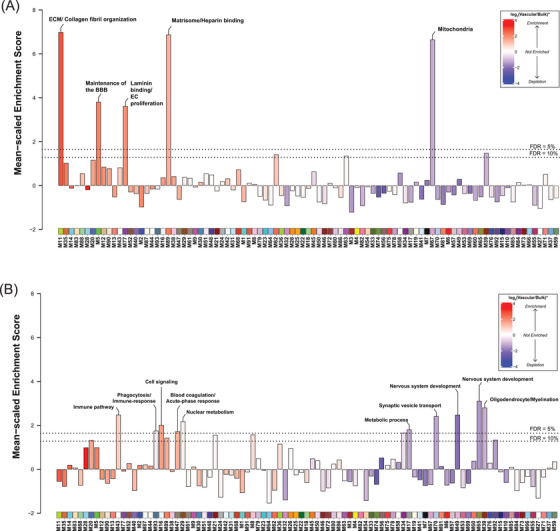
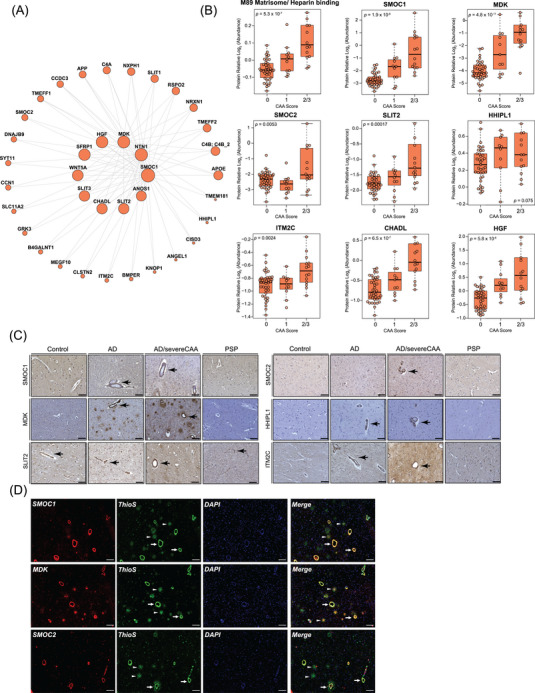
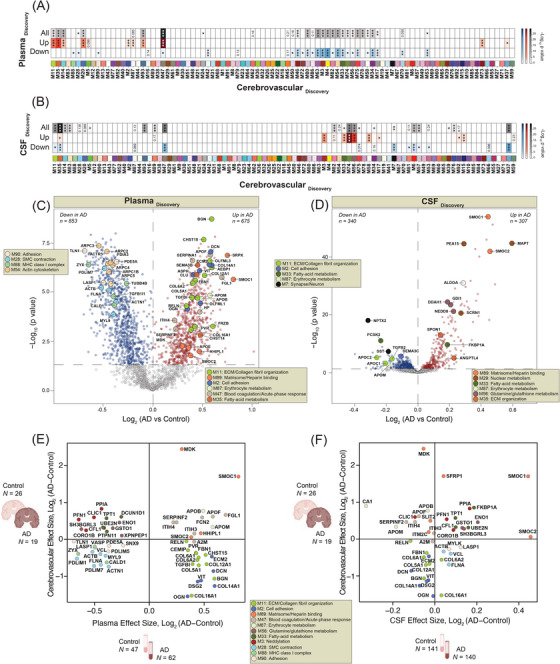
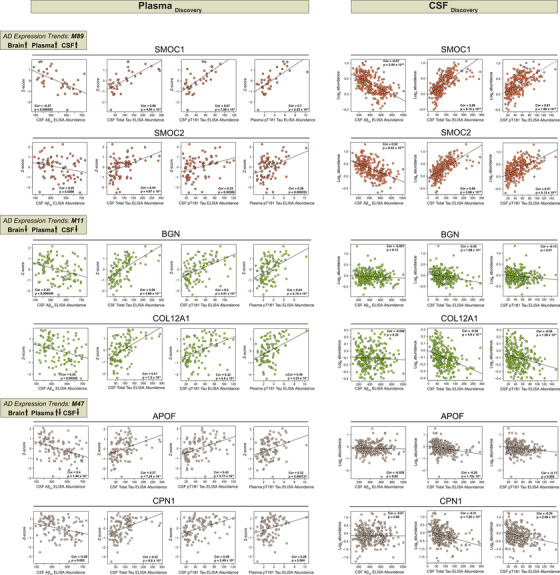
Results: Protein co-expression network analysis identified unique cerebrovascular modules significantly correlated with amyloid plaques, cerebrovascular amyloid angiopathy (CAA), and/or tau pathology. The protein products within AD genetic risk loci were concentrated within cerebrovascular modules. The overlap between differentially abundant proteins in AD cerebrospinal fluid (CSF) and plasma with cerebrovascular network highlighted a significant increase of matrisome proteins, SMOC1 and SMOC2, in CSF, plasma, and brain.

Discussion: These findings enhance our understanding of cerebrovascular deficits in AD, shedding light on potential biomarkers associated with CAA and vascular dysfunction in neurodegenerative diseases.

Keywords: Alzheimer's disease; amyloid; biomarkers; cerebral amyloid angiopathy; cerebrovasculature; mass spectrometry; progressive supranuclear palsy; tandem mass tag labeling; tau.


Conflict of interest statement

The authors have declared no conflicts of interest. Author disclosures are available in the supporting information.

Figures

FIGURE 1
FIGURE 1
Deep quantitative proteomics of human cerebrovasculature and whole brain tissue. (A, B) Schematic representation of the experimental workflow for matched human post mortem tissues from non‐demented controls (= 28), Alzheimer's disease (AD) (= 21), and progressive supranuclear palsy (PSP) (= 18) cases from the University of Pennsylvania Brain Bank (UPenn) cohort. Isolated cerebrovasculature was obtained by dextran gradient centrifugation that allowed the separation of parenchyma/myelin from blood vessels. Both vascular and bulk fractions underwent enzymatic digestion followed by labeling with isobaric tandem mass tags and liquid chromatography mass spectrometry (TMT‐MS). (C, D) Scatter plot of the log2 effect size in the bulk and vascular proteome in AD versus control (C) and PSP versus control (D); color scale indicates the mean log2 (cerebrovasculature/bulk) enrichment. (E) TMT‐MS quantified levels of amyloid precursor protein (APP) and microtubule associated protein tau (MAPT) in vascular and bulk preparations. p values were calculated using one‐way analysis of variance (ANOVA) for overall groupwise difference. Box plots represent median, 25th and 75th percentiles while box whiskers extend to non‐outlier measurements up to 1.5 times each nearest interquartile range. (F) APP and MAPT abundance levels were positively correlated to CERAD and Braak scores, respectively using biweight midcorrelation (Bicor). Student's test for correlation significance p values are provided for each correlation with p < 0.05.
FIGURE 2
FIGURE 2
Protein co‐expression network reveals novel modules enriched in cerebrovasculature. (A) Protein co‐expression network of cerebrovasculature was built using WGCNA as described in Section 2, and consisted of 93 protein co‐expression modules (N = 9854 proteins, each module represented by a different color and number for decreasing rank size). Top percent novel hubs identified in the tandem mass tags (TMT) cerebrovascular network novel or greater than or equal to three‐fold enriched relative to paired bulk protein measurements on average. Color scale represents gene product enrichment calculation using Fisher exact test with Benjamini–Hochberg false discovery rate (FDR) correction. Gene ontology (GO) analysis was used to identify representatives the modular biology. Mean log2 ratio of vascular to bulk proteomic abundance was performed to identify modules enriched in vascular proteome red indicates enrichment and blue indicates depletion. The cell type association of each module was assessed by hypergeometric overlap of each module's gene products with the cell type specific marker list for each brain cell type de novo extracted from single‐nuclei RNA‐seq data, curated into nine primary cell types; one‐sided Fisher's exact test with Benjamini–Hochberg correction was employed, with colors other than white representing significant FDR < 0.05. Scale bars indicate cell type enrichment (from modestly significant to darker brown indicating stronger enrichment). The heatmap shows the correlations of module eigenproteins with binary disease/control status, neuropathological hallmarks (CERAD, Braak, CAA, gliosis), and apolipoprotein E ( APOE) Ɛ4 dose. Two‐color heatmap represents strength of positive (red) or negative (blue) correlation, with p values provided for all correlations with p < 0.05. Module names are colored based on their changes with disease status (black indicates no change with disease, green highlights modules that change only in Alzheimer's disease (AD), blue shows modules that change only in progressive supranuclear palsy (PSP), and purple indicates modules that change in AD and PSP). (B) Module preservation of the TMT protein vascular network into the proteomes of paired bulk tissue case samples from frontal cortex of matched individuals. Modules with a preservation Zsummary score less than 1.96 (p value < 0.05) were not considered preserved. Protein modules with Zsummary score above 1.96 were considered moderately preserved (modules above black line), whereas protein modules with Zsummary score above 10 (p value < 1 × 10−23) were considered highly preserved (above gray line). Each bar is shaded according to the scale of mean pair cerebrovascular enrichment. Modules that showed no preservation in the bulk proteome but were enriched in vasculature are labeled in red.
FIGURE 3
FIGURE 3
Co‐expression network of cerebrovascular proteome resolves different proteomic signatures in Alzheimer's disease (AD) and progressive supranuclear palsy (PSP). Module eigenprotein (ME) levels grouped by case status were plotted for protein modules of interest. MEs were analyzed using one‐way analysis of variance (ANOVA) test and unadjusted p values are provided for each module. Box plots represent median, 25th and 75th percentile while box whiskers encompass actual data points up to 1.5 times the nearest interquartile range.
FIGURE 4
FIGURE 4
Disease status demonstrates different cerebrovascular protein signature. (A, B) Volcano plots showing differential abundance of proteins between control and Alzheimer's disease (AD) groups (N = 3622) (A) or proteins between control and progressive supranuclear palsy (PSP) cases (N = 1825) (B). The x axis illustrates the log2 fold change (AD vs. Control, A) or (PSP vs. Control, B), while the y axis represents the ‐log10 statistical p value calculated for all proteins in each pairwise group. p values were obtained from one‐way analysis of variance (ANOVA) with Tukey's post hoc test and for Tukey p values less than 10−8.5, Bonferroni correction of two‐tailed unequal variance t‐test p values replaced highly significant but imprecisely estimated Tukey p values. Proteins significantly increased in AD (N = 1541) (A) or PSP (N = 857) (B) are depicted in red (p < 0.05), whereas those significantly decreased in AD (N = 2081) (A) or PSP (N = 968) (B) are highlighted in blue. Proteins of interest are shown as enlarged dots and shaded according to color of the module membership. Gray shaded dots represent proteins with unchanged levels. (C) Supervised hierarchical clustering of the 49 most significant proteins that were unique to vasculature or three‐fold enriched in vasculature compared to bulk and with volcano significance < 0.05 across each of the three possible comparisons among control, AD, and PSP groups. Red shaded boxes highlight proteins upregulated and blue shaded boxes indicate downregulated proteins relative to the central tendency. Minimum and maximum log2 (abundance/central tendency) are clipped at – and +4.
FIGURE 5
FIGURE 5
Alzheimer's disease (AD) genome wide association studies (GWAS) risk genes are overrepresented in protein modules enriched for brain vascular cells. (A) AD GWAS candidate genes were significantly enriched in five modules, including M11, M67, M77, M89, and M5. These modules were significantly up‐ or down‐regulated in AD, as shown in Figure 2A. The horizontal dotted lines indicate the thresholds for permutation test false discovery rate (FDRs of 10% or 5%), above which genetic risk enrichment was considered significant. Bar colors indicate mean all‐protein module member mean log2(cerebrovasculature/bulk) proteome fractionation enrichment. (B) GWAS risk genes for progressive supranuclear palsy (PSP) were mapped to 10 modules with 5% FDR, among which two were significantly upregulated in PSP, including M29, and M47 (Figure 2B).
FIGURE 6
FIGURE 6
Matrisome proteins are found in cerebrovasculature in Alzheimer's disease (AD) and associated with cerebrovascular amyloid angiopathy (CAA). (A) An iGraph represents the top 37 proteins identified in the M89 Matrisome/Heparin binding module. Lines between proteins represent topological overlap matrix weight corresponding to the similarity of correlated patterns of node pairs over the 62 case samples in the cerebrovascular network. (B) Protein abundance of module M89 and selected module members across different CAA severity score. A 0 indicates no CAA, 1 indicates mild CAA, and 2/3 indicates moderate to severe CAA score. One‐way analysis of variance (ANOVA) p values were assessed for each three‐group box plot. Box plots represent the median and 25th and 75th percentiles, with data points up to 1.5 times the nearest interquartile range beyond the box defining the extent of error bar whiskers. (C) Immunohistological evaluation of expression patterns of SMOC1, MDK, SMOC2, SLIT2, HHIPL1, and ITM2C in human post mortem cortical tissues from non‐demented control, AD, AD with severe CAA, and progressive supranuclear palsy (PSP). Arrows indicate the presence of these proteins in the cerebrovasculature, the arrowheads indicate their expression in brain parenchyma. Scale bar, 100 μm. (D) Co‐localization of SMOC1, MDK, and SMOC2 with amyloid in brain parenchyma and cerebrovasculature in human AD brain tissue. Thioflavin‐S (thioS) stain was used to label fibrillar amyloid deposition. Arrows indicate the co‐localization of these proteins with CAA, the arrowheads indicate their co‐localization with amyloid plaques. Scale bar, 100 μm.
FIGURE 7
FIGURE 7
Integrated analysis of the brain vasculature and cerebrospinal fluid (CSF) and plasma proteomes in Alzheimer's disease (AD). (A, B) Overlap of proteins identified in the discovery cerebrovascular proteome (N = 26 control and N = 19 AD) with separate plasma cohort (N = 47 control and N = 62 AD) (A) or CSF (N = 141 control and N = 140 AD) (B) discovery datasets. In the plasma proteome N = 2865 proteins were identified, whereas in the CSF proteome N = 2067 proteins were quantified. Separate hypergeometric overlap Fisher exact analyses were used to assess the significance of protein overlap. The top row indicates overlap between brain vascular and plasma or brain vascular and CSF proteome (gray shaded scale). The middle row demonstrates the overlap between brain vascular and plasma or brain vascular and CSF proteins significantly increased in AD (< 0.05) (red shaded scale). The bottom row depicts the overlap between brain vascular and plasma or CSF proteins significantly decreased in AD (< 0.05) (blue shaded scale). The intensity of color shading indicates the degree of the overlap. Statistical significance is shown in the heatmap using stars (* false discovery rate [FDR] < 0.05, ** FDR < 0.01, and *** FDR < 0.001). FDR corrected values were determined using the Benjamini–Hochberg method. (C, D) Volcano plots showing differential abundance of proteins measured in plasma (N = 1528) (C) or proteins measured in CSF (N = 647) (D) between Control and AD groups. The x axis illustrates the log2 fold change (AD vs. Control), while the y axis represents the ‐log10 statistical p value calculated for all proteins in each pairwise group, obtained as Tukey post‐hoc test p values following one‐way analysis of variance (ANOVA), except for imprecisely calculated Tukey values below 10−8.5 which underwent more precise and stringent Bonferroni post‐hoc correction of a two‐tailed unequal variance t‐test. Proteins significantly increased in plasma in AD (N = 675) (C) or CSF in AD (N = 307) (D) are depicted in red (p < 0.05) whereas those significantly decreased in plasma in AD (N = 853) (C) or CSF in AD (N = 340) (D) are highlighted in blue. Proteins of interest are shown as enlarged dots and shaded according to the color of their module membership. (E, F) Scatter plots illustrate a Pearson correlation between log2 effect size (AD vs. Control) of significantly altered proteins in cerebrovasculature and plasma (E) or cerebrovasculature and CSF (F). The significance of Pearson correlation was determined by Student's t‐test for significance of correlation implemented in the WGCNA R package.
FIGURE 8
FIGURE 8
Specific cerebrovascular enriched proteins are detected in cerebrospinal fluid (CSF) and plasma, and strongly correlate with core Alzheimer's disease (AD) biomarkers. Scatterplots represent the correlation measurements of CSF amyloid beta 42 (Aβ42), total tau, and p‐tau181 and plasma p‐tau181 with six plasma (left panel) (total sample measurements: SMOC1 N = 36, SMOC2 = 80, BGN, COL12A1, APOF, CPN1 N = 109) and CSF (right panel) proteins (total sample measurements for all six proteins N = 281). The Pearson correlation coefficient and Student's p values are provided for each plot

Update of

References

    1. Walsh DM, Selkoe DJ. Deciphering the molecular basis of memory failure in Alzheimer's disease. Neuron. 2004;44(1):181‐193. - PubMed
    1. DeTure MA, Dickson DW. The neuropathological diagnosis of Alzheimer's disease. Mol Neurodegener. 2019;14(1):32. - PMC - PubMed
    1. Iadecola C, Gottesman RF. Cerebrovascular alterations in Alzheimer disease. Circ Res. 2018;123(4):406‐408. - PMC - PubMed
    1. Zlokovic BV. The blood‐brain barrier in health and chronic neurodegenerative disorders. Neuron. 2008;57(2):178‐201. - PubMed
    1. Zhao Z, Nelson AR, Betsholtz C, Zlokovic BV. Establishment and dysfunction of the blood‐brain barrier. Cell. 2015;163(5):1064‐1078. - PMC - PubMed

Publication types

MeSH terms