. 2024 May 28;102(10):e209310.
doi: 10.1212/WNL.0000000000209310. Epub 2024 May 7.

Association of NOTCH3 Variant Risk Category With 2-Year Clinical and Radiologic Small Vessel Disease Progression in Patients With CADASIL

Affiliations

Association of NOTCH3 Variant Risk Category With 2-Year Clinical and Radiologic Small Vessel Disease Progression in Patients With CADASIL

Minne N Cerfontaine et al. Neurology. .

Abstract

Background and objectives: Pathogenic variants in NOTCH3 are the main cause of hereditary cerebral small vessel disease (SVD). SVD-associated NOTCH3 variants have recently been categorized into high risk (HR), moderate risk (MR), or low risk (LR) for developing early-onset severe SVD. The most severe NOTCH3-associated SVD phenotype is also known as cerebral autosomal dominant arteriopathy with subcortical infarcts and leukoencephalopathy (CADASIL). We aimed to investigate whether NOTCH3 variant risk category is associated with 2-year progression rate of SVD clinical and neuroimaging outcomes in CADASIL.

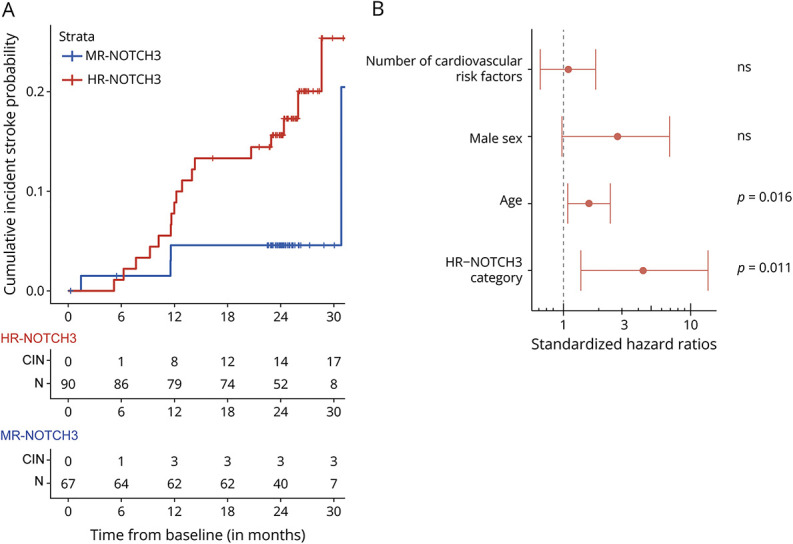
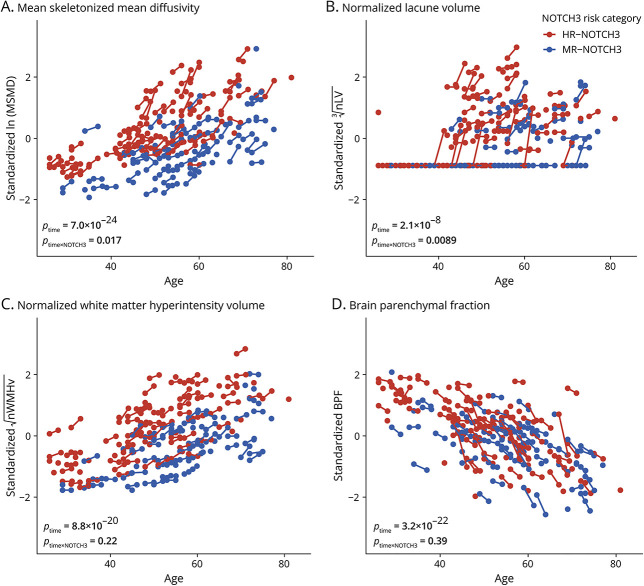
Methods: A single-center prospective 2-year follow-up study was performed of patients with CADASIL. Clinical outcomes were incident stroke, disability (modified Rankin Scale), and executive function (Trail Making Test B given A t-scores). Neuroimaging outcomes were mean skeletonized mean diffusivity (MSMD), normalized white matter hyperintensity volume (nWMHv), normalized lacune volume (nLV), and brain parenchymal fraction (BPF). Cox regression and mixed-effect models, adjusted for age, sex, and cardiovascular risk factors, were used to study 2-year changes in outcomes and differences in disease progression between patients with HR-NOTCH3 and MR-NOTCH3 variants.

Results: One hundred sixty-two patients with HR (n = 90), MR (n = 67), and LR (n = 5) NOTCH3 variants were included. For the entire cohort, there was 2-year mean progression for MSMD (β = 0.20, 95% CI 0.17-0.23, p = 7.0 × 10⁻²⁴), nLV (β = 0.13, 95% CI 0.080-0.19, p = 2.1 × 10⁻⁶), nWMHv (β = 0.092, 95% CI 0.075-0.11, p = 8.8 × 10⁻²⁰), and BPF (β = -0.22, 95% CI -0.26 to -0.19, p = 3.2 × 10⁻²²), as well as an increase in disability (p = 0.002) and decline of executive function (β = -0.15, 95% CI -0.30 to -3.4 × 10⁻⁵, p = 0.05). The HR-NOTCH3 group had a higher probability of 2-year incident stroke (hazard ratio 4.3, 95% CI 1.4-13.5, p = 0.011), and a higher increase in MSMD (β = 0.074, 95% CI 0.013-0.14, p = 0.017) and nLV (β = 0.14, 95% CI 0.034-0.24, p = 0.0089) than the MR-NOTCH3 group. Subgroup analyses showed significant 2-year progression of MSMD in young (n = 17, β = 0.014, 95% CI 0.0093-0.019, p = 1.4 × 10⁻⁵) and premanifest (n = 24, β = 0.012, 95% CI 0.0082-0.016, p = 1.1 × 10⁻⁶) individuals.

Discussion: In a trial-sensitive time span of 2 years, we found that patients with HR-NOTCH3 variants have a significantly faster progression of major clinical and neuroimaging outcomes, compared with patients with MR-NOTCH3 variants. This has important implications for clinical trial design and disease prediction and monitoring in the clinic. Moreover, we show that MSMD is a promising outcome measure for trials enrolling premanifest individuals.


Conflict of interest statement

The authors report no relevant disclosures. Go to Neurology.org/N for full disclosures.

Figures

Figure 1
Figure 1. Flowchart of Inclusion and Loss to Follow-Up in the DiViNAS Study
a See eMethods for detailed reasons of loss to follow-up. BPF = brain parenchymal fraction; DiViNAS = Disease Variability in NOTCH3-Associated Small Vessel Disease; HR-NOTCH3 = high-risk NOTCH3 variant; MR-NOTCH3 = moderate-risk NOTCH3 variant; mRS = modified Rankin Scale; MSMD = mean skeletonized mean diffusivity; nLV = normalized lacune volume; nWMHv = normalized white matter hyperintensity volume; TMTB/A = Trail Making Test B given A t-scores.
Figure 2
Figure 2. The HR-NOTCH3 Group Had a Higher 2-Year Cumulative Probability of Experiencing a Stroke Compared with the MR-NOTCH3 Group
(A) Kaplan-Meier survival curve for incident stroke of HR-NOTCH3 (red) and MR-NOTCH3 patients (blue) with a table showing CIN of stroke and those at risk (N). One patient with an MR-NOTCH3 variant who experienced stroke shortly after the cutoff of the CIN/N table; this patient was included in the Cox regression model. (B) Forest plot showing the relative effect sizes of the different predictors on 2-year incident cumulative stroke probability; only the HR-NOTCH3 group (hazard ratio HR-NOTCH3 vs MR-NOTCH3 4.3, 95% CI 1.4–13.5, p = 0.011) and age (standardized by 10 years, hazard ratio 1.6, 95% CI 1.1–2.4, p = 0.016) predicted 2-year incident stroke. CIN = cumulative incidence; HR-NOTCH3 = high-risk NOTCH3 variant; MR-NOTCH3 = moderate-risk NOTCH3 variant; N = number at risk.
Figure 3
Figure 3. The HR-NOTCH3 Group Had Higher Mean 2-Year Progression of MSMD and nLV Compared With the MR-NOTCH3 Group
(A–D) Spaghetti plots with standardized neuroimaging markers on the y-axis and age at study visit on the x-axis. There was an increase in MSMD (βtime = 0.20, 95% CI 0.17–0.23, p = 7.0 × 10⁻²⁴, A), nLV (βtime = 0.13, 95% CI 0.080–0.19, p = 2.1 × 10⁻⁶, B), and nWMHv (βtime = 0.092, 95% CI 0.075–0.11, p = 8.8 × 10⁻²⁰, C) and a decrease in BPF (βtime = −0.22, 95% CI −0.26 to −0.19, p = 3.2 × 10⁻²², D) for the entire cohort. Patients with HR-NOTCH3 variants (in red) had a higher mean increase of MSMD (βtime × NOTCH3 = 0.074, 95% CI 0.013–0.14, p = 0.017) and nLV (βtime × NOTCH3 = 0.14, 95% CI 0.034–0.24, p = 0.0089) than patients with MR-NOTCH3 variants (in blue). There was no association between NOTCH3 risk category and 2-year progression of nWMHv (βtime × NOTCH3 = 0.023, 95% CI −0.015 to 0.060, p = 0.22, C) or BPF (βtime × NOTCH3 = −0.033, 95% CI −0.11 to 0.043, p = 0.39, D). BPF = brain parenchymal fraction; HR-NOTCH3 = high-risk NOTCH3 variant; MR-NOTCH3 = moderate-risk NOTCH3 variant; MSMD = mean skeletonized mean diffusivity; nLV = normalized lacune volume; nWMHv = normalized white matter hyperintensity volume; βtime and ptime = standardized regression coefficient and p-value of the effect of follow-up time; βtime × NOTCH3 and ptime × NOTCH3 = standardized regression coefficient and p-value for the interaction of follow-up time with NOTCH3 risk category after correction for sex, baseline age, and baseline cardiovascular risk factor count (CVRFn).
Figure 4
Figure 4. MRI FLAIR Sequences at Baseline and Follow-Up: Examples of Variable Progression of Neuroimaging Markers
(A) A patient with an HR-NOTCH3 variant in their mid 40s developed 12 incident lacunes during the follow-up, of which 3 are shown here (orange arrows); remarkably, this patient did not have any progression of disability on the mRS. (B) A patient with an HR-NOTCH3 variant in their early 40s whose white matter hyperintensities have increased from patchy to confluent in the semioval center. The patient did not have any incident lacunes, nor did they experience stroke. (C) A patient with an MR-NOTCH3 variant in their 40s developed 2 lacunes (one of which is indicated with a blue arrow), both in areas with no previous white matter hyperintensities. This patient has a concomitant diagnosis of poorly treated type 1 diabetes. (D) A patient with an MR-NOTCH3 variant in their early 50s shows a strikingly mild neuroimaging phenotype, with little to no progression with respect to any of the neuroimaging markers. HR-NOTCH3 = high-risk NOTCH3 variant; MR-NOTCH3 = moderate-risk NOTCH3 variant, FLAIR: fluid-attenuated inverse recovery; mRS = modified Rankin Scale. To ensure participant anonymity, age ranges are given and sex is not specified.

References

    1. Wardlaw JM, Smith C, Dichgans M. Small vessel disease: mechanisms and clinical implications. Lancet Neurol. 2019;18(7):684-696. doi:10.1016/S1474-4422(19)30079-1 - DOI - PubMed
    1. Hack RJ, Rutten JW, Person TN, et al. . Cysteine-altering NOTCH3 variants are a risk factor for stroke in the elderly population. Stroke. 2020;51(12):3562-3569. doi:10.1161/STROKEAHA.120.030343 - DOI - PMC - PubMed
    1. Rutten JW, Hack RJ, Duering M, et al. . Broad phenotype of cysteine-altering NOTCH3 variants in UK Biobank: CADASIL to nonpenetrance. Neurology. 2020;95(13):e1835-e1843. doi:10.1212/WNL.0000000000010525 - DOI - PMC - PubMed
    1. Cho BPH, Harshfield EL, Al-Thani M, Tozer DJ, Bell S, Markus HS. Association of vascular risk factors and genetic factors with penetrance of variants causing monogenic stroke. JAMA Neurol. 2022;79(12):1303-1311. doi:10.1001/jamaneurol.2022.3832 - DOI - PMC - PubMed
    1. Cho BPH, Nannoni S, Harshfield EL, et al. . NOTCH3 variants are more common than expected in the general population and associated with stroke and vascular dementia: an analysis of 200 000 participants. J Neurol Neurosurg Psychiatry. 2021;92(7):694-701. doi:10.1136/jnnp-2020-325838 - DOI - PMC - PubMed

Publication types