. 2024 Jun 6;187(12):3120-3140.e29.
doi: 10.1016/j.cell.2024.04.013. Epub 2024 May 6.

Mapping the cellular biogeography of human bone marrow niches using single-cell transcriptomics and proteomic imaging

Affiliations

Mapping the cellular biogeography of human bone marrow niches using single-cell transcriptomics and proteomic imaging

Shovik Bandyopadhyay et al. Cell. .

Abstract

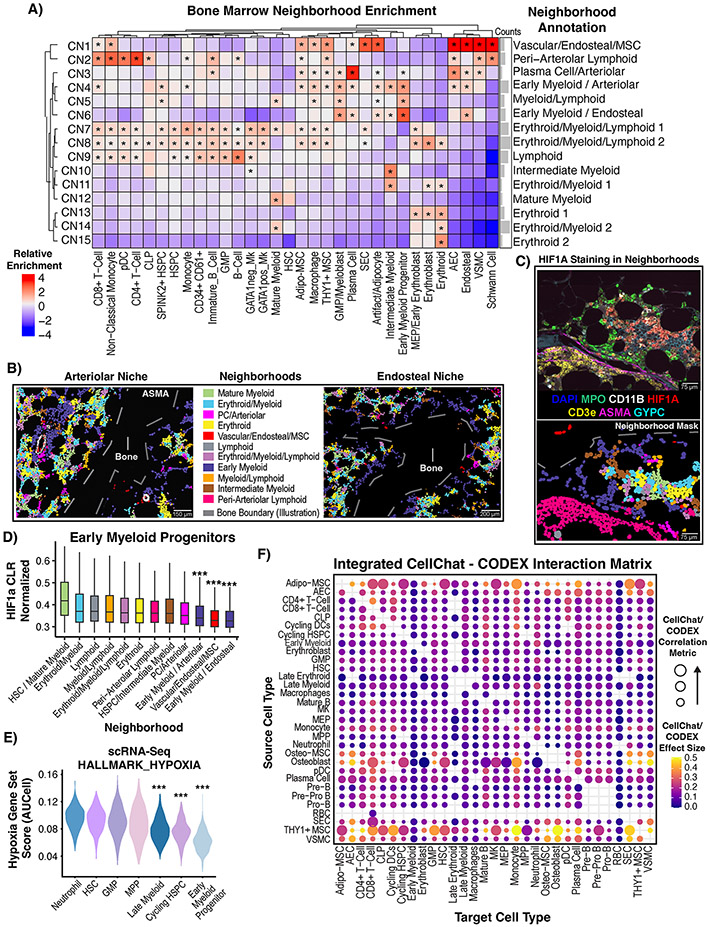
Non-hematopoietic cells are essential contributors to hematopoiesis. However, heterogeneity and spatial organization of these cells in human bone marrow remain largely uncharacterized. We used single-cell RNA sequencing (scRNA-seq) to profile 29,325 non-hematopoietic cells and discovered nine transcriptionally distinct subtypes. We simultaneously profiled 53,417 hematopoietic cells and predicted their interactions with non-hematopoietic subsets. We employed co-detection by indexing (CODEX) to spatially profile over 1.2 million cells. We integrated scRNA-seq and CODEX data to link predicted cellular signaling with spatial proximity. Our analysis revealed a hyperoxygenated arterio-endosteal neighborhood for early myelopoiesis, and an adipocytic localization for early hematopoietic stem and progenitor cells (HSPCs). We used our CODEX atlas to annotate new images and uncovered mesenchymal stromal cell (MSC) expansion and spatial neighborhoods co-enriched for leukemic blasts and MSCs in acute myeloid leukemia (AML) patient samples. This spatially resolved, multiomic atlas of human bone marrow provides a reference for investigation of cellular interactions that drive hematopoiesis.

Keywords: CODEX; bone marrow; hematopoiesis; leukemia; mesenchymal; microenvironment; neighborhood; signaling; single-cell; spatial omics.


Conflict of interest statement

Declaration of interests Maillard: Garuda Therapeutics: Membership on an entity's Board of Directors or advisory committees; Regeneron: Research Funding; Genentech: Research Funding. Carroll: Cartography Bioscences: Membership on an entity's Board of Directors or advisory committees; Janssen Pharmaceuticals: Consultancy.

Figures

Figure 1 –
Figure 1 –. A Single-Cell transcriptomic atlas of hematopoietic and non-hematopoietic cells of human bone marrow.
A) Schematic for the scRNA-Seq workflow. Magnetic-activated cell sorting (MACS) separation of hematopoietic, stem/progenitor, and mesenchymal fractions was performed and then pooled into one scRNA-Seq reaction per patient. B) UMAP representation of 82,742 single-cell transcriptomes from bone marrow of 12 individuals. AEC, arterial endothelial cell; SEC, sinusoidal endothelial cell; VSMC, vascular smooth muscle cell; Ba, Basophil; Eo, Eosinophil; Ma, Mast Cell; RBC, red blood cell; pDC, plasmacytoid dendritic cell; CLP, common lymphoid progenitor; MEP, megakaryocyte erythroid progenitor; GMP, granulocyte monocyte progenitor; MPP, multipotent progenitor; HSPC, hematopoietic stem and progenitor cell; HSC, hematopoietic stem cell; Meg/E, megakaryocyte/erythroid; MSC, mesenchymal stromal cell. C) Bar plots showing the cell counts for each lineage captured (left) and the cell lineage proportions per sample (right). D) Heatmap showing normalized gene expression scaled by row (gene) of top differentially expressed and key cell lineage marker genes. EC, endothelial cell; M, vascular smooth muscle. Genes are color-coded to match the lineage of the cell type in which they are differentially expressed.
Figure 2 –
Figure 2 –. Defining the non-hematopoietic cellular composition of human bone marrow.
A) UMAP of 19,257 mesenchymal cells from 12 individuals showing different mesenchymal subsets, with RNAlo MSCs being excluded due to their QC profile. B) Dot plot showing normalized expression of key mesenchymal marker genes in MSC subsets. C) Dot plot showing the normalized expression of literature-derived marker genes for human MSCs including NT5E (CD73), THY1 (CD90), and ENG (CD105). NGFR (CD271) and MCAM (CD146) have also been described as canonical MSC markers. D) CytoTRACE analysis projected onto the MSC UMAP showing the predicted differentiation score. E) Boxplots showing the relative fibroblast colony forming potential of sorted MSC subtypes. Each data point is one sample. P-values were computed using Welch’s two-sample two-sided test. F) Line plot showing the population doublings over the course of cell culturing for eight passages, where all cells were passaged every 7 days. P-values were computed as Fibro-MSC vs other MSCs by two-way ANOVA. *, p <0.05; **, p<0.01; ***, p <0.001. G) UMAP showing 3,874 endothelial cells from the 12 individuals. SEC, Sinusoidal Endothelial Cells; AEC, Arterial Endothelial Cells. H) Dot plot showing normalized expression of selected pan-endothelial and differentially expressed genes by adjusted p-value between endothelial subsets. I) Reference mapping of MSC subsets from human bone marrow between this study and published studies. Left, counts of mapped MSCs in each dataset; Right, percentages of mapped MSCs in each dataset. Datasets are color-coded based on the experimental protocol.
Figure 3 –
Figure 3 –. Cell-cell communication analysis reveals diverse signaling patterns between hematopoietic and non-hematopoietic cell types.
A) Dot plot showing the normalized expression of manually curated support factors for hematopoiesis in mesenchymal and endothelial populations. B) Chord diagrams showing significant interactions between source mesenchymal/endothelial cell types and target HSPC cell types predicted by CellChat. Thickness of the line corresponds to the strength of the predicted interaction. C) Co-culture of freshly isolated CD34+ HSPCs with sorted and cultured MSC subsets. Error bar represents mean ± SD from samples from 3 (monoculture) or 4 (co-culture) independent experiments. P-values were computed using Welch’s two-sample one-sided test. D) CellChat network analysis with cell types scored based on their outgoing and incoming contributions to the network, where strength is defined by number of significant outgoing interactions and the count refers to the number of cells in each group. E-F) Outgoing (ligand enriched, E) and incoming (receptor enriched, F) significant signaling predictions were scored for each annotated signaling family, and the strength of signaling (CellChat interaction probability) for each cell type was row-scaled and plotted by pathway. The barplot on the right-hand side of each panel shows the total signaling strength across all cell groups. G) Non-negative matrix factorization (NMF) to identify modules of outgoing signaling and the contribution of each cell type to the pattern.
Figure 4 –
Figure 4 –. 54-plex CODEX imaging reveals the spatial cellular topography of human bone marrow.
A) Schematic depicting the CODEX experimental and computational workflow leading to cell type identification. B) 53-antibody CODEX panel split by target cell population. C) Heatmap showing average CLR-normalized expression per cell type scaled by protein marker and hierarchically clustered by protein expression (left). Boxes highlight coordinate marker expression. UMAP showing the 803,131 single cells in the CODEX atlas from 12 individuals colored by cell type (right). Sh, Schwann Cells. D) CODEX images showing manually identified examples of Fibro-MSC, osteolineage cells (osteo-MSC (CXCL12+ CD56+), osteoblast (CXCL12lo CD56+)), Adipo-MSCs (FOXC1+ CXCL12+) and THY1+ MSCs (CD90+ CXCL12+ FOXC1+). E) Violin plot showing the nearest distance of annotated cells from different MSC subtypes (n=64 Fibro-MSC, n=422 Osteo-MSC, n=5,110 Adipo-MSC, and n=4,108 THY1+ MSC) to the manually annotated bone contours. Distances were clipped to the 99th percentile for each cell type for improved visualization. P-values were computed using two-sided Wilcoxon rank sum test. F) CODEX image (left) is paired with the cell phenotype map (CPM, right), showing the segmented cells colored by cell annotation.
Figure 5 –
Figure 5 –. Neighborhood analysis reveals an oxygen-rich arteriolar/endosteal niche for GMP/early myeloid progenitor cells.
A) Heatmap showing enrichment of the cell types present in neighborhoods. Neighborhood names were assigned based on the enriched cell types. P-values for enrichment were computed using a hypergeometric test and adjusted for multiple hypothesis testing using the Benjamini-Hochberg method. *, p<0.05. B) Cell phenotype masks colored by neighborhood membership were plotted alongside ASMA fluorescent signal (left only). C) HIF1A staining pattern across neighborhoods. Top, CODEX image showing the MPO+ early myeloid progenitors not expressing HIF1A, in contrast to mature myeloid elements. Bottom, neighborhood masks which share a legend with Panel B. D) Boxplots showing the normalized HIF1A expression levels in early myeloid progenitors split by neighborhood membership. Data were clipped between 0.1 and 0.95 for improved visualization only. P-values were computed using Welch’s one-sided two-sample test comparing cells from each neighborhood to cells in all other neighborhoods and adjusted using the Benjamini-Hochberg method. *, p< 0.05; ***, p< 0.001. E) Violin plots showing hypoxia signature scores computed using AUCell and our scRNA-Seq data. P-values were comparing AUCell hypoxia scores from each cell type to all other cell types as in (D). F) Bubble plot showing correlation and CODEX-CellChat effect size (CCES) between CellChat interaction prediction strength and max CODEX spatial neighborhood co-localization strength of two cell types.
Figure 6 –
Figure 6 –. Comprehensive structural analysis of bone marrow microenvironment uncovers adipocytic localization of lineage-unspecified HSPCs.
A) Heatmap showing the normalized rank proximity from each microenvironmental structure to each structure, using a Poisson point process model (n=12). Each structure was ranked by its proximity to each other structure in each sample, and the rank was normalized such that a value of 0 (red) means most proximal and 1 (blue) means least proximal. B) Data-driven illustration of structural proximity in normal bone marrow. Edge lengths were scaled to the median normalized rank proximity of each structure, and the physical median distance across 12 samples was labeled above each line. The only significant p-value is highlighted, which was computed using Stouffer’s method to aggregate per-sample permutation test p-values. C-D) Heatmap showing the normalized rank proximity of each neighborhood (C) and cell type to each type of microenvironmental structure (D). Data is from all 12 samples, except when a cell type or neighborhood was too rare to rank in a sample (<10 in at least half of samples, indicated by grey color or excluded from heatmap). E) Boxplot showing the normalized rank proximity of SPINK2+ HSPCs (solid boxes) and HSPCs (dashed boxes) to each microenvironmental structure. P-values were computed by Stouffer’s method as in (B) comparing observed vs. random distance of each HSPC subset to each structure. *, p<0.05; ***, p<0.001. F) Representative CODEX images and associated cell phenotype maps from two samples showing the peri-adipocytic localization of both HSPCs and SPINK2+ HSPCs. G) Cartoon showing a proposed model of human myelopoiesis spatial dynamics.
Figure 7 –
Figure 7 –. Unsupervised single-cell mapping of AML reveals stromal expansion and MSC-enriched AML-specific neighborhoods.
A) Schematic showing our unsupervised label transfer computational approach. B) Bar plot showing the myeloid cell type frequencies in each sample, excluding mature myeloid cells. C) Cell phenotype maps (CPMs) shown for representative sample images. Masks are colored by cell type and share a legend with (B). Dx – Diagnostic, PostTx – Post-Therapy. D) Bar plot showing per sample frequency of MSCs in AML versus NSM. MSC frequency was calculated as the proportion of cells in each sample which were annotated as Adipo− or THY1+ MSCs. The distribution of MSC subtype frequencies in AML samples (AML_Dx and PostTx combined) was compared to that of NSM samples using Welch’s two-sample two-sided test. E) CODEX image showing clustering of rare residual NPM1 mutant blasts which also stained positive for GATA1, juxtaposed with the CPM highlighting the segmented blasts. F) Violin plot showing GATA1 protein levels in the NPM1 mutant blasts from diagnosis and post therapy samples. P-value was computed using Welch’s two-sample two-sided test. G) Heatmap showing the neighborhood cell enrichments (AML: n=175,365 cells, NSM: n=152,198 cells). P-value for enrichment was computed using hypergeometric test and adjusted for multiple hypothesis testing using the Benjamini-Hochberg method. *, p<0.05.

Update of

References

    1. Fröbel J, Landspersky T, Percin G, Schreck C, Rahmig S, Ori A, Nowak D, Essers M, Waskow C, and Oostendorp RAJ (2021). The Hematopoietic Bone Marrow Niche Ecosystem. Front Cell Dev Biol 9, 705410. 10.3389/fcell.2021.705410. - DOI - PMC - PubMed
    1. Pinho S, and Frenette PS (2019). Haematopoietic stem cell activity and interactions with the niche. Nature reviews. Molecular cell biology 20, 303–320. 10.1038/s41580-019-0103-9. - DOI - PMC - PubMed
    1. Ding L, and Morrison SJ (2013). Haematopoietic stem cells and early lymphoid progenitors occupy distinct bone marrow niches. Nature 495, 231–235. 10.1038/nature11885. - DOI - PMC - PubMed
    1. Greenbaum A, Hsu YM, Day RB, Schuettpelz LG, Christopher MJ, Borgerding JN, Nagasawa T, and Link DC (2013). CXCL12 in early mesenchymal progenitors is required for haematopoietic stem-cell maintenance. Nature 495, 227–230. 10.1038/nature11926. - DOI - PMC - PubMed
    1. Zhao M, Tao F, Venkatraman A, Li Z, Smith SE, Unruh J, Chen S, Ward C, Qian P, Perry JM, et al. (2019). N-Cadherin-Expressing Bone and Marrow Stromal Progenitor Cells Maintain Reserve Hematopoietic Stem Cells. Cell Rep 26, 652–669.e656. 10.1016/j.celrep.2018.12.093. - DOI - PMC - PubMed

MeSH terms