. 2024 May 7;15(1):3804.
doi: 10.1038/s41467-024-47460-9.

Characterizing the mechanism of action for mRNA therapeutics for the treatment of propionic acidemia, methylmalonic acidemia, and phenylketonuria

Affiliations

Characterizing the mechanism of action for mRNA therapeutics for the treatment of propionic acidemia, methylmalonic acidemia, and phenylketonuria

Rena Baek et al. Nat Commun. .

Abstract

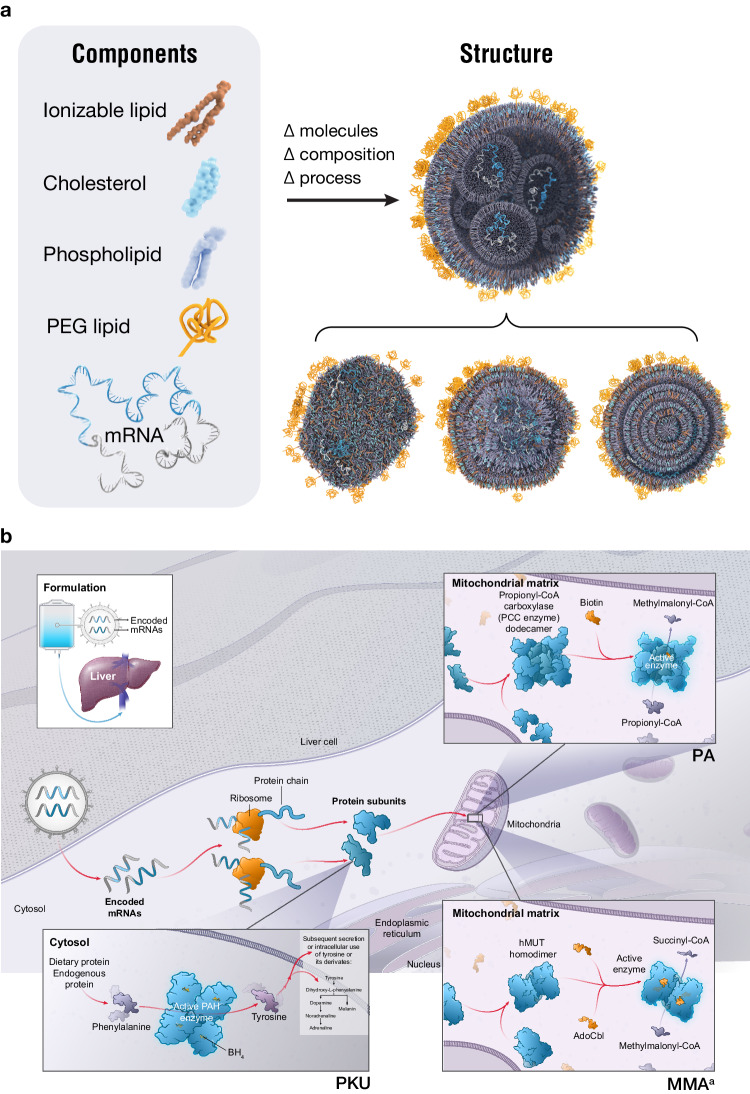
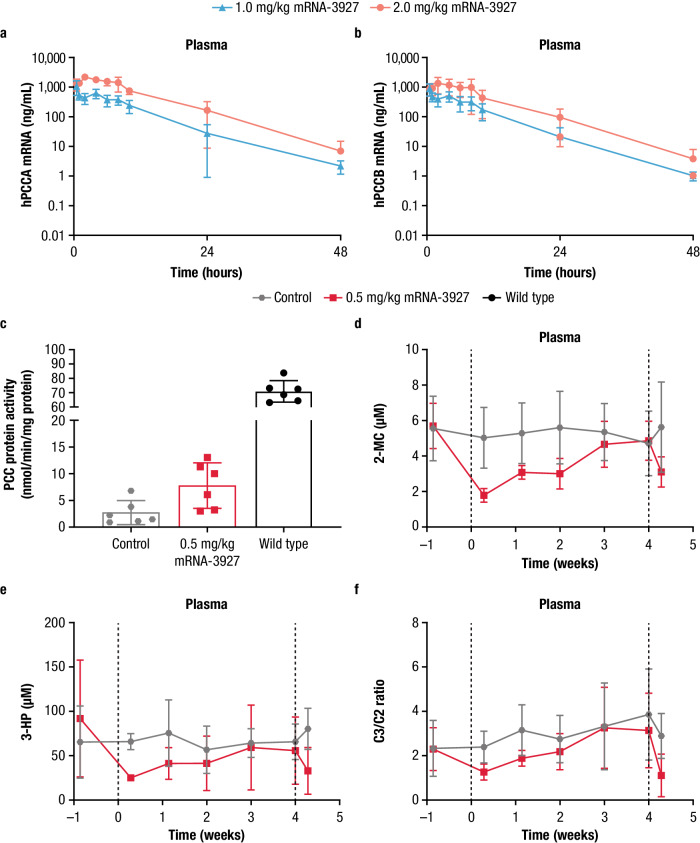
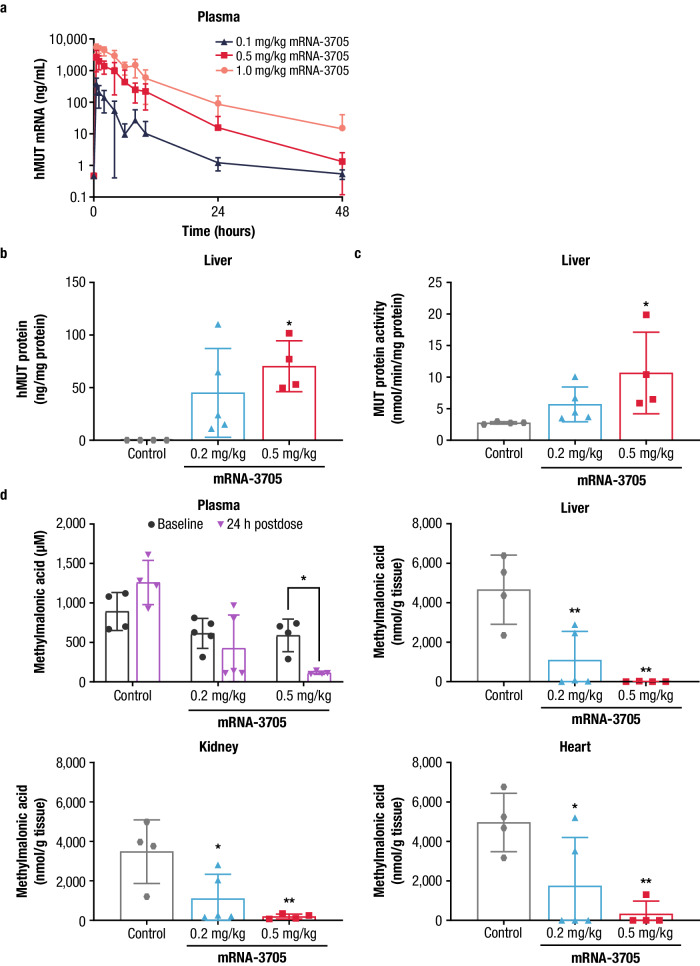
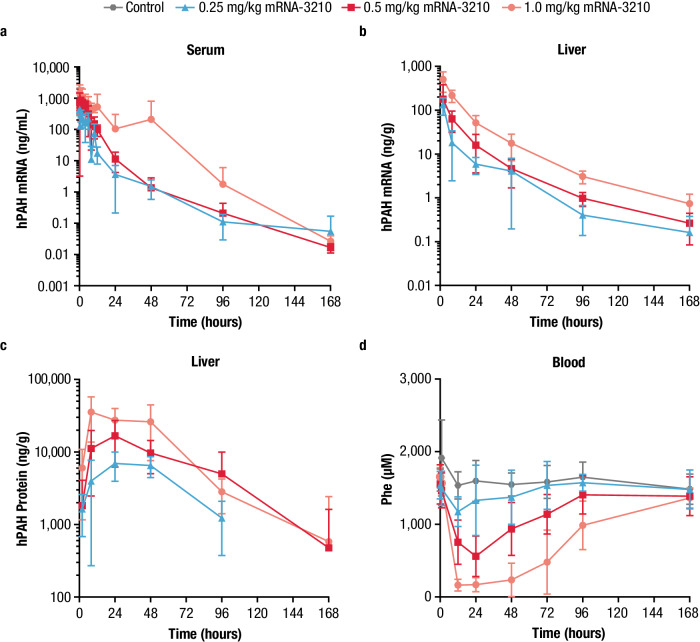
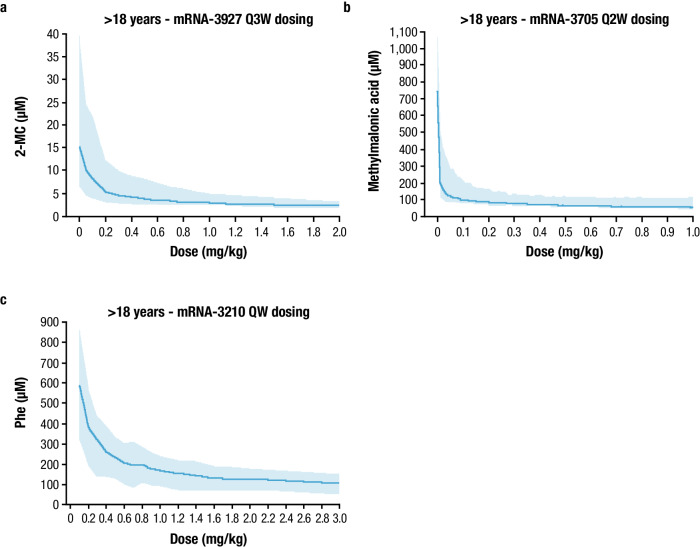
Messenger RNA (mRNA) therapeutics delivered via lipid nanoparticles hold the potential to treat metabolic diseases caused by protein deficiency, including propionic acidemia (PA), methylmalonic acidemia (MMA), and phenylketonuria (PKU). Herein we report results from multiple independent preclinical studies of mRNA-3927 (an investigational treatment for PA), mRNA-3705 (an investigational treatment for MMA), and mRNA-3210 (an investigational treatment for PKU) in murine models of each disease. All 3 mRNA therapeutics exhibited pharmacokinetic/pharmacodynamic (PK/PD) responses in their respective murine model by driving mRNA, protein, and/or protein activity responses, as well as by decreasing levels of the relevant biomarker(s) when compared to control-treated animals. These preclinical data were then used to develop translational PK/PD models, which were scaled allometrically to humans to predict starting doses for first-in-human clinical studies for each disease. The predicted first-in-human doses for mRNA-3927, mRNA-3705, and mRNA-3210 were determined to be 0.3, 0.1, and 0.4 mg/kg, respectively.


Conflict of interest statement

All authors are employees of Moderna, Inc., and may hold stock/options in the company.

Figures

Fig. 1
Fig. 1. LNP nucleic acid delivery of therapeutic mRNA.
a LNP structure. b Approach to PA, PKU, and MMA treatment. Δ change, LNP lipid nanoparticle, MMA methylmalonic acidemia, mRNA messenger RNA, PA propionic acidemia, PEG polyethylene glycol, PKU phenylketonuria. aAdapted from An et al. with permission from Elsevier. Source data are provided as a Source Data file.
Fig. 2
Fig. 2. Mean (±SD) hPCCA and hPCCB mRNA concentrations, PCC enzyme activity, and metabolite concentrations in Pcca−/− (A138T) mice treated with mRNA-3927.
a, b Pcca−/− (A138T) mice received a single bolus IV dose of mRNA-3927 (1.0 or 2.0 mg/kg). Blood samples were collected at multiple time points up to 48 h postdose. Plasma concentrations of hPCCA (n = 4–7 mice/dose level/timepoint) and hPCCB mRNA (n = 4–7 mice/dose level/timepoint), respectively were quantified using branched DNA analysis. c Pcca−/− (A138T) mice received 2 IV bolus doses of Tris-sucrose (control) or 0.5 mg/kg mRNA-3927 on Days 0 and 28 (n = 6 mice/group). PCC activity was measured using a radiometric activity assay wherein the mitochondrial fractions of liver homogenates were incubated with a PCC substrate and the enzymatic product was quantified by scintillation. df Blood was collected from mice prior to treatment and on Days 2, 8, 14, 22, and 28 after the first IV dose, and 2 days after the second IV dose. Plasma concentrations of 2-MC (n = 6 mice/group, where only n = 5 samples were available for analysis in the 0.5 mg/kg mRNA-3927 group at Day 8), 3-HP (n = 6 mice/group, where only n = 2 and 5 samples were available for analysis in the Wild type group at Days 2 and 22, respectively; where only n = 5 and 2 samples were available for analysis in the 0.5 mg/kg mRNA-3927 group prior to treatment and Day 8, respectively; where only n = 5 samples were available for analysis in the Control group at Day 2), and C3/C2 (n = 6 mice/group, where only n = 5 samples were available for analysis in the 0.5 mg/kg mRNA-3927 group at Days 8) were quantified by LC-MS/MS. Dotted lines represent dose administrations. 2-MC 2-methylcitrate, 3-HP 3-hydroxypropionate, C3/C2 ratio of propionylcarnitine to acetylcarnitine, hPCCA human propionyl-coenzyme A carboxylase α subunit, hPCCB human propionyl- coenzyme A carboxylase β subunit, IV intravenous, LC-MS/MS liquid chromatography-tandem mass spectrometry, mRNA messenger RNA, PCC propionyl- coenzyme A carboxylase, SD standard deviation. Source data are provided as a Source Data file.
Fig. 3
Fig. 3. Mean (±SD) concentrations of hMUT mRNA in CD1 mice and hMUT protein, enzyme activity, and methylmalonic acid levels in Mut−/−;TgINS-CBA-G715V hypomorphic mice treated with a single dose of mRNA-3705.
a CD1 mice received a single IV injection of mRNA-3705 (0.1, 0.5, or 1.0 mg/kg). Blood samples were collected on Day 1 at multiple time points up to 48 h postdose for hMUT mRNA quantitation via a bDNA method analysis (n = 6 mice/timepoint for all groups at 0.5, 1, 6, 8, 10, 24, and 48 hours postdose; and n = 12 mice/timepoint for all groups at 2 and 4 h postdose). b Mut−/−;TgINS-CBA-G715V hypomorphic mice received a single IV injection of either PBS (control) or mRNA-3705 (0.2 or 0.5 mg/kg). mRNA-encoded hMUT protein concentrations were quantified in the liver of mice receiving the indicated treatment 24 h postdose using a human-specific LC-MS/MS method (n = 4, 5, and 4 biologically independent mice per Control and 0.2 mg/kg and 0.5 mg/kg mRNA-3705, respectively). c A MUT activity assay that did not differentiate between human versus murine enzyme activity was used to assess total MUT enzyme activity (n = 4, 5, and 4 biologically independent mice per Control and 0.2 mg/kg and 0.5 mg/kg mRNA-3705, respectively). d Plasma methylmalonic acid levels were measured at baseline (Day -7) and 24 h postdose in mice receiving the indicated treatment (n = 4, 5, and 4 biologically independent mice per Control and 0.2 mg/kg and 0.5 mg/kg mRNA-3705, respectively). Liver, kidney, and heart methylmalonic acid levels were measured at 24 h postdose (n = 4, 5, and 4 biologically independent mice per Control and 0.2 mg/kg and 0.5 mg/kg mRNA-3705, respectively). *P < 0.05, **P < 0.01 compared to Mut−/−;TgINS-CBA-G715V PBS group by 1-way ANOVA, followed by Dunnett’s multiple comparisons test. ANOVA analysis of variance, bDNA branched DNA, hMUT human methylmalonyl-coenzyme A mutase, IV intravenous, LC-MS/MS liquid chromatography-tandem mass spectrometry, mRNA messenger RNA, PBS phosphate-buffered saline, SD standard deviation. Source data are provided as a Source Data file.
Fig. 4
Fig. 4. Mean (±SD) serum and liver concentrations of hPAH mRNA, hPAH protein, and blood Phe levels in PAHenu2 mice treated with a single IV dose of mRNA-3210.
a–d PAHenu2 mice (n = 6–16/treatment group) were treated with a single IV dose of mRNA-3210, and serum (n = 9 mice for 0.25 mg/kg mRNA-3210 at 0.25 h postdose and n = 8 mice for all other timepoints; n = 9 mice for 0.5 mg/kg mRNA-3210 at 0.5 h postdose and n = 8 mice for all other timepoints; n = 9 mice for 1.0 mg/kg mRNA-3210 at 0.25 h postdose and n = 8 mice for all other timepoints) and liver hPAH mRNA (n = 9 mice for 0.25 mg/kg mRNA-3210 at 2 h postdose, n = 8 mice at 8, 24, 48, 96 h postdose, n = 8 mice at 8 h postdose, and n = 16 mice at 168 h postdose; n = 8 mice for 0.5 mg/kg mRNA-3210 at 2, 24, 48, 96 h postdose, n = 9 mice at 8 h postdose, and n = 16 mice at 168 h postdose; n = 9 mice for 1.0 mg/kg mRNA-3210 at 2 h postdose, n = 8 mice at 8, 24, 48, 96 h postdose, n = 8 mice at 8 h postdose, and n = 16 mice at 168 h postdose) or hPAH protein concentrations (n = 10 mice for 0.25 mg/kg mRNA-3210 at 2 h postdose, n = 8 mice at 8, 24, 48, 96 h postdose, n = 7 mice at 96 h postdose, and n = 16 mice at 168 h postdose; n = 8 mice for 0.5 mg/kg mRNA-3210 at 2, 24, 48, 96 h postdose, n = 9 mice at 8 h postdose, and n = 16 mice at 168 h postdose; n = 9 mice for 1.0 mg/kg mRNA-3210 at 2 h postdose, n = 8 mice at 8, 24, 48, 96 h postdose, n = 16 mice at 168 h postdose), were assessed at baseline and 6, 24, 48, 72, 96, and 168 h postdose. d PAHenu2 mice (n = 8/treatment group) were treated with a single IV dose of mRNA-3210 at 0.25, 0.5, or 1.0 mg/kg or saline (control). Blood Phe levels were assessed at baseline and 6, 24, 48, 72, 96, and 168 h postdose. enu2 N-ethyl-N-nitrosourea, hPAH human phenylalanine hydroxylase, IV intravenous, mRNA messenger RNA, PAH phenylalanine hydroxylase, Phe phenylalanine, PKU phenylketonuria, SD standard deviation. Source data are provided as a Source Data file.
Fig. 5
Fig. 5. Dose response for PA, MMA, and PKU in adult participants.
a Predicted relationship between mRNA-3927 dose and plasma 2-MC levels at steady state after Q3W dosing. b Predicted relationship between mRNA-3705 dose and plasma methylmalonic acid levels at steady state after Q2W dosing. c Predicted relationship between mRNA-3210 dose and blood Phe levels at steady state after weekly dosing. Solid lines represent the pre-dose levels at steady state (median). Shaded regions represent the 95% prediction interval. 2-MC 2-methylcitrate, MMA methylmalonic acidemia, mRNA messenger RNA, PA propionic acidemia, Phe phenylalanine, PKU phenylketonuria, Q2W every 2 weeks, Q3W every 3 weeks, QW every week. Source data are provided as a Source Data file.

References

    1. Dilliard SA, Siegwart DJ. Passive, active and endogenous organ-targeted lipid and polymer nanoparticles for delivery of genetic drugs. Nat. Rev. Mater. 2023;8:282–300. doi: 10.1038/s41578-022-00529-7. - DOI - PMC - PubMed
    1. Kowalski PS, Rudra A, Miao L, Anderson DG. Delivering the Messenger: Advances in Technologies for Therapeutic mRNA Delivery. Mol. Ther. 2019;27:710–728. doi: 10.1016/j.ymthe.2019.02.012. - DOI - PMC - PubMed
    1. Attarwala H, Lumley M, Liang M, Ivaturi V, Senn J. Translational pharmacokinetic/pharmacodynamic model for mRNA-3927, an investigational therapeutic for the treatment of propionic acidemia. Nucleic Acid Ther. 2023;33:141–147. doi: 10.1089/nat.2022.0036. - DOI - PMC - PubMed
    1. An D, et al. Systemic messenger RNA therapy as a treatment for methylmalonic acidemia. Cell Rep. 2017;21:3548–3558. doi: 10.1016/j.celrep.2017.11.081. - DOI - PMC - PubMed
    1. van Spronsen FJ, et al. Phenylketonuria. Nat. Rev. Dis. Primers. 2021;7:36. doi: 10.1038/s41572-021-00267-0. - DOI - PMC - PubMed

Publication types

MeSH terms

Supplementary concepts

LinkOut - more resources