. 2024 May 7;15(1):3839.
doi: 10.1038/s41467-024-47140-8.

CRISPR-dCas13d-based deep screening of proximal and distal splicing-regulatory elements

Affiliations

CRISPR-dCas13d-based deep screening of proximal and distal splicing-regulatory elements

Yocelyn Recinos et al. Nat Commun. .

Abstract

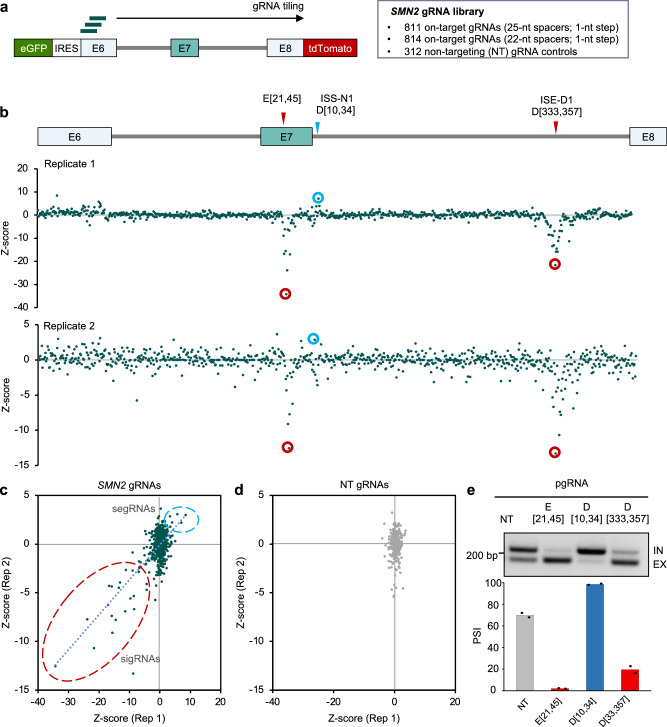
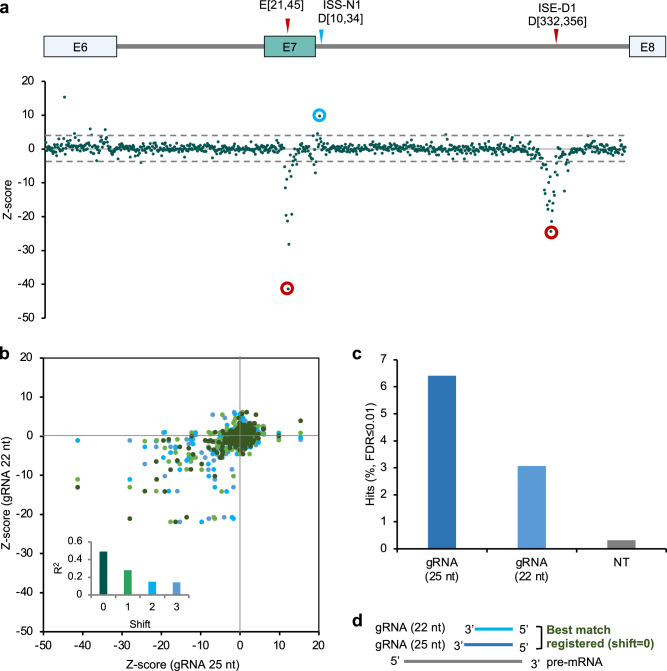
Pre-mRNA splicing, a key process in gene expression, can be therapeutically modulated using various drug modalities, including antisense oligonucleotides (ASOs). However, determining promising targets is hampered by the challenge of systematically mapping splicing-regulatory elements (SREs) in their native sequence context. Here, we use the catalytically inactive CRISPR-RfxCas13d RNA-targeting system (dCas13d/gRNA) as a programmable platform to bind SREs and modulate splicing by competing against endogenous splicing factors. SpliceRUSH, a high-throughput screening method, was developed to map SREs in any gene of interest using a lentivirus gRNA library that tiles the genetic region, including distal intronic sequences. When applied to SMN2, a therapeutic target for spinal muscular atrophy, SpliceRUSH robustly identifies not only known SREs but also a previously unknown distal intronic SRE, which can be targeted to alter exon 7 splicing using either dCas13d/gRNA or ASOs. This technology enables a deeper understanding of splicing regulation with applications for RNA-based drug discovery.


Conflict of interest statement

Y.R., D.U., and C.Z. are inventors on a patent application submitted based on this work. C.Z. is a co-founder of DAYI Therapeutics, Inc. The other authors declare no competing interests.

Figures

Fig. 1
Fig. 1. Overview of the SpliceRUSH screening method.
a Schematics showing the use of dCas13d/gRNA as a programmable RNA-binding platform to map both proximal and distal SREs in their native sequence context by binding to target transcripts and competing with endogenous RNA-binding proteins (RBPs) to positively or negatively modulate the transcript’s splicing. The example illustrates that blocking an intronic silencer element induces exon inclusion. Since steric hindrance is a shared mechanism between antisense oligonucleotides (ASOs) and dCas13d/gRNA, candidate SREs identified by the screen can be targeted with ASOs. b Schematic representation of the Dual-IN SMN2 splicing reporter with a frame-shifting exon 7 and flanking intronic and exonic regions. This reporter is fused to eGFP and an internal ribosomal entry site (IRES) upstream of exon 6, and tdTomato is downstream of exon 7, so that the construct expresses eGFP and tdTomato fluorescence when the frame-shifting exon is included in the transcript and only eGFP fluorescence when the frame-shifting exon is excluded. c Overview of the lentiviral- based pooled gRNA library screening. Cells stably expressing the dual-color splicing reporter and dCas13d-BFP are transduced with a pooled lentiviral gRNA library that tiles the entirety of the reporter’s genetic region. The cells are then sorted based on tdTomato and eGFP fluorescence. The subpopulation of cells with high tdTomato/eGFP ratio (top bin, splicing-enhancing gRNAs, or segRNAs, for the Dual-IN SMN2 splicing reporter) and low tdTomato/eGFP ratio (bottom bin, splicing-inhibiting gRNAs, or sigRNAs, for the Dual-IN SMN2 splicing reporter), together with unsorted cells, are collected for gRNA sequencing and bioinformatic analysis. The gRNAs enriched in the top and bottom bins are expected to target SREs that modulate the splicing of the frame-shifting exon. The schematics in panels a and c were generated using BioRender.
Fig. 2
Fig. 2. The effect of dCas13d/gRNA complex on splicing modulation by steric hindrance.
a Schematic representation of gRNAs (bottom) and ASOs (top) targeting known SREs in the Dual-IN SMN2 pre-mRNA, including the intronic splicing silencer element (ISS-N1) targeted by the nusinersen ASO. b Exon 7 inclusion shows a dosage-dependent increase upon treatment of the nusinersen ASO. A gel image of splicing products from RT-PCR analysis is shown at the top, and the quantification of exon inclusion levels (percent spliced in or Ψ) is shown at the bottom (N = 1). ce Testing dCas13d/gRNA effect on splicing modulation through transient expression. c RT-PCR analysis of SMN2 exon 7 inclusion levels after HEK293T cells were co-transfected with Dual-IN SMN2 splicing reporter (pSMN2), dCas13d-BFP (pdCas13d), and selected individual gRNAs (pgRNA) is shown. Various controls (first four lanes) were also included for comparison. Quantification shows the average of three or more replicates from independent gRNA transfections with an error bar representing the standard error of the mean (SEM). Published RT-PCR data from ASO-treated cells is plotted on the right, with gRNAs targeting similar sequences highlighted. d Fluorescence-based splicing readouts in cells co-transfected with Dual-IN SMN2, dCas13d-BFP, and gRNA. Datasets contain ≥5,000 BFP-positive events per sample. Data from splicing-inhibiting gRNA (E[22,40]) and splicing-enhancing gRNA (D[9,30]) are shown as two representatives (see Supplementary Fig. 3 for additional examples). For each gRNA, the FACS plot is shown on the top. The tdTomato and eGFP fluorescence intensities were used to derive an MA-contour plot, which is shown at the bottom. In the MA-contour plot, the y-axis reflects the exon inclusion level. Note the shift of cell populations on the y-axis when treated with the sigRNA E[22,40] (red) or the segRNA D[9,30] (blue), in comparison with cells treated with a non-targeting gRNA (gray). e Correlation of relative SMN2 exon 7 inclusion level in the log2 fold change scale in cells treated with different gRNAs vs. non-targeting control as quantified by FACS and RT-PCR. fh Testing a mini-library in a cell line with a DOX-inducible Dual-IN SMN2 and stable expression of dCas13d-BFP. f The gRNA composition of the mini-library and NT only controls. g The mini-library or NT control lentivirus was transduced into the Dual-IN SMN2/dCas13d-BFP cell line, and cells were fractionated by FACS into BFP-positive (dCas13d-expressing) and BFP-negative populations. Cells in each population were further sorted based on eGFP and tdTomato fluorescence. The FACS plot (top) shows tdTomato vs. eGFP intensity for cells transduced with the mini-library (dark green) overlaid on cells transduced with the NT control gRNA (gray). MA-contour plots are shown at the bottom, with cells transduced with the mini-library (green) overlaid on cells transduced with NT control (gray). For BFP-positive cells transduced with the mini-library, the sub-populations with high or low tdTomato vs. eGFP (i.e., top 5% and bottom 5% bins highlighted by the gray boxes) were collected for gRNA sequencing. h The enrichment of the two gRNAs and the NT control in the top vs. bottom bin, log2 (fold change), was calculated from two replicates of independent gRNA transductions.
Fig. 3
Fig. 3. Pooled gRNA library screening using the Dual-IN SMN2 splicing reporter identified a distal intronic SRE.
a Schematic showing the SMN2 gRNA library consisting of 25-nt and 22-nt spacers tiling the dual color splicing reporter and non-targeting (NT) control gRNAs. b gRNA enrichment, as measured by a Z-score comparing cells in the top and bottom bins sorted by tdTomato/eGFP ratio to the unsorted cells, is plotted against the SMN2 position (the first base pair corresponding to the 3ʹ end of the gRNA spacer; the same below) for two independent replicates. Results from 25-nt gRNAs are shown. Note that a positive Z-score reflects splicing activation, while a negative Z-score reflects splicing inhibition. Representative gRNAs targeting known SREs (E[21, 45] and D[10, 34]) and a previously unknown splicing enhancer in downstream intron ISE-D1 (D[333,357]) are highlighted. Correlation of Z-score for on-target (c) and NT (d) gRNAs between replicates. gRNAs inhibiting E7 splicing are circled in red, and gRNAs enhancing E7 splicing are circled in light blue. e Validation of the downstream intronic SRE by transfection of the SMN2 splicing reporter, dCas13d, and individual gRNA. sigRNA E[21, 45] and segRNA D[10, 34] were also included for comparison. A representative gel image of RT-PCR products is shown at the top, and the quantification of exon inclusion is shown at the bottom.
Fig. 4
Fig. 4. Pooled gRNA library screening using the Dual-EX SMN2 splicing reporter replicates Dual-IN reporter screening results.
a Schematic showing the Dual-EX SMN2 splicing reporter, which expresses eGFP and tdTomato fluorescence when the frame-shifting exon E7 is excluded and expresses eGFP only when E7 is included. b With the Dual-EX reporter, cells containing sigRNAs are expected in the top bin of the tdTomato/eGFP ratio, while cells containing segRNAs are expected in the bottom bin. c gRNA enrichment, as measured by a Z-score comparing cells in the top and bottom bins sorted by tdTomato/eGFP ratio, as compared to the unsorted cells, is plotted against the SMN2 position for two independent replicates. Results from 25-nt gRNAs are shown. Note that a positive Z-score reflects splicing inhibition, while a negative Z-score reflects splicing activation, in contrast to results from the Dual-IN reporter. Representative gRNAs targeting known SREs and the previously unknown splicing enhancer in downstream intron are highlighted. Correlation of Z-score for on-target (d) and NT (e) gRNAs between replicates. gRNAs inhibiting E7 splicing are circled in red, and gRNAs enhancing E7 splicing are circled in light blue.
Fig. 5
Fig. 5. The impact of gRNA spacer length on splicing modulation.
a gRNA enrichment, measured by a Z-score combining all replicate screens using Dual-IN and Dual-EX splicing reporters, is plotted against the SMN2 position. Results from 25-nt gRNAs are shown. Note that a positive Z-score reflects splicing activation, while a negative Z-score reflects splicing inhibition. Representative gRNAs targeting known SREs and the previously unknown splicing enhancer in downstream intron are highlighted. b Correlation of Z-scores from 25-nt gRNA with 22-nt gRNAs. Each 25-nt gRNA is compared with four different 22-nt gRNAs that fully cover it at different starting positions. Shift 0 is defined when the compared gRNAs have the same 5ʹ end, while shifts 1, 2, and 3 indicate when the 22-nt gRNA is shifted for that corresponding number of nucleotides towards the 3ʹ end (i.e., Shift 3 indicates the case when the two compared gRNA coincide at the 3ʹ end). The inset shows the squared correlation (R2) for each shift. c The percentage of statistically significant hits (FDR ≤ 0.01) for 25-nt and 22-nt on-target gRNAs and NT controls. d Illustration showing that the splicing modulatory effect of 25-nt gRNAs best correlates with matching 22-nt gRNAs with the same 5ʹ end.
Fig. 6
Fig. 6. Validation of endogenous SMN2 exon 7 splicing modulation through the distal intronic SRE ISE-D1 using dCas13d and ASOs.
a Schematics illustrating gRNAs and ASOs targeting the distal downstream intronic SRE, ISE-D1. gRNAs and ASOs targeting the exonic SRE and ISS-N1 region are also included for comparison. b, c Validation of a gRNA D[333, 357] and three ASOs (D[329, 353], D[333, 357], D[334, 358]) targeting the distal intronic SRE. b gRNAs E[21,45], D[10,34], and D[333,357] were individually transfected together with dCas13d into HEK293T cells to target the endogenous SMN2 pre-mRNA. Representative gel images of RT-PCR products measuring SMN2 endogenous isoforms are shown at the top, and quantification of endogenous SMN2 exon 7 splicing from two replicates of independent transfections is shown at the bottom. The restriction enzyme DdeI, specific for SMN2, was used to differentiate SMN1 and SMN2 transcripts. c A total of six ASOs [80 nM] targeting the SMN2 region were individually transfected into HEK293T cells. The endogenous SMN2 exon 7 splicing levels were measured using RT-PCR (top) and quantified in the bar plot using two replicates of independent transfections (bottom).

Update of

References

    1. Gilbert W. Why genes in pieces? Nature. 1978;271:501. doi: 10.1038/271501a0. - DOI - PubMed
    1. Berget SM, Moore C, Sharp PA. Spliced segments at the 5’ terminus of adenovirus 2 late mRNA. Proc. Natl Acad. Sci. USA. 1977;74:3171–3175. doi: 10.1073/pnas.74.8.3171. - DOI - PMC - PubMed
    1. Chow LT, Gelinas RE, Broker TR, Roberts RJ. An amazing sequence arrangement at the 5’ ends of adenovirus 2 messenger RNA. Cell. 1977;12:1–8. doi: 10.1016/0092-8674(77)90180-5. - DOI - PubMed
    1. Pan Q, Shai O, Lee LJ, Frey BJ, Blencowe BJ. Deep surveying of alternative splicing complexity in the human transcriptome by high-throughput sequencing. Nat. Genet. 2008;40:1413–1415. doi: 10.1038/ng.259. - DOI - PubMed
    1. Wang ET, et al. Alternative isoform regulation in human tissue transcriptomes. Nature. 2008;456:470–476. doi: 10.1038/nature07509. - DOI - PMC - PubMed

Publication types

MeSH terms

Substances