. 2024 May 7;15(1):3805.
doi: 10.1038/s41467-024-47514-y.

FGFR inhibition blocks NF-ĸB-dependent glucose metabolism and confers metabolic vulnerabilities in cholangiocarcinoma

Affiliations

FGFR inhibition blocks NF-ĸB-dependent glucose metabolism and confers metabolic vulnerabilities in cholangiocarcinoma

Yuanli Zhen et al. Nat Commun. .

Abstract

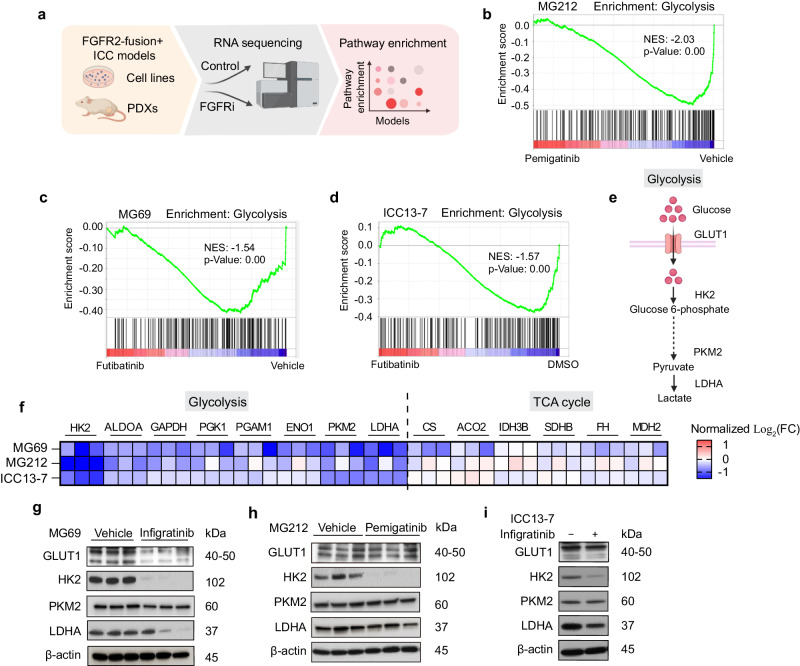
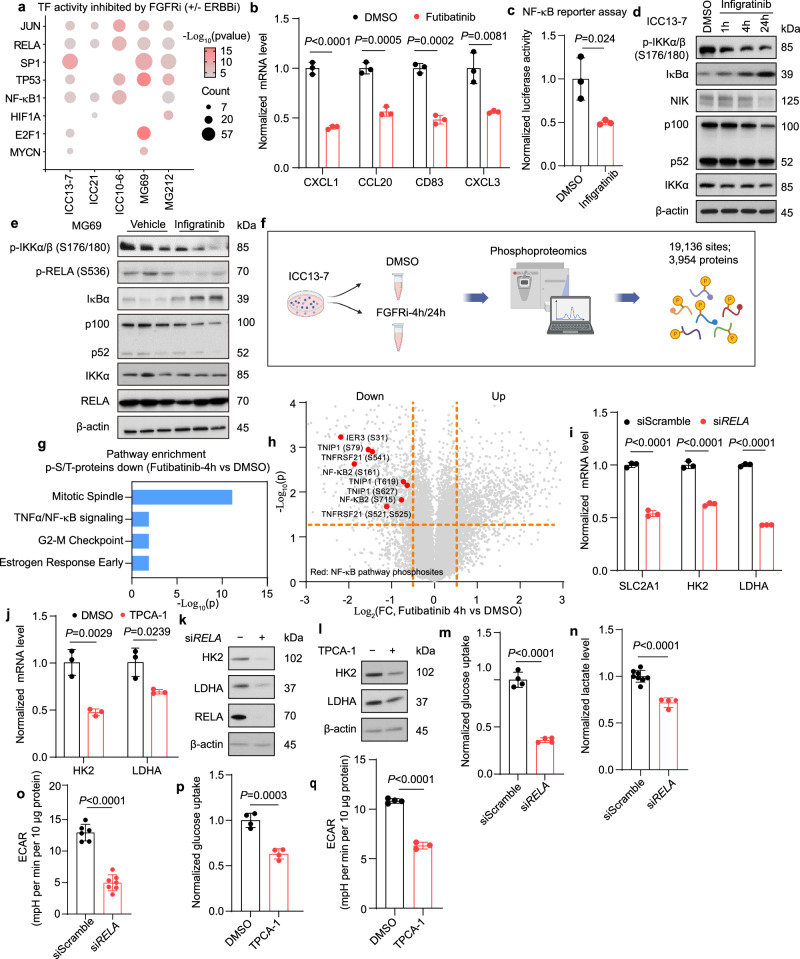
Genomic alterations that activate Fibroblast Growth Factor Receptor 2 (FGFR2) are common in intrahepatic cholangiocarcinoma (ICC) and confer sensitivity to FGFR inhibition. However, the depth and duration of response is often limited. Here, we conduct integrative transcriptomics, metabolomics, and phosphoproteomics analysis of patient-derived models to define pathways downstream of oncogenic FGFR2 signaling that fuel ICC growth and to uncover compensatory mechanisms associated with pathway inhibition. We find that FGFR2-mediated activation of Nuclear factor-κB (NF-κB) maintains a highly glycolytic phenotype. Conversely, FGFR inhibition blocks glucose uptake and glycolysis while inciting adaptive changes, including switching fuel source utilization favoring fatty acid oxidation and increasing mitochondrial fusion and autophagy. Accordingly, FGFR inhibitor efficacy is potentiated by combined mitochondrial targeting, an effect enhanced in xenograft models by intermittent fasting. Thus, we show that oncogenic FGFR2 signaling drives NF-κB-dependent glycolysis in ICC and that metabolic reprogramming in response to FGFR inhibition confers new targetable vulnerabilities.


Conflict of interest statement

N.B. reports research grant support from Kinnate Biopharma, Tyra Biosciences, and Servier Laboratories. D.J. reports grants and personal fees from Novartis, Genentech, Syros, and Eisai, grants from Pfizer, Ribon Therapeutics, Infinity, InventisBio, Cyteir, and Arvinas, and personal fees from Relay Therapeutics, Vibliome, Mapkure, and PIC Therapeutics outside the submitted work. The remaining authors declare no competing interests.

Figures

Fig. 1
Fig. 1. FGFR inhibition represses glycolytic gene expression in FGFR2-fusion + ICC.
a Schematic of workflow. bd GSEA (gene set enrichment analysis) of RNA-sequencing profiles using the Hallmark database, showing glycolysis pathway downregulation in the MG212 PDX model treated with pemigatinib (1 mg per kg, daily) versus vehicle for 11 days (b), in the MG69 PDX model treated with futibatinib (25 mg per kg, daily) versus vehicle for 14 days (c), and in ICC13-7 cells treated with 75 nM futibatinib versus DMSO for 24 h (d). The vertical black lines indicate the position of each of the genes of the studied gene set, and the green curve corresponds to the enrichment score (ES) curve obtained from GSEA software. NES normalized enrichment score. e Schematic of glycolysis pathway. f Heatmap of changes in mRNA expression of enzymes in glycolysis and TCA cycle upon FGFR2 inhibitor treatment in the indicated models. Data are normalized to the control condition and presented as Log2 transformation in each model. TCA: tricarboxylic acid; FC: fold change. gi Immunoblot of the indicated proteins in the MG69 PDX treated with infigratinib (15 mg per kg, daily) or vehicle for 10 days (g), MG212 PDX treated with pemigatinib or vehicle for 11 days (h), and ICC13-7 cells treated with 100 nM infigratinib or DMSO for 24 h (i). For the mice experiment, n = 3 per group. A representative example of three replicates is shown for (i). a, e Created with BioRender.com. Western blots were repeated three times. Source data are provided as a Source Data file.
Fig. 2
Fig. 2. Sustained FGFR2-signaling maintains hyperactive glucose metabolism.
a Schematic of workflow. FGFRi FGFR inhibitor. bd Metabolite levels were determined by LC–MS (liquid chromatography–mass spectrometry) of ICC13-7 cells treated with 100 nM infigratinib or DMSO for 24 h. b Volcano plot indicating the metabolite changes. Metabolites in glucose metabolism showing significant changes are represented as red dots and are identified by name. Other significantly changed metabolites are shown as black dots. FC fold change. c Analysis of enriched metabolic pathways by the MetaboAnalyst platform. d Heatmap depicting metabolite changes from different pathways. Data are normalized to the DMSO condition and presented as Log2 transformation. e, f Relative changes of glucose uptake (n = 4 biological replicates) (e) and lactate level in the medium (n = 5 biological replicates) (f) in ICC13-7 cells treated with 100 nM infigratinib or DMSO for 24 h. g, h Relative changes in extracellular acid rate (ECAR) (g) and oxygen consumption rate (OCR) (h) normalized to protein amount in ICC13-7 cells treated with 100 nM infigratinib (n = 8 samples) or DMSO (n = 7 samples) for 24 h. i Schematic of workflow for the 13C6-glucose tracing experiment. j Tracer scheme illustrating the flux of U-13C6-glucose to different glycolytic branches. Red circle: 13C; hollow circle: 12C. HBP hexosamine biosynthesis pathway; PPP pentose phosphate pathway, TCA tricarboxylic acid. k 13C enrichment of different metabolites after U-13C-glucose labeling for 1 or 24 h in ICC13-7 cells, which were treated with 100 nM infigratinib or DMSO for 24 h prior to labeling (n = 3 biological replicates). l Analysis of SLC2A1 dependency in FGFR2-fusion ICC (ICC13-7, ICC10, ICC10-6) and other cancer cell lines from Broad Institute Dependency Map (DepMap). Scores less than −0.5 denote essentiality. Data represent means ± SD. Student’s t-test (two-tailed) was performed. a, i, j Created with BioRender.com. Source data are provided as a Source Data file.
Fig. 3
Fig. 3. FGFR2-mediated reprogramming of glucose metabolism requires NF-κB.
a Downregulated transcriptional regulators in ICC models upon FGFR (±ERBB) inhibition based on the TRRUST database. Treatments: ICC13-7: 75 nM futibatinib or DMSO (24 h); ICC10-6 and ICC21: DMSO, 100 nM infigratinib, 100 nM afatinib, or the combination (4 h); PDX-MG212: 1 mg per kg pemigatinib or vehicle (11 days); PDX-MG69: 25 mg per kg futibatinib or vehicle (14 days). b Relative mRNA levels of NF-κB targets in ICC13-7 cells treated with 75 nM futibatinib or DMSO for 4 h (n = 3 biological replicates). c Normalized NF-κB-dependent luciferase activity in ICC13-7 cells treated 24 h with vehicle or 100 nM infigratinib (n = 3 biological replicates). d, e Immunoblot of NF-κB pathway proteins in ICC13-7 cells treated with DMSO or 100 nM infigratinib for the indicated times (d), and in MG69 treated with vehicle or infigratinib for 10 days (e). fh Phosphoproteomics on ICC13-7 cells treated with vehicle or FGFRi. f Schematic of study. Created with BioRender.com. g Pathway enrichment analysis (Hallmarks database) shows that futibatinib (75 nM, 4 h) downregulates Ser/Thr phosphorylation of NF-κB components in ICC13-7 cells. h Volcano plot of Ser/Thr phosphoproteome changes in ICC13-7 cells treated with 75 nM futibatinib for 4 h. Red dots: significantly downregulated phosphosites on NF-κB components. i Relative mRNA expression of the indicated glycolytic genes in ICC13-7 cells transfected with siRNA against RELA or control (n = 3 biological replicates) (i), and in ICC21 cells treated with 5 µM TPCA-1 or DMSO for 24 h (n = 3 biological replicates) (j). k, l Immunoblot of ICC13-7 cells treated with siRNA against RELA or control (k), or with 5 µM TPCA-1 or DMSO for 24 h (l). mo Relative changes of glucose uptake (n = 4 biological replicates) (m), lactate secretion (n = 8 samples for siScramble; n = 4 samples for siRELA) (n), and ECAR (n = 6 samples for siScramble; n = 7 samples for siRELA) (o) in ICC13-7 cells treated with siRNA against RELA or control. p, q Relative changes in glucose uptake (n = 4 biological replicates) (p) and ECAR (n = 4 samples for DMSO; n = 3 samples for TPCA-1) (q) in ICC13-7 cells treated with 5 µM TPCA-1 or DMSO for 24 h. For mouse experiments, n = 3 per group. Phosphoproteomics was performed in duplicate. Bar graphs: data represent means ± SD. Student’s t-test (two-tailed) was performed. Western blots were repeated three times. Source data are provided as a Source Data file.
Fig. 4
Fig. 4. FGFR inhibition leads to adaptative metabolic changes that maintain mitochondria respiration in FGFR2-fusion + ICC.
a Schematic of Mito Fuel Flex Test. b Mitochondria fuel use capacity and dependency in ICC13-7 cells treated with 100 nM infigratinib or DMSO for 24 h (n = 3 biological replicates). c FAO rate in ICC21 cells treated with 100 nM infigratinib or DMSO for 24 h (n = 12 samples). The box plot shows the center line as the median, and the whiskers’ boundary represents the minimum and maximum values of the dataset. The box extends from the 25th to 75th percentiles. d, e Relative mRNA expression of fatty acid synthesis (d) and FAO genes (e) in ICC13-7 cells treated with 75 nM futibatinib or DMSO for 24 h (n = 3 biological replicates). f Number and size of lipid droplets in ICC13-7 cells treated with DMSO or 100 nM infigratinib for 24 or 48 h, determined by BODIPY staining and confocal microscopy (n = 8 biological replicates). g Lipase activity in ICC13-7 cells treated with DMSO or 100 nM infigratinib for 48 h (n = 6 biological replicates). h Volcano plot indicating phosphoproteome changes in ICC13-7 cells treated with 75 nM futibatinib for 24 h. Upregulated phosphorylation sites (Log2(FC) > 0.5 and p < 0.05) are shown in blue. Red dots: significantly upregulated phosphosites on lipases. i Phosphorylation changes of lipases after 4- and 24-h treatment with 75 nM futibatinib (n = 2 biological replicates). j, k Mitochondrial morphology analysis (MitoTracker staining) of ICC13-7 cells treated with 100 nM infigratinib or DMSO for 24 h. j Representative images. Inset: higher magnification of boxed region. k Quantification of mitochondrial morphology states. Left, mitochondrial morphology scoring scheme. Right, Quantification (n = 9 images examined over 2 independent experiments). l Immunoblot of ICC13-7 cells treated with 100 nM infigratinib or DMSO for 4 h. Experiment repeated three times. m GSEA plots of Autophagy_Lysosome gene signature in ICC13-7 cells treated with 75 nM futibatinib or DMSO for 24 h. n Autophagy flux analyses via flow cytometry using LC3-GFP-mCherry reporter in ICC13-7 cells treated with DMSO or 100 nM infigratinib for 48 h (n = 3 biological replicates). o, p Immunofluorescence staining of LC3B in ICC13-7 cells treated with DMSO or 100 nM infigratinib for 48 h. o Representative images. p Quantification of LC3B fluorescence intensity per µm2 (n = 8 images for DMSO, n = 4 images for infigratinib over 2 independent experiments). Data represent means ± SD. Student’s t-tests (two-tailed) were performed for (be, g, hk, n, p). One-way ANOVA multiple comparisons were performed for (f). Scale bar: 10 µm. a, k Created with BioRender.com. Source data are provided as a Source Data file.
Fig. 5
Fig. 5. Targeting adaptive metabolic pathways and glucose restriction increases the effectiveness of FGFR inhibitor treatment in FGFR2 fusion + ICC.
a Crystal violet staining to assess viability of ICC13-7 cells treated with DMSO, single agent infigratinib 50 nM, ONC212 20 nM, or the combination in high glucose (11 mM) and low glucose (1 mM) conditions. The data shown are representative of results from three independent experiments. b 18F-FDG PET/CT (18F-fluorodeoxyglucose positron emission tomography and computed tomography) imaging of the ICC13-7 xenograft-bearing NSG mice upon 1 mg per kg pemigatinib or vehicle treatment for 4 days. Dashed lines highlight the tumors from xenografts. c, d Metabolite levels were determined by LC–MS of ICC13-7 xenografts from mice treated with pemigatinib 1 mg per kg (n = 3) or vehicle (n = 3) for 7 days. c Analysis of enriched metabolic pathways by the MetaboAnalyst platform. d Volcano plot indicating the metabolite changes. Metabolites in glucose metabolism showing significant changes are represented as red dots and are identified by name. e Schematic of intermittent fasting and treatment regimen. Created with BioRender.com. f Blood glucose concentration in mice harboring ICC13-7 xenografts. Mice were fed ad libitum or were fasted for 24 h (n = 5 mice per group). gi Mice harboring ICC13-7 xenografts with a starting tumor volume ~200 mm3 were treated daily with vehicle (n = 5), pemigatinib 1 mg per kg (n = 6), ONC212 50 mg per kg (n = 4), or the combination of both drugs (n = 8) for 15 days under the intermittent fasting regimen. Mouse weight (g), tumor volume change (h), and tumor weight (i) are shown. j, k IHC staining for Ki67 in ICC13-7 xenografts from the indicated treatment groups. j Representative images. k Quantification. Vehicle (n = 5), pemigatinib (n = 6), ONC212 (n = 4), and combo (n = 8). For bar graphs, data represent means ± SD. One-way ANOVA multiple comparisons were performed except for panel (f), which was calculated using the student’s t-test (two-tailed). Scale bar: 50 µm. Source data are provided as a Source Data file.

References

    1. Brindley PJ, et al. Cholangiocarcinoma. Nat. Rev. Dis. Prim. 2021;7:65. doi: 10.1038/s41572-021-00300-2. - DOI - PMC - PubMed
    1. Banales JM, et al. Cholangiocarcinoma 2020: the next horizon in mechanisms and management. Nat. Rev. Gastroenterol. Hepatol. 2020;17:557–588. doi: 10.1038/s41575-020-0310-z. - DOI - PMC - PubMed
    1. Oh, D.-Y. et al. Durvalumab plus Gemcitabine and Cisplatin in advanced biliary tract cancer. NEJM Evid.10.1056/EVIDoa2200015 (2022). - PubMed
    1. Cleary J. Extracellular domain in-frame deletions are therapeutically targetable genomic alterations that function as oncogenic drivers in cholangiocarcinoma. Cancer Discov. 2021;11:2488–2505. doi: 10.1158/2159-8290.CD-20-1669. - DOI - PMC - PubMed
    1. Arai Y. Fibroblast growth factor receptor 2 tyrosine kinase fusions define a unique molecular subtype of cholangiocarcinoma. Hepatology. 2014;59:1427–1434. doi: 10.1002/hep.26890. - DOI - PubMed

Publication types

MeSH terms