. 2024 May 7;15(1):3837.
doi: 10.1038/s41467-024-47932-y.

Longitudinal molecular profiling elucidates immunometabolism dynamics in breast cancer

Affiliations

Longitudinal molecular profiling elucidates immunometabolism dynamics in breast cancer

Kang Wang et al. Nat Commun. .

Abstract

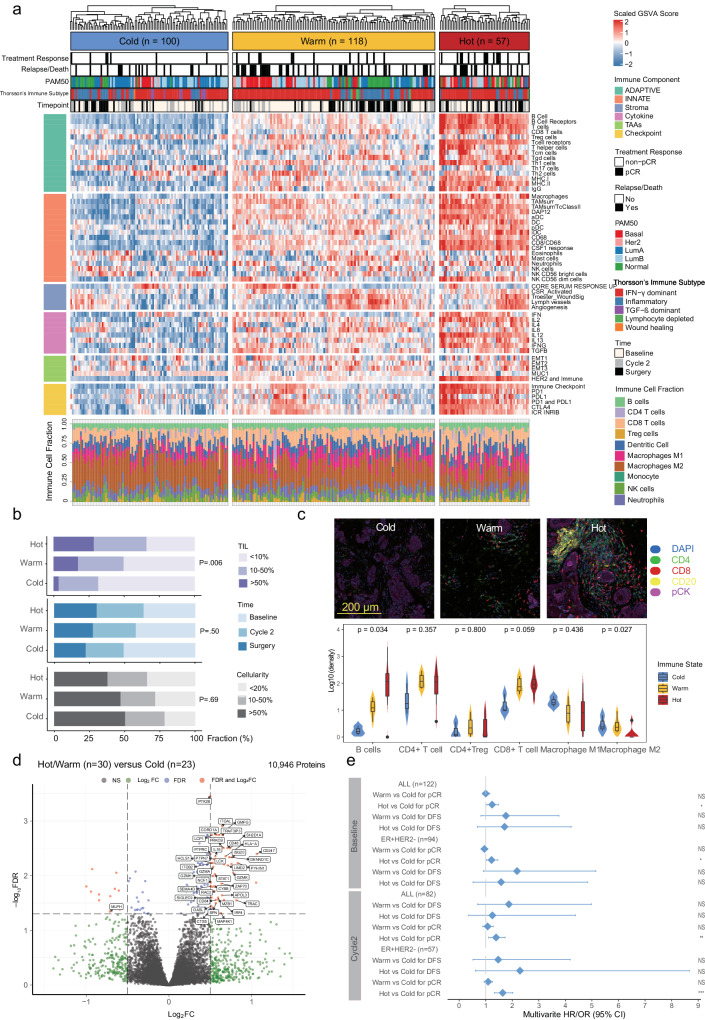
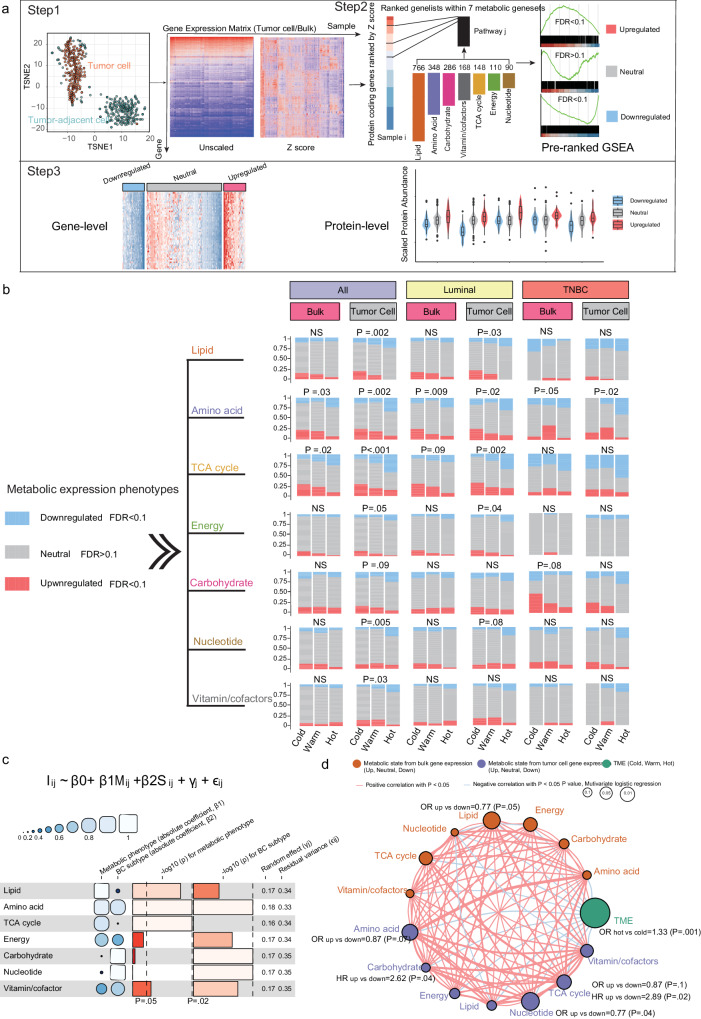
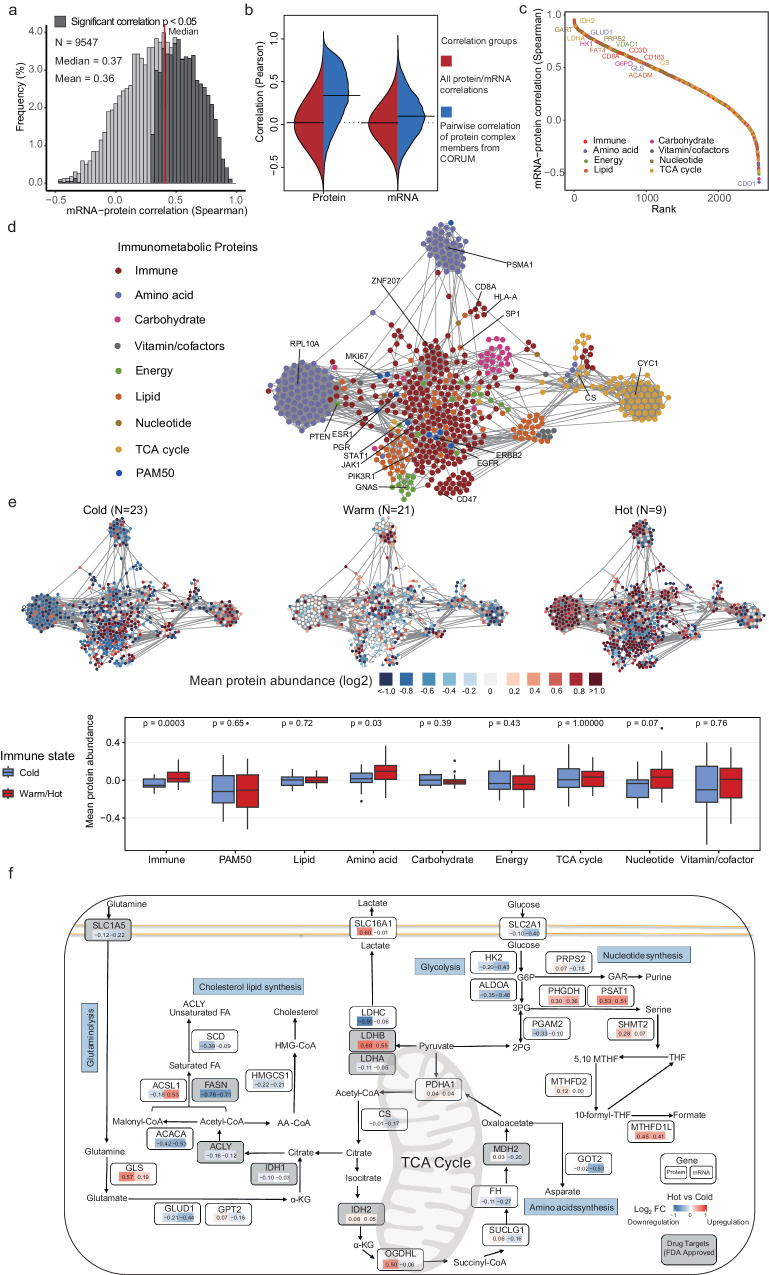
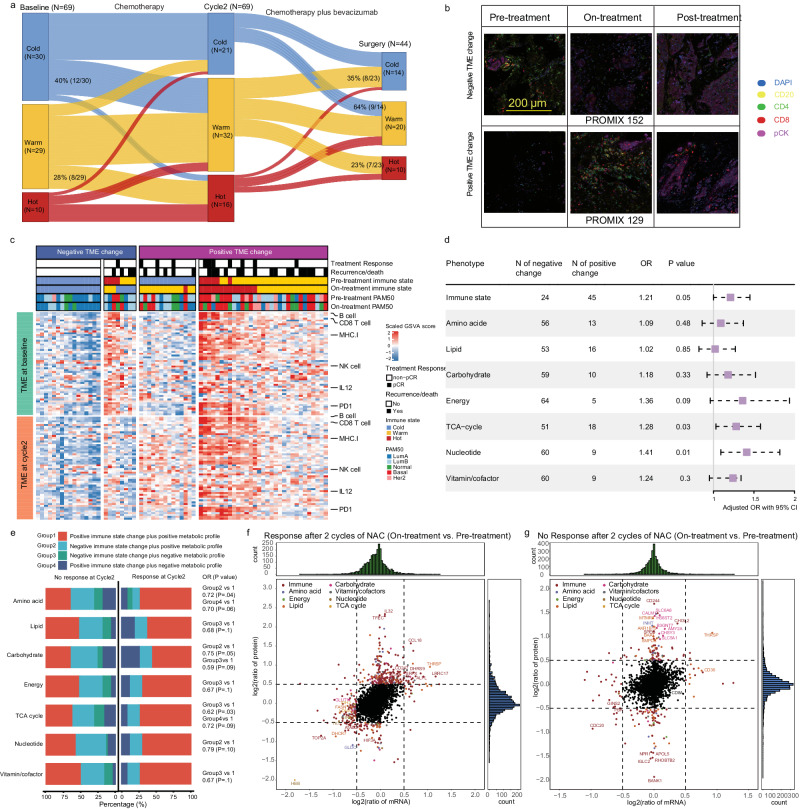
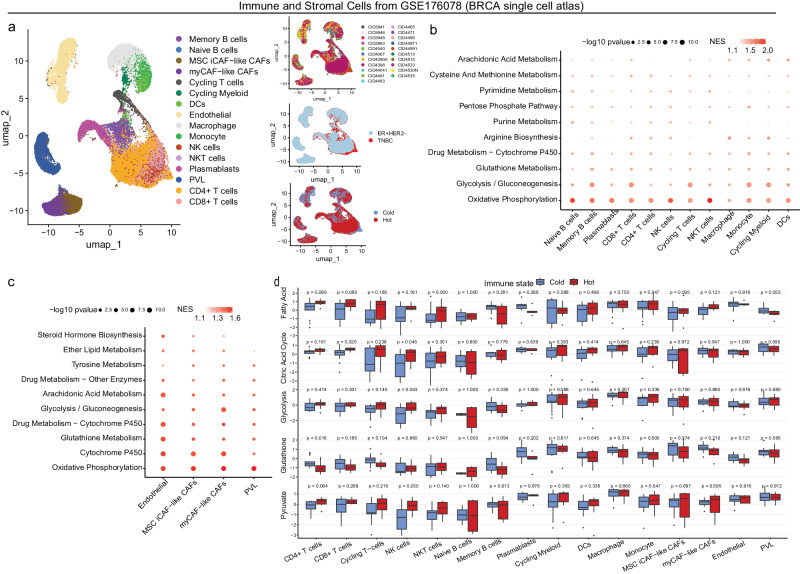
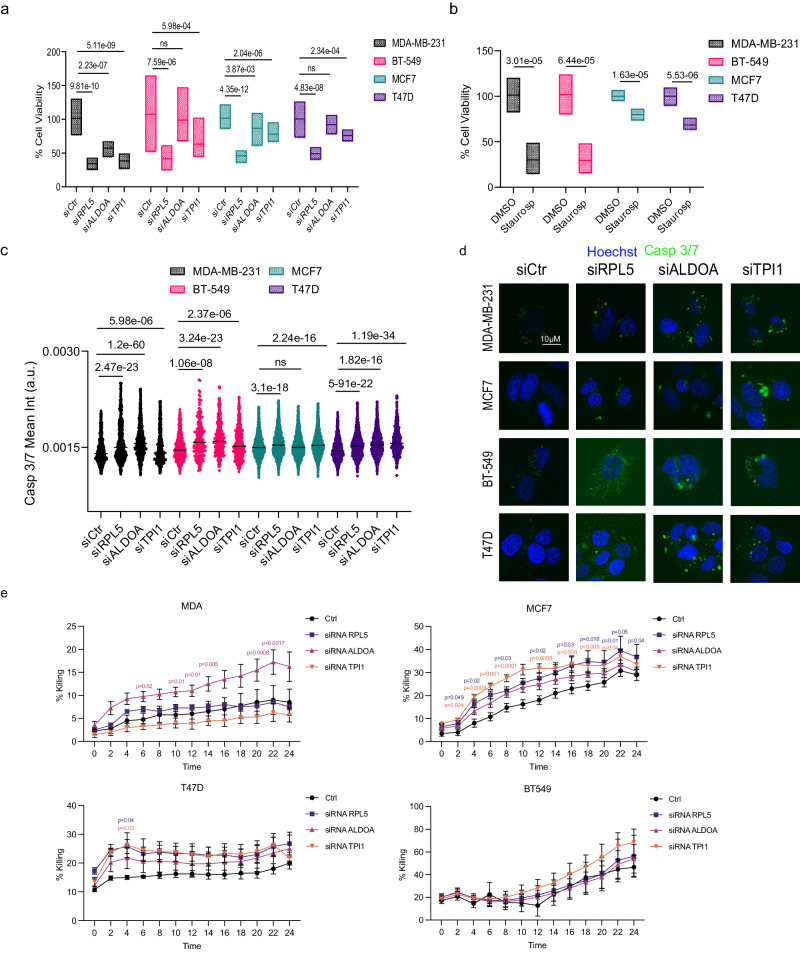
Although metabolic reprogramming within tumor cells and tumor microenvironment (TME) is well described in breast cancer, little is known about how the interplay of immune state and cancer metabolism evolves during treatment. Here, we characterize the immunometabolic profiles of tumor tissue samples longitudinally collected from individuals with breast cancer before, during and after neoadjuvant chemotherapy (NAC) using proteomics, genomics and histopathology. We show that the pre-, on-treatment and dynamic changes of the immune state, tumor metabolic proteins and tumor cell gene expression profiling-based metabolic phenotype are associated with treatment response. Single-cell/nucleus RNA sequencing revealed distinct tumor and immune cell states in metabolism between cold and hot tumors. Potential drivers of NAC based on above analyses were validated in vitro. In summary, the study shows that the interaction of tumor-intrinsic metabolic states and TME is associated with treatment outcome, supporting the concept of targeting tumor metabolism for immunoregulation.


Conflict of interest statement

Jonas Bergh reports grants from Amgen, AstraZeneca, Bayer, Merck, Pfizer, Roche, and Sanofi-Aventis outside the submitted work, as well as honoraria to Asklepios Medicine HB. In addition, Jonas Bergh is co-author on a chapter on prognostic and predictive factors in early, non-metastatic breast cancer in UpToDate; Jonas Bergh has also been offered stocks in Stratipath and offered to be consultant for that diagnostic company in early development. Niklas Loman reports honoraria for educational proposes and advisory boards received by his employer from Astra Zeneca, MSD, Roche, Gilead, and MSD; Janne Lehtio reports other support from Fenomark Diagnostics outside the submitted work; Janne Lehtio is involved in Cancer Core Europe BoB trial financed by Roche (not related to this work). Alexios Matikas reports other support from Veracyte and Roche outside the submitted work. Theodoros Foukakis reports institutional grants and personal fees from Novartis; institutional grants and personal fees from Pfizer; institutional grants from AstraZeneca; personal fees from Affibody, Exact Sciences, UpToDate and Veracyte; honoraria paid to his institution from Gilead, Pfizer, AstraZeneca and Roche outside the submitted work. No disclosures were reported by the other authors.

Figures

Fig. 1
Fig. 1. Overview of the study design and multi-omics data collection.
a Pre/on/post-treatment breast cancer tissue were collected from a phase II PROMIX trial (ClinicalTrials.gov identifier NCT00957125). Enrolled patients with locally advanced (tumor size > 20 mm) HER2-negative breast cancer, who were scheduled to receive six cycles of NAC with a combination of epirubicin and docetaxel. Bevacizumab was added during cycles 3–6 for those patients who did not achieve a clinical complete response (cCR) after the second cycle of NAC. For details on clinicopathologic characteristics, see Supplementary Table1. Fig1.a created using Biorender (https://biorender.com/). b Heatmap showing longitudinally in-depth MS-based proteomics, transcriptomics, genetic and mfIHC/IF profiling from PROMIX trial. c UpSet plot showing multi-omics data intersection. HER2 Human epidermal growth factor receptor-2, mfIHC multiplex fluorescent immunohistochemistry; MS mass spectrometry.
Fig. 2
Fig. 2. Immune state association with clinical outcomes.
a Unsupervised clustering using a joint latent variable model based on immune gene signatures and immune cell composition reveals distinct immune states of breast cancer (Supplementary Table2). b Distribution of TILs, sampling timepoints, and cellularity among the immune states, which is tested by two-sided chi-squared test or Fisher’s exact test (frequencies < 5). c Representative mfIHC images (stained for lymphocytic, macrophage and epithelial markers, i.e CD4, CD8, CD20, CD163, CD68, FoxP3 and Cytokeratin), for three immune states, and immune cells density (number of positive cells normalized to tissue area) between cold (n = 3), warm (n = 6) and hot (n = 7) tumors. Box plot wrapped in violin plot bounds the interquartile range divided by the median, with the whiskers extending to a maximum of 1.5 times the interquartile range beyond the box. Statistical significance (P-value) was determined using Kruskal-Wallis test. d Volcano plot showing differentially abundant proteins between hot/warm (n = 30) and cold tumors (n = 23), where the arrow indicates immune-related proteins. e Forest plot of multivariable Cox and Logistic regression analysis (n = 204) for DFS (HR with 95% CI) and pCR (OR with 95% CI), respectively, adjusting for IHC-based breast cancer subtype, tumor size and lymph node status (KI67 mRNA was additionally adjusted for DFS) (Supplementary Table3). The hazard ratios and odds ratios are shown with 95% confidence intervals. ***p < 0.001; **p < 0.01; *p < 0.05; NS p > 0.05. TILs tumor-infiltrating lymphocytes, mfIHC multiplex fluorescent immunohistochemistry, DFS disease-free survival, pCR pathologic complete response, ER estrogen receptor, HER2 Human epidermal growth factor receptor-2, OR odds ratio, HR hazard ratio, CI confidence interval.
Fig. 3
Fig. 3. Tumor cell GEP-based metabolic states interaction with immune states.
a Bioinformatics approach named PureMeta (https://github.com/WangKang-Leo/PureMeta) classified each sample into one of three GEP-based metabolic states (upregulated, neutral and downregulated) in seven metabolic pathways. Step 1, tumor cell gene expression profiling was extracted from bulk RNA microarray data using ISOpureR (1.1.3)92, and GEP of surgical samples (n = 5) without tumor cells (T0, N0) were regarded as reference. Step 2, GSEA pre-ranked analysis based on the gene set of each specific metabolic pathway was conducted, and the phenotype was determined based on FDR and Z scores. Step 3, tumor cell GEP-based metabolic phenotype was further validated on gene and protein levels. Box plot wrapped in violin plot bounds the interquartile range divided by the median, with the whiskers extending to a maximum of 1.5 times the interquartile range beyond the box. b Percentage of metabolic states in seven metabolic pathways for the three immune subtypes/states (from Fig. 2a), based on tumor cell or bulk GEP. Two-sided P-values were derived from the Chi-Square test or Fisher’s exact test. c Funky heatmap depicting the coefficient, random term, residual variance and p-value of LMEM, which was conducted within all samples to identify interaction effects between immune state (I) and tumor metabolic phenotypes (M), adjusting for the breast cancer subtype (S). d Interaction of metabolic phenotypes derived from bulk or tumor cell gene expression profiling and the immune states. Orange bubble, metabolic phenotype from bulk gene expression; Purple bubble, metabolic phenotype from tumor cell gene expression; Green bubble, immune state. The size of each cell represents pCR prediction of each phenotype, the calculation used the formula log10(multivariable logistic regression two-sided P-values) (for details, see Supplementary Table 4). The lines connecting bubbles represent immunometabolic interactions. The thickness of the line represents the strength of correlation estimated by Spearman correlation analysis. A positive correlation is indicated in red and a negative in blue. GEP, gene expression profiling; GSEA, gene set enrichment analysis; LMEM, linear mixed-effects model; pCR, pathologic complete response.
Fig. 4
Fig. 4. MS-based proteomic landscape of immunometabolic phenotype and pathways.
a Correlation between protein and mRNA quantitative values (Spearman) of individual genes. Correlation coefficient is considered statistically significant if two-sided P < 0.05 (dark gray bars). b Comparison of all pairwise correlations to correlations from known interaction pairs from CORUM database, using quantitative protein and RNA levels across 53 tumors (see Supplementary Fig. 8b for the same analysis using Biogrid interactions). c Ranked mRNA–protein correlations. d Breast cancer protein correlation network based on immunometabolic and PAM50 proteins (n = 2837 in total) using > 0.3 Pearson correlation and KCore > 2 cutoff. e Visualization of average proteome quantification of the three immune subtypes/states (from Fig. 2a) in the correlation network. Boxplot showing difference of mean protein abundance of each module between cold (n = 23) and warm/hot tumors (n = 30). Box plot bounds the interquartile range divided by the median, with the whiskers extending to a maximum of 1.5 times the interquartile range beyond the box. Outliers are shown as dots. Statistical significance (two-sided P-value) was determined using Wilcoxon rank-sum test. f Pathway diagram summarizing metabolic genes involved in the TCA cycle, glycolysis, nucleotide, amino acid, and cholesterol lipid synthesis and metabolism. Alterations are defined by significant upregulation or downregulation of protein abundance (left) and mRNA expression (right) between hot and cold tumors (expressed as log2(fold-change)). Red, upregulated genes/proteins in immunological hot tumor; blue, downregulated genes in the immunological hot tumor. The gray panel highlighted the FDA-approved drug targets. Figure4f created using Biorender (https://biorender.com/).
Fig. 5
Fig. 5. Proteogenomic analyses of paired pre/on-treatment samples revealed an association between changes in immunometabolism and response to NAC.
a Sankey plot of immune state changes from pre-treatment (baseline) to on-treatment (cycle2) and from on-treatment to post-treatment (surgery) (Supplementary Table 6). Numbers denote the number of samples in each immune state and the percentage of samples that switch from one immune state to another. b Representative mfIHC images from 16 independent experiments for patients with positive and negative immune state change, respectively. PROMIX patient 152: with negative immune state change, had early distant metastasis after 10 months of diagnosis occurred. PROMIX patient 129: with positive immune state change, had long-term DFS (66 months). c Immune signatures for 69 paired pre/on-treatment samples. Negative immune state change was defined if tumors conserved cold immune state or turned to a colder immune state after NAC, and vice versa for positive immune state change. d Forest plot depicting multivariable the logistic regression model (OR with 95% CI) adjusting for tumor size, lymph node status, and IHC subtype that assess the association between immunometabolism profiles and treatment response (pCR). e Bar plots showing the distribution of integrated immune state with tumor cell GEP based metabolic state change among response and no-response groups after two cycles of NAC (partial response versus stable disease or disease progression). Multivariable logistic regression was fitted, adjusting for tumor size, lymph node status, and IHC subtype (Supplementary Table. 7). f, g Scatterplot showing pair-wise differential protein (y-axis) and mRNA (x-axis) expression between on-treatment and pre-treatment samples in the response group and no response group (partial response versus stable disease or disease progression), respectively. The x/y axis shows the log2 (fold change). OR, odds ratio; CI, confidence interval.
Fig. 6
Fig. 6. Identification of metabolic reprogramming during immune state evolution by longitudinal single-nucleus RNA-seq.
a Single-nucleus RNA-seq using gene sets of the seven metabolic pathways identify five metabolic clusters (MC1-5) of breast epithelial cells pre/on/post-treatment breast cancer in PROMIX trial (n of sample = 16, n of cell = 3,039). b Feature plots showing sample ID, sampling timepoint, TME subtype, and cell type in each metabolic breast epithelial cell subcluster. c The percentage of metabolic epithelial cell cluster in each sampling timepoint by immune state change. d Heatmap of the top 10 differentially expressed genes compared to all other clusters in (a), and the arrow indicated metabolic-related genes. e The metabolic characteristics of each breast epithelial cell cluster (MC) were analyzed and quantified based on metabolic signature scores: MC1 (glycerolipid metabolism, log2FC = 7.4; cancer antigen presentation, log2FC = 2.5), MC2 (purine biosynthesis, log2FC = 2.5; folate one carbon, log2FC = 2.7; cell cycle, log2FC = 3.0; glycolysis, log2FC = 3.2; hypoxia, log2FC = 3.1; oxidative phosphorylation, log2FC = 3.0; citric acid cycle, log2FC = 2.7), MC3 (citric acid cycle, log2FC = 0.8; pantothenate and CoA, log2FC = 1.6; pyruvate metabolism, log2FC = 1.8), MC4 (steroid hormone metabolism, log2FC = 2.5; glutathione metabolism, log2FC = 0.8; retinol metabolism, log2FC = 2.7), MC5 (chemokines, log2FC = 1.7; notch signaling, log2FC = 0.8). All FDR < 0.05. f UMAP of metabolic breast epithelial cell clusters, colored by pseudotime, calculated using Monocle3 (1.3.4). g, h Heatmap of the expression levels of differentially expressed genes between pre- and post-treatment breast epithelial cells by immune state change. i Stacked violin plots of metabolic gene signature scores for pre- and post-treatment breast epithelial cells that significantly interacted with immune state change, where the FDR values derived from a Two-way ANOVA test with Interaction of TME change and time.
Fig. 7
Fig. 7. Metabolic heterogeneity of immune and stromal cells.
a UMAP dimensionality reduction diagram showing immune and stromal cell from HER2-negative subset of breast cancer single cell atlas (GSE176078) by sampleID, subtype, and immune state (n of sample = 21, n of cell = 54,652). Cell type was previously well annotated as follows: B cells Memory (memory B cells (CD79A, MS4A1, CD27), naive B cells (CD79A, MS4A1, IGHD), plasmablasts (IGKC and IGLC2), CD8 + T cells (CD3, CD8), CD4 + T cells (CD3, CD4), NK cells (KLRC1, KLRB1, NKG7, AREG), cycling T cells (CD3, MKI67), NKT cells (KLRC1, KLRB1, NKG7, FCGR3A), macrophage (CD86), monocyte (CD127), cycling myeloid (KI67), DCs (CLEC9A or CD1C), endothelial (PECAM1, CD34 and VWF), MSC iCAF−like CAFs (ALDH1A1, KLF4 and LEPR), myCAF−like CAFs (ACTA2 (αSMA), TAGLN, FAP and COL1A1), PVL (ACTA 2, PDGFRB and MCAM)). Metabolic pathways enriched in genes with highest contribution to the metabolic heterogeneities among immune cells (b) and stromal cells (c). The metabolic pathways with GSEA nominal p-value < 0.05 were considered as significant. d Represented metabolic pathways score of immune and stromal cells was compared between cold (n = 8) and hot (n = 7) tumors. Box plot bounds the interquartile range divided by the median, with the whiskers extending to a maximum of 1.5 times the interquartile range beyond the box. Outliers are shown as dots. TME tumor micro-environment, FC fold change, FDR false discovery rate, CAF cancer associated fibroblast, MSC mesenchymal stem cells, iCAFs inflammatory-like CAFs, DCs dendritic cell, PVL perivascular-like.
Fig. 8
Fig. 8. In vitro validation of TME-related metabolic targets.
a, b XTT assay of two luminal (MCF7, T47D) and two basal-like (MDA-MB-231, BT-549) breast cancer cell lines following a. the knock-down of RPL5, ALDOA or TPI1 or (b). treatment with Staurosporine. All growth assays were performed twice in sextuplicates (N = 12, knock-down) or triplicates (N = 6, Staurosporine). Data are shown as mean ± SD, Students t-test (treatments compared to siCtr or DMSO), ns: non-significant. The percentage of viable cells is shown inside the bards. c Cell apoptosis is shown as mean intensity (arbitrary units) of Caspase 3/7 following a 72-h knockdown of the same genes in the cell lines mentioned in (a). All apoptotic assays were performed twice with a total of N = 1000–2000 cells counted per experimental condition. Data are shown as mean ± SD, Students t-test (two-sided) (treatments compared to siCtr), ns: non-significant. d Representative immunofluorescence images used for the analysis presented in (c). Scale bar = 10 μm. e Tumor cell killing percentage following T-cell co-culturing in control cell lines and upon knock-down of RPL5, ALDOA or TPI1 for 24 h and 2 h time-lapse using live cell imaging. Cumulative data (n = 4) are shown as mean ± SEM, experiments were repeated twice with three technical replicates and eight biological replicates. Statistical analyses were performed using Dunnett’s multiple comparisons test presenting adjusted p-values (two-sided). TME tumor microenvironment.
Fig. 9
Fig. 9. Co-evolution of tumor clonality and immune state subtype under neoadjuvant chemotherapy.
a Subclone percentage difference (n =49) between immune states by sampling timepoint. Box plot bounds the interquartile range divided by the median, with the whiskers extending to a maximum of 1.5 times the interquartile range beyond the box. Two-side Wilcoxon rank sum tests were performed. b Swimming chart showing the treatment results (n = 20), the length of each bar represents the duration of DFS of each patient in the PROMIX trial. The patients were grouped by immune state change, and a chi-squared test (P = 0.008) was conducted based on immune state change (negative, positive) x clonal evolution (persistence, extinction) contingency table. c,d Examples of subclones with significant growth advantage relative to their parent that contain known metabolic drivers in patients with negative and positive immune state change. Results of PhylogicNDT analysis: most likely phylogenetic tree (top); permutations of sSNVs during tree construction yielding posterior CCFs of the clusters (with 95% credible intervals) (middle); and growth rates relative to parental clones (bottom). Significance of the differential growth rate (ΔGR > 0) was estimated based on the Markov Chain Monte Carlo (MCMC). Linear mixed model (two-sided p-values) was used to compare ΔGR between interest clones. TME tumor micro-environment, pCR pathologic complete response, DFS disease-free survival, CCF cancer cell fraction.

References

    1. Lüönd F, Tiede S, Christofori G. Breast cancer as an example of tumour heterogeneity and tumour cell plasticity during malignant progression. Br. J. Cancer. 2021;125:164–175. doi: 10.1038/s41416-021-01328-7. - DOI - PMC - PubMed
    1. Pusztai L, et al. Durvalumab with olaparib and paclitaxel for high-risk HER2-negative stage II/III breast cancer: Results from the adaptively randomized I-SPY2 trial. Cancer Cell. 2021;39:989–998.e985. doi: 10.1016/j.ccell.2021.05.009. - DOI - PMC - PubMed
    1. Schmid P, et al. Pembrolizumab for early triple-negative breast cancer. N. Engl. J. Med. 2020;382:810–821. doi: 10.1056/NEJMoa1910549. - DOI - PubMed
    1. Hatschek T, et al. Neoadjuvant trastuzumab, pertuzumab, and docetaxel vs trastuzumab emtansine in patients with ERBB2-positive breast cancer: a phase 2 randomized clinical trial. JAMA Oncol. 2021;7:1360–1367,. doi: 10.1001/jamaoncol.2021.1932. - DOI - PMC - PubMed
    1. Loibl S, et al. Addition of the PARP inhibitor veliparib plus carboplatin or carboplatin alone to standard neoadjuvant chemotherapy in triple-negative breast cancer (BrighTNess): a randomised, phase 3 trial. Lancet Oncol. 2018;19:497–509. doi: 10.1016/S1470-2045(18)30111-6. - DOI - PubMed

Publication types