. 2024 May 7;15(1):3844.
doi: 10.1038/s41467-024-48091-w.

The genomic landscape of Vk*MYC myeloma highlights shared pathways of transformation between mice and humans

Affiliations

The genomic landscape of Vk*MYC myeloma highlights shared pathways of transformation between mice and humans

Francesco Maura et al. Nat Commun. .

Abstract

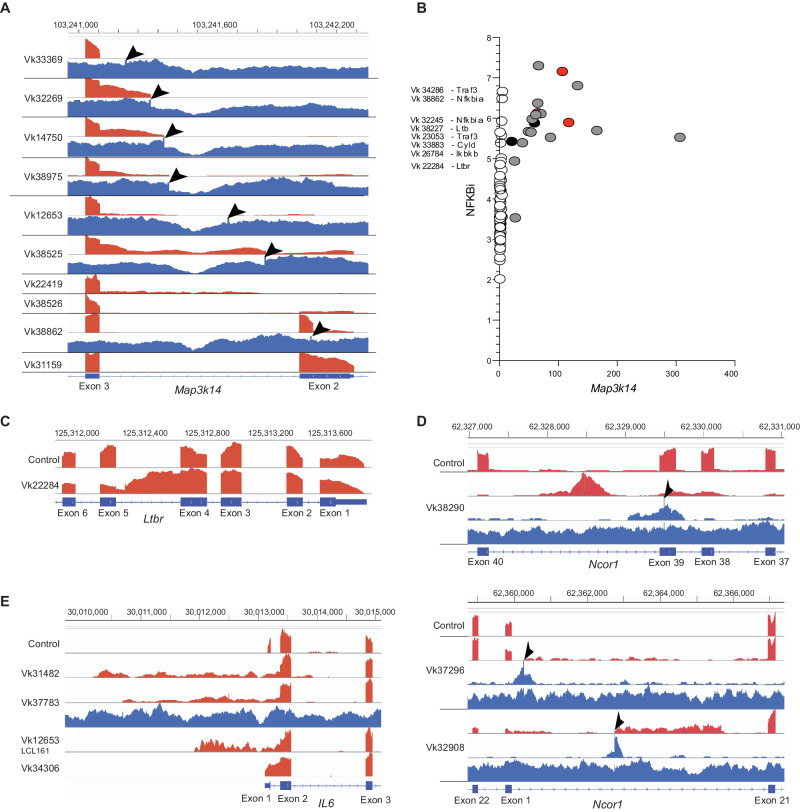
Multiple myeloma (MM) is a heterogeneous disease characterized by frequent MYC translocations. Sporadic MYC activation in the germinal center of genetically engineered Vk*MYC mice is sufficient to induce plasma cell tumors in which a variety of secondary mutations are spontaneously acquired and selected over time. Analysis of 119 Vk*MYC myeloma reveals recurrent copy number alterations, structural variations, chromothripsis, driver mutations, apolipoprotein B mRNA-editing enzyme, catalytic polypeptide (APOBEC) mutational activity, and a progressive decrease in immunoglobulin transcription that inversely correlates with proliferation. Moreover, we identify frequent insertional mutagenesis by endogenous retro-elements as a murine specific mechanism to activate NF-kB and IL6 signaling pathways shared with human MM. Despite the increased genomic complexity associated with progression, advanced tumors remain dependent on MYC. In summary, here we credential the Vk*MYC mouse as a unique resource to explore MM genomic evolution and describe a fully annotated collection of diverse and immortalized murine MM tumors.


Conflict of interest statement

MC and PLB receive royalties from Vk*MYC, Vk*MYChCRBN mice and derivative transplantable lines. The remaining authors declare no competing interests.

Figures

Fig. 1
Fig. 1. Somatic, non-synonymous single nucleotide variants and indels in driver genes of Vk*MYC MM.
A Oncoplot of mutated driver genes detected by the dN/dS method or any nonsynonymous mutations found in a known MM driver genes. B Boxplot comparing nonsynonymous mutational burden of Vk*MYC MM (n = 68) and human MGUS/SMM with stable disease (SD = 15), MGUS/SMM with progressive disease (PD, n = 17), and MM (n = 29). Boxplots display the median, quartiles, and variability of the data. C Bar plot showing differentially mutated genes according to Vk*MYC MM type between in vitro and in vivo (i.e., de novo or transplant). Two-side p value were estimated using Fisher exact test.
Fig. 2
Fig. 2. Recurrent focal and broad copy number alterations in Vk*MYC MM.
A Significant CNA GISTIC2.0 whole chromosome and focal peaks and involved genes across 96 Vk*MYC MM mice. B Heatmap summarizing the copy number abnormalities of unique Vk*MYC MM, included in the GISTIC analysis. C Example molecular time analysis for the indicated clonal chromosomal gain in one representative Vk*MYC mouse. The confidence of interval were generated using bootstrap function in the mol_time package (https://github.com/UM-Myeloma-Genomics/mol_time). D Molecular time comparison between Vk*MYC mouse (n = 19) and human MM (n = 21). P values were estimated using two-side Wilcoxon text. Boxplots display the median, quartiles, and variability of the data. E Percentage of male and female Vk*MYC MM with an M-spike greater than 7 g/L, measured every 10 weeks by serum protein electrophoresis. The number of mice analyzed is indicated, as well as the log-rank P values calculated by the log-rank (Mantel-Cox) test.
Fig. 3
Fig. 3. Vk*MYC structural variants (SV) landscape.
A Barplot summarizing the prevalence and distribution of SV and complex events across 52 Vk*MYC MM. B Number of Vk*MYC MM mice with SV involving key oncodrivers. C–E Representative examples of SV events involving oncodrivers. BFB: breakage-fusion-bridge. The horizontal black line indicates the total copy number; the dashed orange line indicates the minor copy number. The vertical lines represent SV breakpoints: black: translocations; red: deletions, green: tandem-duplications; blue: inversion. F Circus plot showing all the immunoglobulin translocations detected. G Impact of immunoglobulin translocations on the partners’ gene expression (colored dots). Boxplots display the median, quartiles, and variability of the data. A total of 50 Vk*MYC WGS with paired RNAseq was included in this analysis.
Fig. 4
Fig. 4. LTR retrotransposition mediated gene dysregulation.
A Read depth for RNA (red) and whole genome (blue) sequencing of Vk*MYC tumor lines for Map3k14 is shown. By sequence analysis the 5’end of the RNA for these samples originates in an IAP LTR. The IAP insertion site in the DNA is marked by a 6–8 nucleotide duplication indicated by the arrowheads. The RNA for Vk31159 upstream of exon 2 originates from IAP LTR sequences, and WGS identifies an IAP insertion site at chr11:103253336 in intron 1 (not shown). B Gene expression NFkB index plotted versus Map3k14 expression (RPKM). Each dot represents an individual tumor; in grey are highlighted those with a mapped IAT insertion, in red those with an Ig translocation and in black those with unaccounted Map3k14 overexpression. The mutated gene in other samples with high NFkB index are listed. C Read depth for RNA (red) for Ltbr in Vk22284 with arrowhead highlighting the 6 nucleotide duplication at the IAP insertion site D Read depth for RNA (red), discordant reads from whole genome (upper blue), and all reads from whole genome (lower blue) sequencing of Vk*MYC tumor lines is shown. The IAP insertion site in the DNA is marked by a 6–8 nucleotide amplification indicated by the arrowheads, and is most easily seen visualizing the discordant reads only. Exon numbering for Ncor1 is from reference transcript NM_011038. The exon labelled 1 is an alternatively spliced exon of Ncor1 not included in any reference transcripts. It has also been identified as the first exon of Rip13a/Ncor1, an Ncor1 isoform lacking repressor domains. E Read depth for RNA (red) and whole genome (blue) sequencing of Vk*MYC tumor lines for Il6 is shown. By sequence analysis the 5’end of the RNA for these samples originates in an IAP LTR. The IAP insertion site in the DNA is marked by a 6-8 nucleotide amplification indicated by the arrowheads.
Fig. 5
Fig. 5. The genomic landscape of the Vk*MYC mouse model of MM.
A Heatmap summarizing all the key oncodrivers involved by somatic events in the Vk*MYC MM. Only CNV involving MM oncodrivers and with a length smaller than 3.5 mb are reported. B–C XY scatterplot of percent of immunoglobulin transcription versus gene expression proliferation in murine, B, and human, C, plasma cell tumors. The % of IG transcription is derived from RNASeq and the GPI score is the mean of the log2 transformed TPMs of the 50-genes comprising GPI29. The Pearson correlation score is indicated. D Graphic representation of the Vk*MYC construct (not to scale). Green squares represent the kappa variable region and human MYC exons. The position of the two LoxP sites flanking the 3’ Kappa enhancer is shown, as well as their recombination following tamoxifen-induced CRE expression. The horizontal arrow indicates the transcription start point. E M-spike levels measured four weeks after tamoxifen treatment and normalized to day 0 levels in mice bearing Vk21153 Vk*MYCDLox/CreERT2 and Vk22284 Vk*MYC/CreERT2 MM tumors. Boxplot is presented as mean values +/− standard deviation. ** Indicate the two-tailed unpaired t test P value = 0.0022.
Fig. 6
Fig. 6. Vk*MYC mouse MM Single base substitutions (SBS) mutational signatures landscape.
A Barplot showing the contribution of each mutational signatures for each WGS. ROS: radical oxygen stress. B Number of SBS84 (AID) clustered mutations in human (n = 30) and mice (n = 41) involving either immunoglobulin (Ig) or off-target genes. C Percentage of somatic mutation (SNV per 100 base pair) at the productive immunoglobulin allele across tumor types. Each circle represents an individual tumor; in pink are highlighted IgM expressing Vk*MYC MM tumors. D Distribution of immunoglobulin isotypes across Vk*MYC MM tumors. E Example of a 96-classes profile from a Vk*MYC mouse MM with clear APOBEC mutational activity. F Proportion of mutational signature due to APOBEC across Vk*MYC mouse (n = 41) and human MM (n = 30) and precursor conditions. MPC SD: stable myeloma precursor conditions (n = 13); MPC PD (n = 17): progressive precursor conditions. For human we included previously published data by Oben et al. Nat Comm 2021. Boxplot is presented as mean values +/− standard deviation. G Proportion of mutational signature due to APOBEC across clonal and subclonal SBS in Vk*MYC mouse MM. Two-side p-values were estimated using paired Wilcoxon text. Boxplot is presented as mean values +/− standard deviation.
Fig. 7
Fig. 7. Single cell RNA expression of Apobec1 and Apobec3 across different immune populations in the Vk*MYC mouse.
A UMAP analysis of all cells analyzed color coded by cell type. B Expression of Vk*MYC transcript in plasma cells. C–D Expression of Apobec1 (C) and Apobec3 (D) in plasma cells plasma cells. E–F Difference in Apobec1 (E) and Apobec3 (F) expression a cross different cell populations. Two-sided p values were estimated using the Wilcoxon test. Boxplots are presented as mean values +/− standard deviation.

References

    1. Kyle RA, et al. Long-Term Follow-up of Monoclonal Gammopathy of Undetermined Significance. N. Engl. J. Med. 2018;378:241–249. doi: 10.1056/NEJMoa1709974. - DOI - PMC - PubMed
    1. Maura F, Rustad EH, Boyle EM, Morgan GJ. Reconstructing the evolutionary history of multiple myeloma. Best. Pr. Res Clin. Haematol. 2020;33:101145. doi: 10.1016/j.beha.2020.101145. - DOI - PMC - PubMed
    1. Landgren O, et al. Monoclonal gammopathy of undetermined significance (MGUS) consistently precedes multiple myeloma: a prospective study. Blood. 2009;113:5412–5417. doi: 10.1182/blood-2008-12-194241. - DOI - PMC - PubMed
    1. Weiss BM, Abadie J, Verma P, Howard RS, Kuehl WM. A monoclonal gammopathy precedes multiple myeloma in most patients. Blood. 2009;113:5418–5422. doi: 10.1182/blood-2008-12-195008. - DOI - PMC - PubMed
    1. Dutta AK, et al. MinimuMM-seq: Genome Sequencing of Circulating Tumor Cells for Minimally Invasive Molecular Characterization of Multiple Myeloma Pathology. Cancer Discov. 2023;13:348–363. doi: 10.1158/2159-8290.CD-22-0482. - DOI - PubMed

Publication types