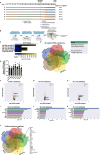
Fig. 6. Age and AD-related impairments in hippocampus-dependent memory and synaptic plasticity are associated with reduced Acvr1c expression which are ameliorated by overexpressing Acvr1c.
A Left: Acvr1c mRNA is reduced in aging mouse dorsal hippocampus independent two-sample t-test (two-tailed): (t(26) = 2.72, P = 0.01). Sex differences were not observed (Two-way ANOVA Sex): (F(1,24) = 0.43, P = 0.50, interaction P > 0.05), indicating that Acvr1c is reduced with age in both sexes, (young: n = 12, aging: n = 16). Right: Acvr1c levels (transcripts per million (TPM)) are reduced in the aging human hippocampus independent two-sample t-test (two-tailed): (t(91) = 6.64, P = 0.0001). Ages displayed map to mouse ages for young (3 mo.) and aging (20 mo.), (n = 5 20–29-year-olds, n = 88 60–69-year-olds), accessed from the GTEx project expression database. B Discrimination Index (DI) scores during object location memory (OLM) training reveal no differences between groups independent two-sample t test (two-tailed): (t(12) = 1.988, P = 0.070), (n = 7/group). C Mice from both groups have similar levels of total object exploration independent two-sample t test (two-tailed): (t(12) = 0.259, P = 0.799), (n = 7/group). D
Acvr1c overexpression (WT) ameliorates age-related impairments in OLM independent two-sample t test (two-tailed): (t(12) = 2.350, P = 0.036), (n = 7/group). E Exploration did not differ between groups on test independent two-sample t test (two-tailed): (t(12) = 0.817, P = 0.429), (n = 7/group). F Measurement of LTP as mean ± SEM fEPSP slope overtime (empty vector (EV); n = 5 mice, n = 10 slices; ACVR1C-WT; n = 3 mice, n = 6 slices). Theta burst stimulation (TBS) applied at arrow. Inset; representative traces collected during baseline (black line) and 60 min post-TBS (red line) from ACVR1C-WT and EV group. Scale = 1 mV/5 ms. G Mean ± SEM level of potentiation 50–60 min post TBS showing that Acvr1c overexpression enhances LTP in slices from 18 mo. C57BL6/J mice relative to EV control independent two-sample t test (two-tailed): (t(6) = 3.540, P = 0.0122), (EV; n = 5 mice, n = 10 slices; ACVR1C-WT; n = 3 mice, n = 6 slices). H RNA-Seq data displaying transcripts per million (TPM) shows decreases in Acvr1c with age (Three-way ANOVA), Age: (F(2,48) = 54.95, P < 0.0001), that become exacerbated in 5xFAD mice (Genotype: F(1,48) = 6.39, P = 0.01). Sex differences were not observed, Sex: (F(1,48) = 0.40), P = 0.53, Age x Sex: P = 0.233, Age x Genotype: P = 0.387, Genotype x Sex: P = 0.037, Age x Genotype x Sex: P = 0.244. Tukey’s post hoc test (compared between C57BL/6 J groups): **P < 0.01, ***P < 0.001, ****P < 0.0001, (compared between 5xFAD groups): ++P < 0.01, ++++P < 0.0001, (C57: 4 mo.: n = 10, 8 mo.: n = 11, 12 mo.: n = 10; 5xFAD: 4 mo.: n = 10, 8 mo.: n = 9, 12 mo.: n = 10). I Discrimination Index (DI) scores during training reveal no differences between groups independent two-sample t test (two-tailed): (t(21) = 0.556, P = 0.583), (EV: n = 10, ACVR1C-WT: n = 13). J Mice from both groups have similar levels of total object exploration on training independent two-sample t test (two-tailed): (t(21) = 1.459, P = 0.159), (EV: n = 10, ACVR1C-WT: n = 13). K
Acvr1c overexpression (WT) ameliorates AD-related impairments in OLM independent two-sample t-test (two-tailed): (t(21) = 2.287, P = 0.032), (EV: n = 10, ACVR1C-WT: n = 13). L Exploration did not differ between groups on test independent two-sample t-test (two-tailed): (t(21) = 0.149, P = 0.883), (EV: n = 10, ACVR1C-WT: n = 13). M Measurement of LTP as mean ± SEM fEPSP slope overtime (EV; n = 4 mice, n = 8 slices; ACVR1C-WT; n = 5 mice n = 10 slices). TBS applied at arrow. Inset; representative traces collected during baseline (black line) and 60 min post-TBS (red line) from ACVR1C-WT and EV group. Scale = 1 mV/5 ms. N Mean ± SEM level of potentiation 50–60 min post TBS showing that Acvr1c overexpression enhances LTP in slices from 12 mo. 5xFAD mice relative to EV control independent two-sample t test (two-tailed): (t(7) = 3.852, P = 0.0063), (EV; n = 4 mice, n = 8 slices; ACVR1C-WT; n = 5 mice n = 10 slices). ###P < 0.001 compared with training day (within group). *P < 0.05, **P < 0.01, ****P < 0.0001. Data are presented as mean ± SEM.