. 2024 May 7;10(1):98.
doi: 10.1038/s41531-024-00704-3.

Genetic variation and pesticide exposure influence blood DNA methylation signatures in females with early-stage Parkinson's disease

Affiliations

Genetic variation and pesticide exposure influence blood DNA methylation signatures in females with early-stage Parkinson's disease

S L Schaffner et al. NPJ Parkinsons Dis. .

Abstract

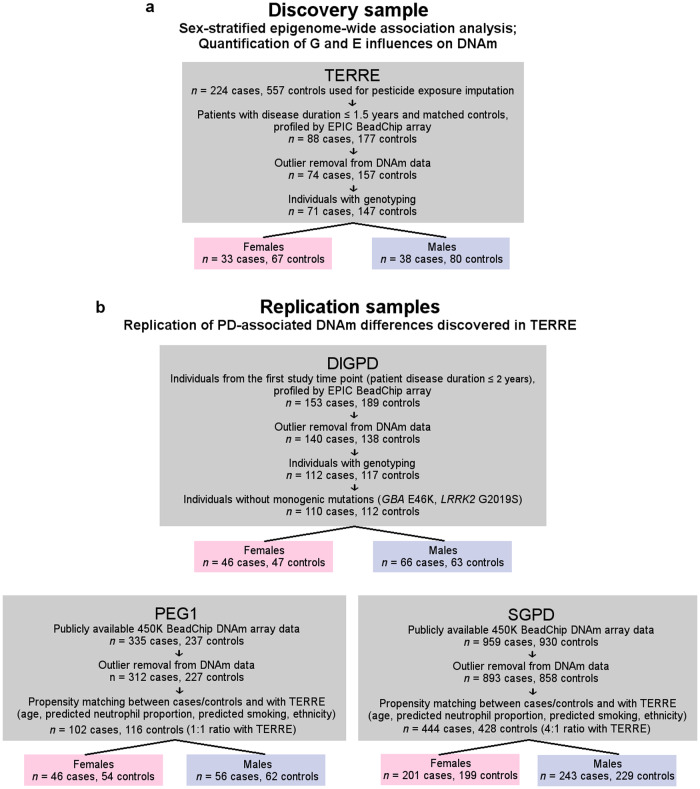
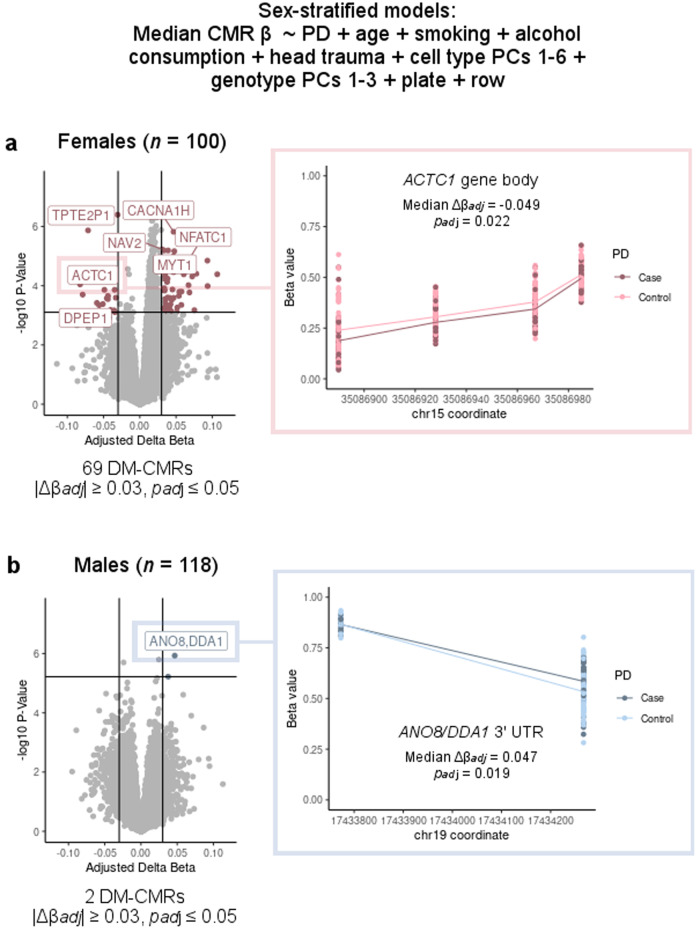
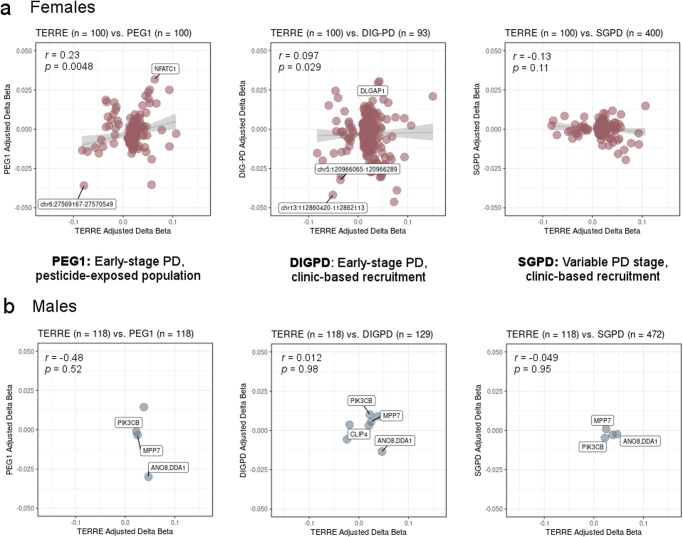
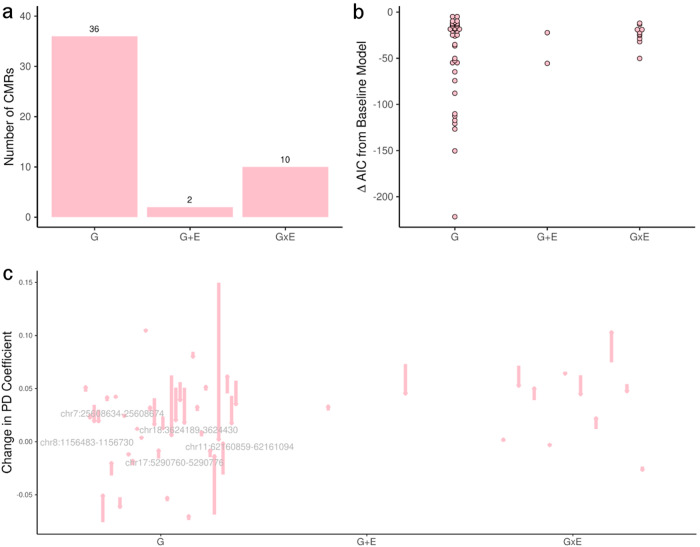
Although sex, genetics, and exposures can individually influence risk for sporadic Parkinson's disease (PD), the joint contributions of these factors to the epigenetic etiology of PD have not been comprehensively assessed. Here, we profiled sex-stratified genome-wide blood DNAm patterns, SNP genotype, and pesticide exposure in agricultural workers (71 early-stage PD cases, 147 controls) and explored replication in three independent samples of varying demographics (n = 218, 222, and 872). Using a region-based approach, we found more associations of blood DNAm with PD in females (69 regions) than in males (2 regions, Δβadj| ≥0.03, padj ≤ 0.05). For 48 regions in females, models including genotype or genotype and pesticide exposure substantially improved in explaining interindividual variation in DNAm (padj ≤ 0.05), and accounting for these variables decreased the estimated effect of PD on DNAm. The results suggested that genotype, and to a lesser degree, genotype-exposure interactions contributed to variation in PD-associated DNAm. Our findings should be further explored in larger study populations and in experimental systems, preferably with precise measures of exposure.


Conflict of interest statement

The authors declare no competing interests.

Figures

Fig. 1
Fig. 1. Overview of discovery and replication samples assessed in this study.
a Discovery sample (TERRE). b Replication samples (PEG1, DIGPD, and SGPD). The final numbers of individuals retained after propensity matching on the indicated variables 1) between cases and controls, within each sample, followed by 2) with TERRE are shown.
Fig. 2
Fig. 2. Predicted immune cell composition in PD cases and controls from TERRE, stratified by sex.
a Predicted cell type proportions in females from TERRE (n = 100). Dark pink: PD cases; bright pink: controls. b Predicted cell type proportions in males from TERRE (n = 118). Dark blue: PD cases; light blue: controls. padj > 0.05 for all case-control comparisons (t test with Benjamini–Hochberg adjustment). Centre line: median; box limits: 25th and 75th percentiles; whiskers: 1.5 × interquartile range.
Fig. 3
Fig. 3. Overview of pesticide exposure, DNA methylation, and genotype data generation and analysis in TERRE.
a Pipeline for collection of pesticide exposure history, identification of differentially methylated regions, and SNP genotyping. b Overview of quantification of G, E, and G × E effects using AIC to rank variance explained by G, E, G + E, and G × E models at each co-methylated region (CMR). Pesticide icon created by Iconjam—Flaticon. Notepad icon created by Freepik—Flaticon. DNA helix icon created by ranksol graphics—Flaticon.
Fig. 4
Fig. 4. PD-associated differentially methylated CMRs identified with sex stratification.
a Volcano plot: adjusted PD case-control DNAm differences in females from TERRE (n = 100). Colored points pass thresholds of median CMR |Δβadj| ≥ 0.03 and padj ≤ 0.05. Inset: the ACTC1 CMR is shown as a representative example. y axis: β value (level of DNAm) in female subjects from TERRE. Dark pink: PD cases; bright pink: controls. b Volcano plot: Adjusted PD case-control DNAm differences in males from TERRE (n = 118). Colored points pass thresholds of median CMR |Δβadj| ≥ 0.03 and padj ≤ 0.05. Inset: the ANO8/DDA1 3′UTR CMR is shown as a representative example. y axis: β value (level of DNAm) in female subjects from TERRE. Dark blue: PD cases; light blue: controls.
Fig. 5
Fig. 5. Correlation of PD-associated blood DNA methylation patterns in TERRE and other populations after propensity matching.
CMRs that passed padj ≤ 0.05 in TERRE epigenome-wide association analyses in each sex are shown (508 total in females: 155/508 covered in PEG1 and SGPD 450 K array datasets, 506/508 covered in DIGPD; 7 in males: 4/7 covered in PEG1 and SGPD, 7/7 in DIGPD). x axis: median CMR |Δβadj| in individuals from TERRE; y axis: median CMR |Δβadj| in individuals from PEG1 (matched for age, predicted smoking, and predicted neutrophil proportion), DIGPD, or SGPD (matched for age, predicted smoking, and predicted neutrophil proportion). Pearson’s correlation coefficients (r) and p values are shown. a Left to right: Δβadj correlations in females from PEG1, DIGPD, and SGPD. b Left to right: Δβadj correlations in males from PEG1, DIGPD, and SGPD.
Fig. 6
Fig. 6. Sensitivity of PD CMR DNAm to genetic and exposure variables.
CMRs that passed padj ≤ 0.05 and median CMR |Δβadj| ≥ 0.03 in TERRE epigenome-wide association analyses in females were fit to an exposure (E), genetic (G), additive (G + E), or interactive (G×E) model. a Number of CMRs with a minimum AIC corresponding to each model. b Minimum AIC value corresponding to the minimum AIC model for each CMR. c Changes in effect of PD on DNAm (Δβadj) corresponding to the minimum AIC model for each CMR, relative to the base model. Arrows show the direction of change for each PD effect, and CMRs with a PD effect that changed by ≥0.03 are labeled.

References

    1. Maserejian, N., Vinikoor-Imler, L. & Dilley, A. Estimation of the 2020 global population of Parkinson’s Disease (PD). MDS Abstracts. https://www.mdsabstracts.org/abstract/estimation-of-the-2020-global-popu... (2020).
    1. Feigin VL, et al. Global, regional, and national burden of neurological disorders during 1990-2015: a systematic analysis for the Global Burden of Disease Study 2015. Lancet Neurol. 2017;16:877–897. doi: 10.1016/S1474-4422(17)30299-5. - DOI - PMC - PubMed
    1. Villar-Piqué A, Lopes da Fonseca T, Outeiro TF. Structure, function and toxicity of alpha-synuclein: the Bermuda triangle in synucleinopathies. J. Neurochem. 2016;139:240–255. doi: 10.1111/jnc.13249. - DOI - PubMed
    1. Jensen MP, et al. Lower lymphocyte count is associated with increased risk of Parkinson’s disease. Ann. Neurol. 2021;89:803–812. doi: 10.1002/ana.26034. - DOI - PMC - PubMed
    1. Hoehn MM, Yahr MD. Parkinsonism: onset, progression, and mortality. Neurology. 1967;17:427–427. doi: 10.1212/WNL.17.5.427. - DOI - PubMed