. 2024 May 7;15(1):3835.
doi: 10.1038/s41467-024-47585-x.

Pharmacological inhibition of α-synuclein aggregation within liquid condensates

Affiliations

Pharmacological inhibition of α-synuclein aggregation within liquid condensates

Samuel T Dada et al. Nat Commun. .

Abstract

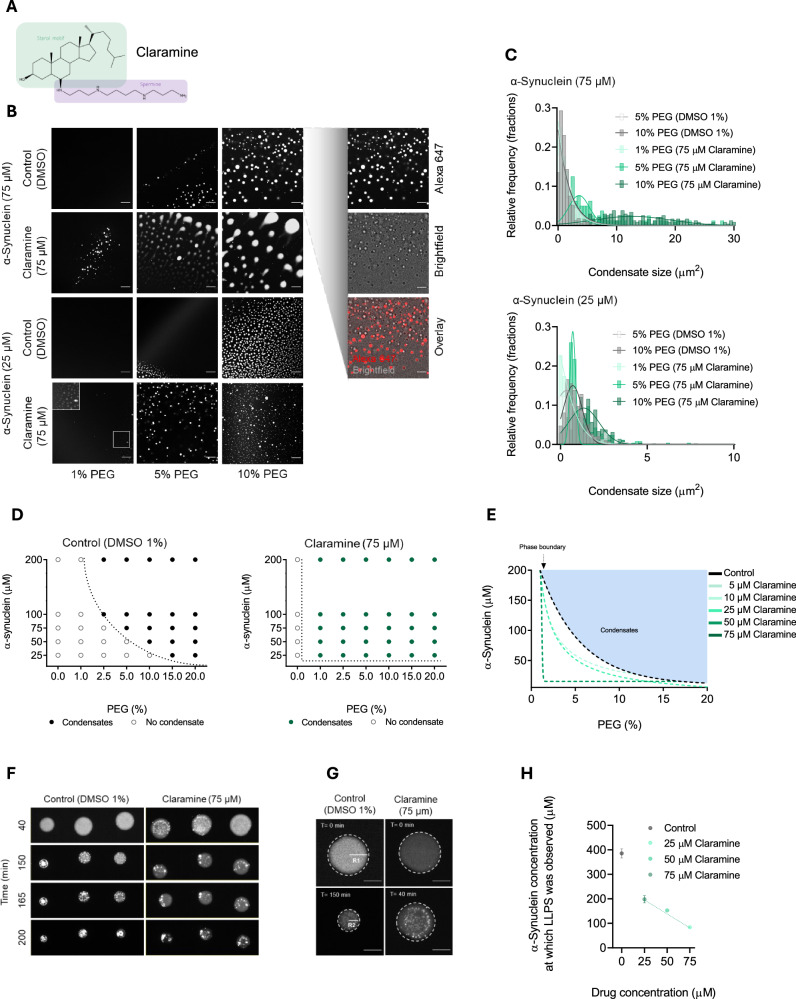
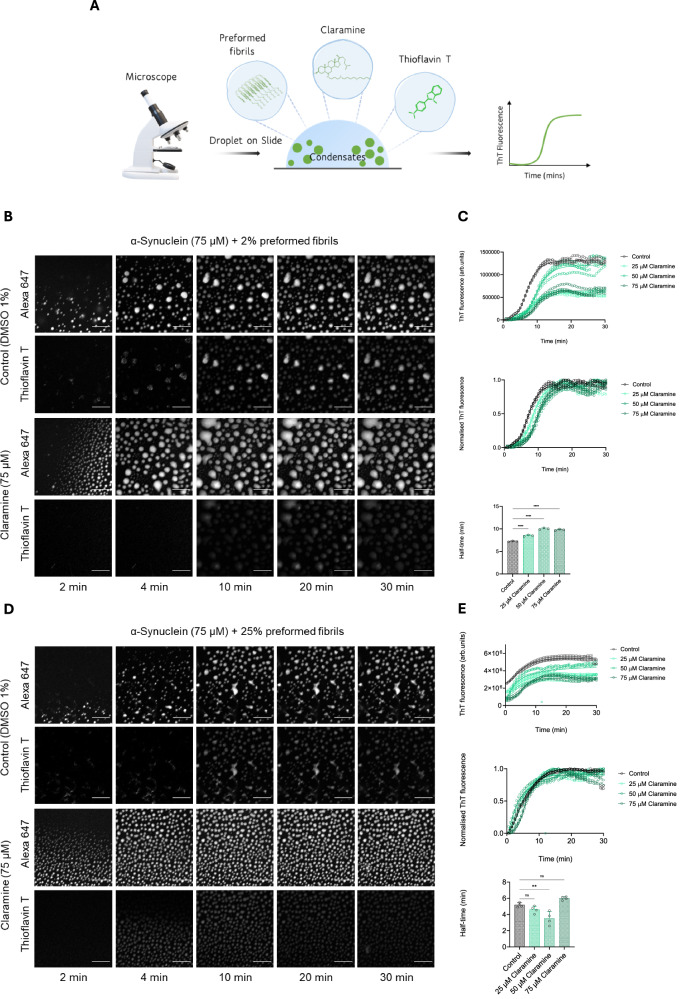
Aggregated forms of α-synuclein constitute the major component of Lewy bodies, the proteinaceous aggregates characteristic of Parkinson's disease. Emerging evidence suggests that α-synuclein aggregation may occur within liquid condensates formed through phase separation. This mechanism of aggregation creates new challenges and opportunities for drug discovery for Parkinson's disease, which is otherwise still incurable. Here we show that the condensation-driven aggregation pathway of α-synuclein can be inhibited using small molecules. We report that the aminosterol claramine stabilizes α-synuclein condensates and inhibits α-synuclein aggregation within the condensates both in vitro and in a Caenorhabditis elegans model of Parkinson's disease. By using a chemical kinetics approach, we show that the mechanism of action of claramine is to inhibit primary nucleation within the condensates. These results illustrate a possible therapeutic route based on the inhibition of protein aggregation within condensates, a phenomenon likely to be relevant in other neurodegenerative disorders.


Conflict of interest statement

The authors declare no competing interests.

Figures

Fig. 1
Fig. 1. Claramine increases the propensity of synuclein to undergo phase separation.
A Chemical structure of claramine showing the spermine side chain (purple) and the sterol group (green). B Representative fluorescence images of α-synuclein condensate formation in the presence and absence of claramine (75 µM) at different PEG concentrations. Images were obtained 10 min post incubation. The scale bar represents 5 µm. C Histogram of the size distribution and relative frequency of condensates for the images displayed in panel (B) at 5% (off-white),10% (grey) PEG in the absence of claramine, and 1% (light green), 5% (green) and 10% (dark green) PEG in the presence of claramine (75 µM). The bin width for conditions with 75 µM and 25 µM α-synuclein are 0.5 and 0.2, respectively. D Phase diagram for different PEG and α-synuclein concentrations (1% DMSO) in the absence (left graph) and presence of claramine (75 µM) (right graph) at which phase separation was observed after a 10 min incubation period. The dots indicate the tested conditions, where hollow dots indicate lack of phase separation, whilst solid dots indicate phase separation. The dotted black line represents the phase boundary. E Phase diagram for different α-synuclein and PEG concentrations with the addition of different claramine concentrations. The phase boundary for the different conditions tested are represented by the dotted lines; increasing concentrations of claramine are highlighted by the green increasing gradient colour. F Representative fluorescence images displaying condensate formation of six droplets trapped within a microfluidic chamber overtime. G Enlarged images showing droplet (1% DMSO) in the absence and presence of claramine (75 µM). The scale bar represents 50 µm. H Concentration of α-synuclein at which phase separation was observed within droplets as shown in panels F and G, in the absence (grey) and presence (green) of different concentrations of claramine, at 25 (light green), 50 (green) and 75 (dark green) µM, in 10% PEG. All experiments were performed in 50 mM Tris-HCl at pH 7.4 in the presence of 10% PEG unless otherwise stated. Data shown are representative of experiments repeated at least three times. Results are mean ± SEM.
Fig. 2
Fig. 2. Claramine slows down the aggregation of α-synuclein within condensates.
A Schematic diagram illustrating the components of the thioflavin T (ThT) based assay used to monitor aggregation within condensates. The buffer system was 50 mM Tris-HCl at pH 7.4, 10% PEG and monomeric α-synuclein labelled was labelled with Alexa Fluor 647 for visualization. B Fluorescence images showing α-synuclein condensate formation and aggregation in the absence (1% DMSO) and presence of claramine (75 µM) over time. The images represent an area of sample tracked over time; the scale bar represents 20 µm. C Quantification of ThT emission for images shown in panel (B) for 75 µM α-synuclein in the presence of 1% DMSO (control) (black), 25 µM (light green), 50 µM (green) and 75 µM (dark green) claramine over a 40 min time period. The top graph displays the ThT emission, the middle graph shows the normalised ThT emission, and the bottom graph highlights the corresponding aggregation half-times for 75 µM α-synuclein in the presence and absence of claramine. D Representative transmission electron microscopy (TEM) images of preformed α-synuclein fibrils (75 µM), and of α-synuclein fibrils (75 µM) post phase separation (>40 min) in the absence (1% DMSO) and presence of claramine (75 µM). The scale bar represents 200 nm (upper panel) and 500 nm (lower panel), respectively. E Fourier-transform infrared (FTIR) spectra of recovered products from the α-synuclein (75 µM) phase separation assay displaying the amide I and amide II regions in the absence (1% DMSO) (black) and presence of claramine (75 µM) (dark green). F Second derivative FTIR spectra of deconvoluted amide I region from panel (E) showing the band frequency assignments assigned to structures post phase separation of α-synuclein (75 μM) in the absence (1% DMSO) (black) and presence of claramine (75 µM) (dark green). All experiments were performed using 75 µM α-synuclein in 50 mM Tris-HCl at pH 7.4 in the presence of 10% PEG unless otherwise stated. The data represent the mean ± SEM of n = 4 individual experiments. A one-way ANOVA test with Dunnett’s multiple comparisons correction was used in panel (C) (****P < 0.0001).
Fig. 3
Fig. 3. Claramine mildly affects the aggregation of α-synuclein within condensates in the presence of preformed fibril seeds.
A Schematic diagram illustrating the components of the ThT based assay used to monitor aggregation within liquid condensates. The components of this assay mimics that of the assay described in Fig. 2A with the addition of 2% or 25% preformed fibrils. BE Representative fluorescence imaging displaying α-synuclein condensate formation and aggregation with 2% preformed fibrils (B) and 25% preformed fibrils (D), in the absence (1% DMSO) and presence of claramine (75 µM) over time. The images represent an area of sample tracked over time; the scale bar represents 20 µm. ThT emission quantification of the 2% and 25% seeded assay images shown in panels (B) and (D) respectively, for 75 µM α-synuclein in the presence of 1% DMSO (control) (black), 25 µM (light green), 50 µM (green) and 75 µM (dark green) claramine over a 30 min time period. The top graph on both (C) and (E) displays the raw ThT values, the middle graphs show the normalised kinetic profile of the aggregation assay, and the bottom graphs shows the corresponding half-times of aggregation for 75 µM α-synuclein in the presence and absence of claramine. All experiments were performed using 75 µM α-synuclein with either 2% or 25% preformed fibrils in 50 mM Tris-HCl at pH 7.4 in the presence of 10% PEG unless otherwise stated. The data represent the mean ± SEM of n = 4 individual experiments. A one-way ANOVA test with Dunnett’s multiple comparisons correction was used in (C) and (E) (n.s –not significant, **P < 0.01, ***P < 0.001, ****P < 0.0001).
Fig. 4
Fig. 4. Claramine reduces the formation and maturation of α-synuclein inclusions, as well as muscle paralysis in a C. elegans model of PD.
A Representative images showing the effects of claramine (5 µM) in both the YFP control strain and the α-synuclein-YFP PD mutant strain. The top panel shows that 1% DMSO or 5 µM claramine did not have significant effects on the on the YFP expression of the YFP control strain on day 7 of adulthood. The bottom panel shows the progression of the inclusion assembly in the body wall muscle cells over time (1% DMSO) between days 4 and 15 of adulthood in the absence and presence of claramine (5 µM). The scale bar represents 20 µm. B Quantification of images shown in panel A (bottom) of α-synuclein-YFP inclusions in PD worms at indicated time points (1% DMSO) in the absence (grey) and presence of 5 µM claramine (green). At least six worms were analysed in total. C Data from an automated worm motility assay showing the relative fold change in average bends per minute of worms treated with 5 µM claramine over time between days 4 and 15 of adulthood. At least 50 worms were analysed in total per experiment (n = 3). D FRAP images of α-synuclein-YFP inclusions on day 15 of adulthood. Images on the left of the panel corresponds to representative worm administered DMSO (1%) whilst the panel on the right corresponds to worm administered 5 µM claramine. The images correspond to the region of interest with pre-bleach and post-bleach droplets at 1, 5, 10 and 20 s for each tested condition. The scale bar represents 20 µm and 5 µm for the top and bottom images respectively. E Normalised recovery traces from FRAP experiment for α-synuclein-YFP inclusions treated with DMSO (1%) (black) and 5 µM claramine (green) on day 4 and day 15 of adulthood, at least 4 worms were analysed in total per condition. The data represent the mean ± SEM. A two-way ANOVA test with Sidak’s multiple comparisons correction was used in B (n.s –not significant, *P < 0.1, **P < 0.01).

References

    1. Spillantini MG, et al. α-synuclein in Lewy bodies. Nature. 1997;388:839–840. doi: 10.1038/42166. - DOI - PubMed
    1. Poewe W, et al. Parkinson disease. Nat. Rev. Dis. Prim. 2017;3:1–21. - PubMed
    1. McFarthing, K. et al. Parkinson’s disease drug therapies in the clinical trial pipeline: 2022 update. J. Parkinsons Dis. 13, 427–439 (2023). - PMC - PubMed
    1. Conway KA, Harper JD, Lansbury PT. Accelerated in vitro fibril formation by a mutant α-synuclein linked to early-onset parkinson disease. Nat. Med. 1998;4:1318–1320. doi: 10.1038/3311. - DOI - PubMed
    1. Buell AK, et al. Solution conditions determine the relative importance of nucleation and growth processes in α-synuclein aggregation. Proc. Natl Acad. Sci. USA. 2014;111:7671–7676. doi: 10.1073/pnas.1315346111. - DOI - PMC - PubMed

Publication types

MeSH terms