. 2024 May 7;15(1):3829.
doi: 10.1038/s41467-024-48049-y.

Effects of management practices on the ecosystem-service multifunctionality of temperate grasslands

Affiliations

Effects of management practices on the ecosystem-service multifunctionality of temperate grasslands

Franziska J Richter et al. Nat Commun. .

Abstract

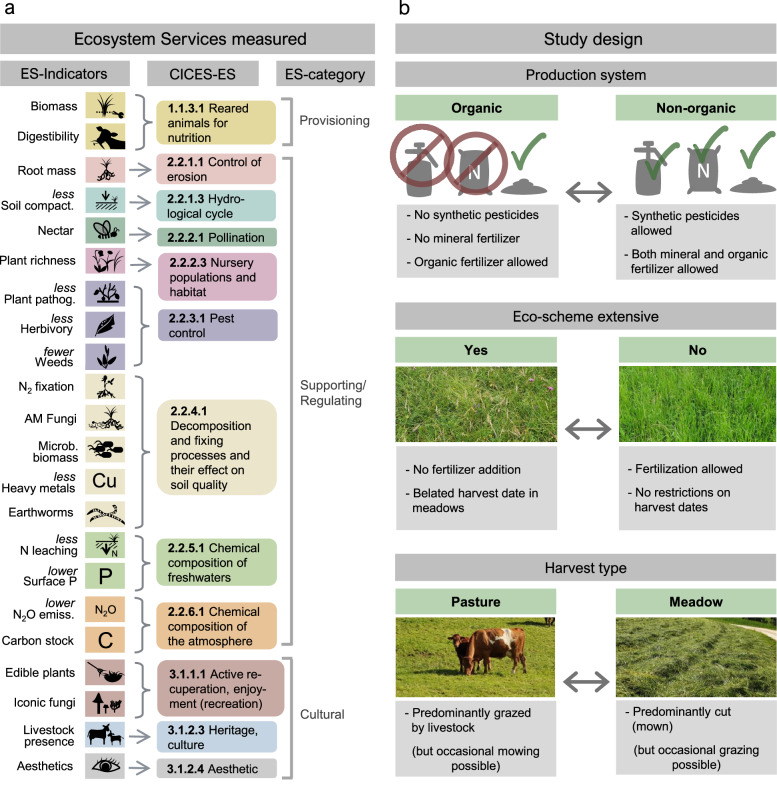
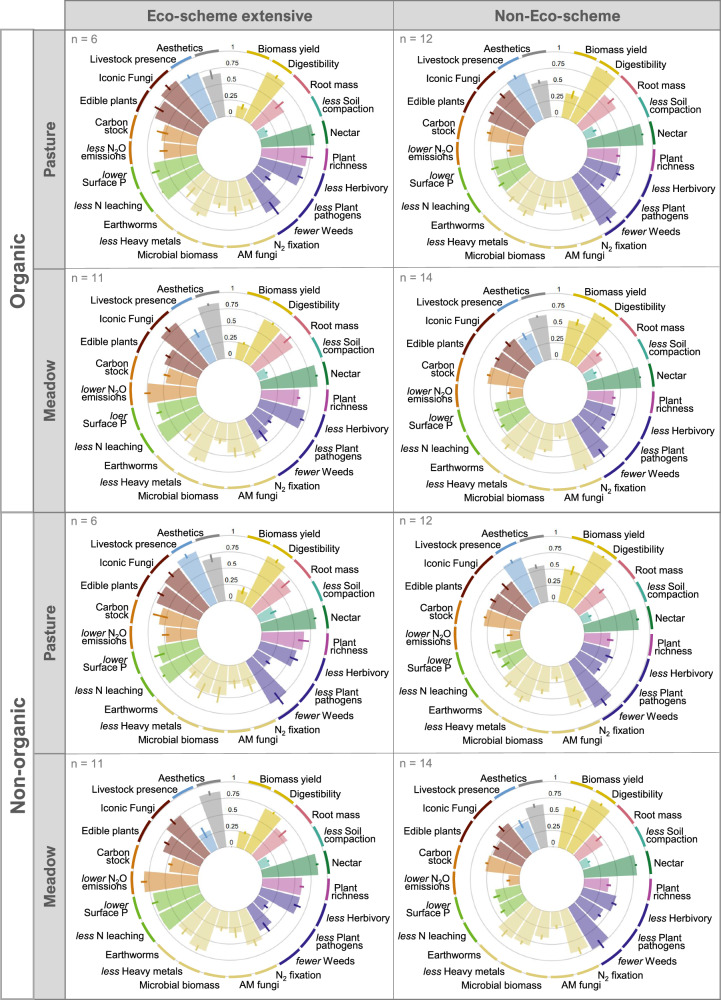
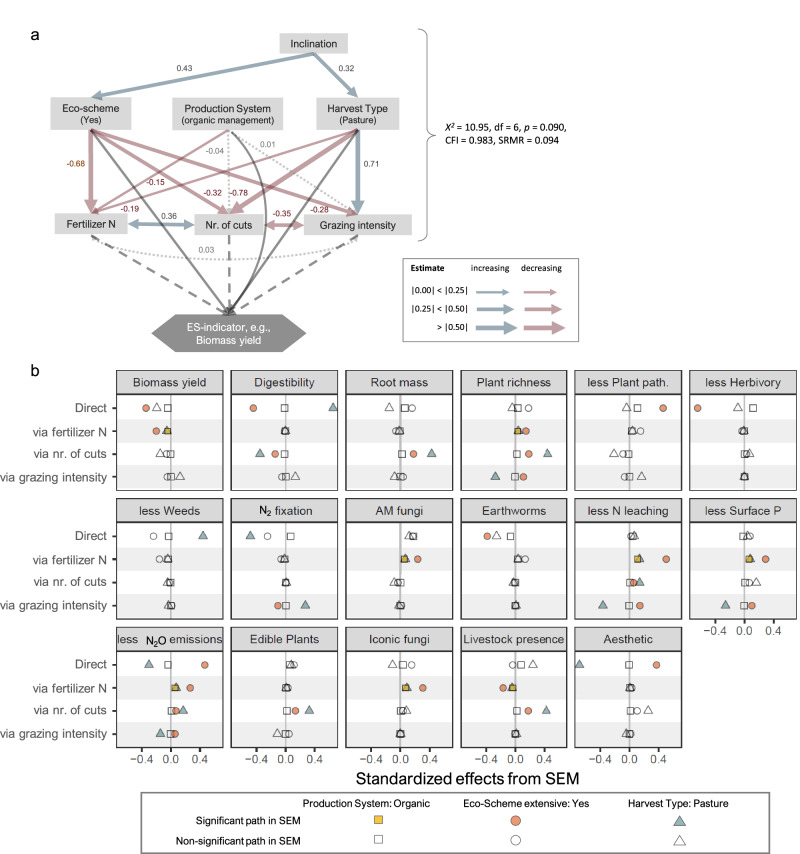
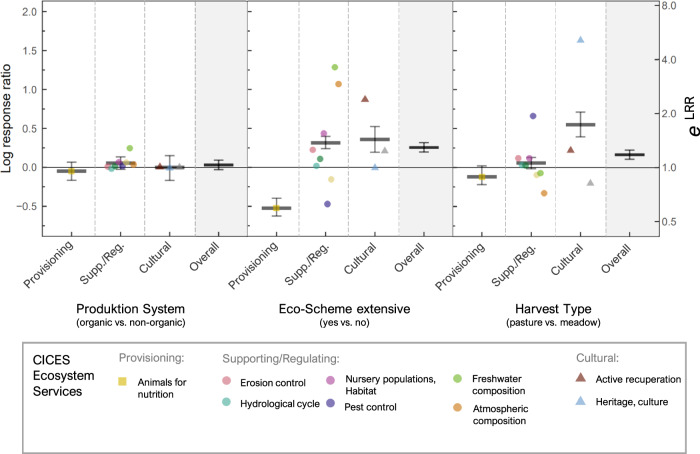
Human wellbeing depends on ecosystem services, highlighting the need for improving the ecosystem-service multifunctionality of food and feed production systems. We study Swiss agricultural grasslands to assess how employing and combining three widespread aspects of grassland management and their interactions can enhance 22 plot-level ecosystem service indicators, as well as ecosystem-service multifunctionality. The three management aspects we assess are i) organic production system, ii) an eco-scheme prescribing extensive management (without fertilization), and iii) harvest type (pasture vs. meadow). While organic production system and interactions between the three management aspects play a minor role, the main effects of eco-scheme and harvest type considerably shape single services. Moreover, the eco-scheme 'extensive management' and the harvest type 'pasture' enhance plot-scale ecosystem-service multifunctionality, mostly through facilitating cultural services at the expense of provisioning services. These changes in ecosystem-service supply occur mainly via changes in land-use intensity, i.e., reduced fertilizer input and harvest frequency. In conclusion, diversifying grassland management where this is currently homogeneous across farms and landscapes depicts an important first step to improve landscape-scale multifunctionality for sustainable grassland systems. To meet societal ecosystem services demand, the three studied management aspects can be systematically combined to increase ecosystem services that are in short supply.


Conflict of interest statement

The authors declare no competing interests.

Figures

Fig. 1
Fig. 1. Overview of measured ecosystem-service indicators (ES-indicators) and study design.
a From left to right: indicators grouped according to the corresponding ecosystem service defined by CICES and corresponding ecosystem-service category. b From top to bottom: brief definition of the three management aspects studied: Production system, Eco-scheme, and Harvest type. All 22 ecosystem-service indicators were measured for the eight possible combinations of Production system, Eco-scheme, and Harvest type. Total number of study plots was 86 (see Supplementary Table S1 for number of plots per combination of management aspects).
Fig. 2
Fig. 2. Ecosystem-service indicators in response to three grassland management aspects studied.
Bars denote the mean value (with standard error) for each indicator and the combination of management aspects (Production system: organic vs. non-organic; Eco-scheme extensive management: yes vs. no; Harvest type: pasture vs. meadow). Values are maximum-scaled per indicator (over the whole dataset) and reversed for disservices; colors correspond to the ecosystem services according to CICES (see Fig. 1). Replicate numbers (grasslands) are given in the top left corner of the respective barplot. See Fig. 3 for statistical tests on management effects on all indicators. Source data are provided as a Source Data file.
Fig. 3
Fig. 3. Effects of grassland management on ecosystem-service indicators (ES-indicators) according to a generalized linear latent variable model.
Significant effects are shown in black (P < 0.05). Regression estimates (points) and 95% confidence intervals (bars) derived from testing the main effects of Production system (a), Eco-scheme (b), and Harvest type (c) on the 22 max-scaled ecosystem-service indicators. Color coding of icons for ecosystem-service indicators corresponds to the respective ecosystem service according to CICES (see Fig. 1). Ecosystem-service indicators in italics have been reversed to show services instead of disservices. This model included three environmental variables, soil pH, sand content, and elevation, the coefficient plots of which can be found in Supplementary Fig. S2. N = 86 grasslands. Source data are provided as a Source Data file.
Fig. 4
Fig. 4. Structural equation models (SEMs) identifying direct and indirect effects of management aspects on ecosystem-service indicators (ES-indicators).
Indirect effects of the Production system, Eco-scheme, and Harvest type act via fertilizer N (fertilization intensity), number of cuts (cutting frequency), and grazing intensity (livestock units × grazing days) on the max-scaled ecosystem-service indicators. Tested only for the 17 ecosystem-service indicators significantly influenced by at least one of the three management aspects (via GLLVM see Fig. 3). a This basic SEM model was used for every ecosystem-service indicator, with red arrows denoting decreasing, blue-gray arrows increasing effects, and light gray dotted arrows insignificant effects (P > 0.05). χ2 statistic, comparative fit index (CFI) and standardized root mean-squared residual (SRMR) of the basic model are given. Dark gray solid arrows in the lower part of the SEM show direct and dashed arrows indirect effects on the ecosystem-service indicators via fertilizer N, number of cuts, and grazing intensity. These direct and indirect effects are shown in (b) with filled symbols, indicating the size of direct and indirect effects from a significant path, and non-filled symbols from insignificant paths. Besides inclination, elevation was also included in the initial SEM but was removed because it did neither significantly affect the three management aspects nor the three measures of management intensity. See appendix for full SEMs and fit indices (Supplementary Fig. S5). Units for the management intensity variables are fertilizer N: plant-available N in kg ha−1 year−1, number of cuts: cuts year−1, and grazing intensity: livestock unit days ha−1 year−1. N = 86 grasslands. Source data are provided as a Source Data file.
Fig. 5
Fig. 5. Effects of grassland management on the multifunctionality of 12 ecosystem services, derived by aggregating log response ratios (LRRs, black horizontal bars) of 22 ecosystem-service indicators following CICES (Fig. 1).
Effects were separated into overall multifunctionality (displayed in the shaded areas) and multifunctionality of each of the three ecosystem-service categories, i.e., provisioning, supporting/regulating, and cultural. LRRs of the 12 single ecosystem services according to CICES shown as colored symbols. Error bars represent 95% confidence intervals based on bootstrapping. Colors of the points correspond to the respective indicators used for one distinct ecosystem service, and the shapes of the points correspond to the ecosystem-service category (Fig. 1). N = 86 grasslands. Source data are provided as a Source Data file.

References

    1. Pe’er G, et al. A greener path for the EU Common Agricultural Policy. Science. 2019;365:449–451. doi: 10.1126/science.aax3146. - DOI - PubMed
    1. Swinton SM, Lupi F, Robertson GP, Hamilton SK. Ecosystem services and agriculture: cultivating agricultural ecosystems for diverse benefits. Ecol. Econ. 2007;64:245–252. doi: 10.1016/j.ecolecon.2007.09.020. - DOI
    1. Pe’er G, et al. EU agricultural reform fails on biodiversity. Science. 2014;344:1090–1092. doi: 10.1126/science.1253425. - DOI - PubMed
    1. White, R. P., Murray, S. & Rohweder, M. Pilot Analysis of Global Ecosystems—Grassland Ecosystems (World Resources Institute, Washington D.C., 2000).
    1. Roser, M., Ritchie, H. & Rosado, P. Food supply. OurWorldInData.org. Retrieved from: https://ourworldindata.org/food-supply (2013).

Publication types