. 2024 May 7;15(1):3800.
doi: 10.1038/s41467-024-48190-8.

Determinants of mosaic chromosomal alteration fitness

Affiliations

Determinants of mosaic chromosomal alteration fitness

Yash Pershad et al. Nat Commun. .

Abstract

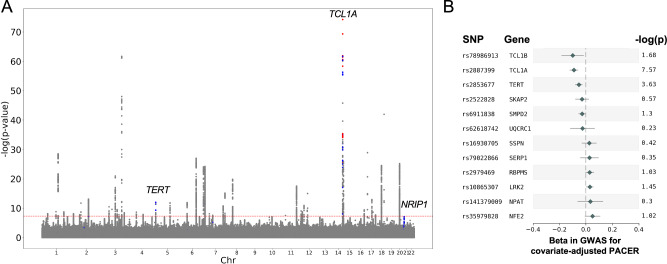
Clonal hematopoiesis (CH) is characterized by the acquisition of a somatic mutation in a hematopoietic stem cell that results in a clonal expansion. These driver mutations can be single nucleotide variants in cancer driver genes or larger structural rearrangements called mosaic chromosomal alterations (mCAs). The factors that influence the variations in mCA fitness and ultimately result in different clonal expansion rates are not well understood. We used the Passenger-Approximated Clonal Expansion Rate (PACER) method to estimate clonal expansion rate as PACER scores for 6,381 individuals in the NHLBI TOPMed cohort with gain, loss, and copy-neutral loss of heterozygosity mCAs. Our mCA fitness estimates, derived by aggregating per-individual PACER scores, were correlated (R2 = 0.49) with an alternative approach that estimated fitness of mCAs in the UK Biobank using population-level distributions of clonal fraction. Among individuals with JAK2 V617F clonal hematopoiesis of indeterminate potential or mCAs affecting the JAK2 gene on chromosome 9, PACER score was strongly correlated with erythrocyte count. In a cross-sectional analysis, genome-wide association study of estimates of mCA expansion rate identified a TCL1A locus variant associated with mCA clonal expansion rate, with suggestive variants in NRIP1 and TERT.


Conflict of interest statement

A.G.B. and S.J. are cofounders, equity holders, and on the scientific advisory board of TenSixteen Bio. M.H.C. has received grant support from Bayer. B.M.P. serves on the Steering Committee of the Yale Open Data Access Project funded by Johnson & Johnson. Stanford University has filed a patent application for the use of PACER to identify therapeutic targets on which S.J., A.G.B. and J.S.W. are inventors (US patent 63/141,333). The patent has been licensed to TenSixteen Bio. L.M.R. is a consultant for the NHLBI TOPMed Administrative Coordinating Center (through Westat). S.S. Rich is a consultant to Westat for NHLBI TOPMed. In the past three years, E.K.S. received grant support from Bayer and Northpond Laboratories. All other authors declare that they have no competing interests.

Figures

Fig. 1
Fig. 1. Schematic of the study and mosaic chromosomal alterations in TOPMed.
A Excluding mosaic chromosomal alterations (mCAs) of chromosome X, 3068 individuals had 3,828 mCAs in TOPMed. 6,930 individuals had 1 mCA, and 763 had > 1 mCA. Created with BioRender.com released under a Creative Commons Attribution-NonCommercial-NoDerivs 4.0 International license. B Stacked bar plot showing counts of mCAs by chromosome, separated by copy change type: copy neutral loss of heterozygosity (CN-LOH) in yellow, gain in red, and loss in blue. mCAs of chromosome X were excluded. C Dot plot of clonal fractions for each patient with specific mCA (chromosome and copy change). Red and + represents gain of chromosome, blue and - represents loss of chromosome, and yellow and = represents CN-LOH.
Fig. 2
Fig. 2. Total passenger mutations and PACER score of mCAs.
A Histogram of total passenger mutations for all individuals with 1 mosaic chromosomal abnormality in TOPMed. A passenger mutation is defined as a clocklike C > T or T > C substitution that does not occur in a CHIP-associated gene. B Dot plot of fold change in clonal expansion rate compared to loss of chromosome X (X-). Red dots represent a gain of chromosome, blue dots represent a loss of chromosome, and yellow dots represent CN-LOH. The PACER scores are calculated after covariate adjustment (age, sex, study cohort, and clonal fraction) and inverse normalization of the total passenger mutations for all individuals with a single mCA. The median of the PACER scores is computed for individuals with the same mCA type and location to estimate mCA fitness. The fold change in estimated mCA fitness is calculated by dividing the clonal expansion rate for a given mCA by that for a loss of chromosome X. The size of the dot corresponds to the number of individuals with that mCA type. The orange line represents the fold change of clonal expansion rate of the CHIP mutation DNMT3A with respect to X. C Scatter plot of PACER-estimated mCA fitness and fitness derived from clonal fraction by mCA by Watson and Blundell 2023 (CF-derived fitness) for mCAs with >25 individuals with a given mCA type. The size of the dot corresponds to the number of individuals with that mCA type. A generalized linear model of PACER score, mean age, and mean clonal fraction predicting CF-derived fitness had an R2 value of 0.49. The translucent bands around the linear regression line represents a bootstrap-estimated 95% confidence interval.
Fig. 3
Fig. 3. Correlation of PACER score and peripheral erythrocyte counts.
Scatterplot of erythrocyte counts (1012 cells/L) versus covariate-adjusted passenger associated clonal expansion rate (PACER) score for A patients with copy-neutral loss of heterozygosity or loss of the p arm of chromosome 9 and B patients with JAK2 V617F clonal hematopoiesis of indeterminate potential. The translucent bands around the linear regression line represents a bootstrap-estimated 95% confidence interval.
Fig. 4
Fig. 4. Genome-wide association study of PACER score.
A Manhattan plot from the genome-wide association study (GWAS) for passenger-approximated clonal expansion rate (PACER) for single nucleotide polymorphisms (SNPs) with a minor allele frequency > 1%. A linear mixed model with kinship adjustment was used to regress inverse normally transformed total passenger mutations, with age, sex, clonal fraction, study, and the first 10 ancestral principal components included in the model as covariates. The dashed red line represents 5 × 10−8, our Bonferroni multiple-hypothesis correction p-value threshold for significance. Nearest gene is labeled. SNPs within TCL1A had a p-value of 3.1 × 10−8, those within CSMD1 had a p-value of 1.4 × 10−7, and those within SORCS3 had a p-value of 4.6 × 10−7. B Forest plot of change in PACER score per rs1122138 allele count and p-value for in a multiple regression model of age at blood draw, sex, and clonal fraction to predict PACER, with number of individuals with that mCA labeled as N. Data are presented as mean values ± 1.96*SE.
Fig. 5
Fig. 5. Replication of genome-wide association study of PACER score with prior expanded clone genome-wide association study.
A Manhattan plot from the GWAS in Zekavat et al. for expanded clonal size (defined as clonal fraction > 10%) among N = 444,199 individuals in the UK Biobank, of which N = 66,011 carried an mCA and N = 12,398 individuals carried an expanded clone. The GWAS in Zekavat et al was performed with a Wald logistic regression model with covariate-adjustment for age, age, sex, ever smoking, principal components 1–10, and genotyping array. Red points represent SNPs in the expanded clonal size GWAS with a p-value < 10−6 in the GWAS for passenger-approximated clonal expansion rate, and blue points represent SNPs in the expanded clonal size GWAS with a p-value < 10−3 and > 10−6 in the GWAS for passenger-approximated clonal expansion rate. These included SNPs in the genes TCL1A (chr14), TERT and NRIP1 (chr21). B Forest plot of the most significant SNPs in the GWAS for expanded clonal size demonstrating their coefficients and -log(p-value) in the GWAS of passenger-approximated clonal expansion rate. The effect estimates were derived from a linear mixed model with kinship adjustment regressing inverse normally transformed total passenger mutations, with age, sex, clonal fraction, study, and the first 10 ancestral principal components included in the model as covariates. Genes annotated based on OpenTargets variant annotations. SNPs with beta <0.025 not shown. Data are presented as mean values±1.96*SE.

Update of

  • Determinants of mosaic chromosomal alteration fitness.
    Pershad Y, Mack T, Poisner H, Jakubek YA, Stilp AM, Mitchell BD, Lewis JP, Boerwinkle E, Loos RJ, Chami N, Wang Z, Barnes K, Pankratz N, Fornage M, Redline S, Psaty BM, Bis JC, Shojaie A, Silverman EK, Cho MH, Yun J, DeMeo D, Levy D, Johnson A, Mathias R, Taub M, Arnett D, North K, Raffield LM, Carson A, Doyle MF, Rich SS, Rotter JI, Guo X, Cox N, Roden DM, Franceschini N, Desai P, Reiner A, Auer PL, Scheet P, Jaiswal S, Weinstock JS, Bick AG. Pershad Y, et al. medRxiv [Preprint]. 2023 Oct 21:2023.10.20.23297280. doi: 10.1101/2023.10.20.23297280. medRxiv. 2023. Update in: Nat Commun. 2024 May 7;15(1):3800. doi: 10.1038/s41467-024-48190-8. PMID: 37905118 Free PMC article. Updated. Preprint.

References

    1. Beerman I. Accumulation of DNA damage in the aged hematopoietic stem cell compartment. Semin. Hematol. 2017;54:12–18. doi: 10.1053/j.seminhematol.2016.11.001. - DOI - PMC - PubMed
    1. Jaiswal S, Ebert BL. Clonal hematopoiesis in human aging and disease. Science. 2019;366:eaan4673. doi: 10.1126/science.aan4673. - DOI - PMC - PubMed
    1. Bick AG, et al. Inherited causes of clonal haematopoiesis in 97,691 whole genomes. Nature. 2020;586:763–768. doi: 10.1038/s41586-020-2819-2. - DOI - PMC - PubMed
    1. Terao C, et al. Chromosomal alterations among age-related haematopoietic clones in Japan. Nature. 2020;584:130–135. doi: 10.1038/s41586-020-2426-2. - DOI - PMC - PubMed
    1. Loh P-R, et al. Insights into clonal haematopoiesis from 8,342 mosaic chromosomal alterations. Nature. 2018;559:350–355. doi: 10.1038/s41586-018-0321-x. - DOI - PMC - PubMed

Publication types