. 2024 May 8;9(1):109.
doi: 10.1038/s41392-024-01819-y.

A pathological joint-liver axis mediated by matrikine-activated CD4+ T cells

Affiliations

A pathological joint-liver axis mediated by matrikine-activated CD4+ T cells

Junzhi Yi et al. Signal Transduct Target Ther. .

Abstract

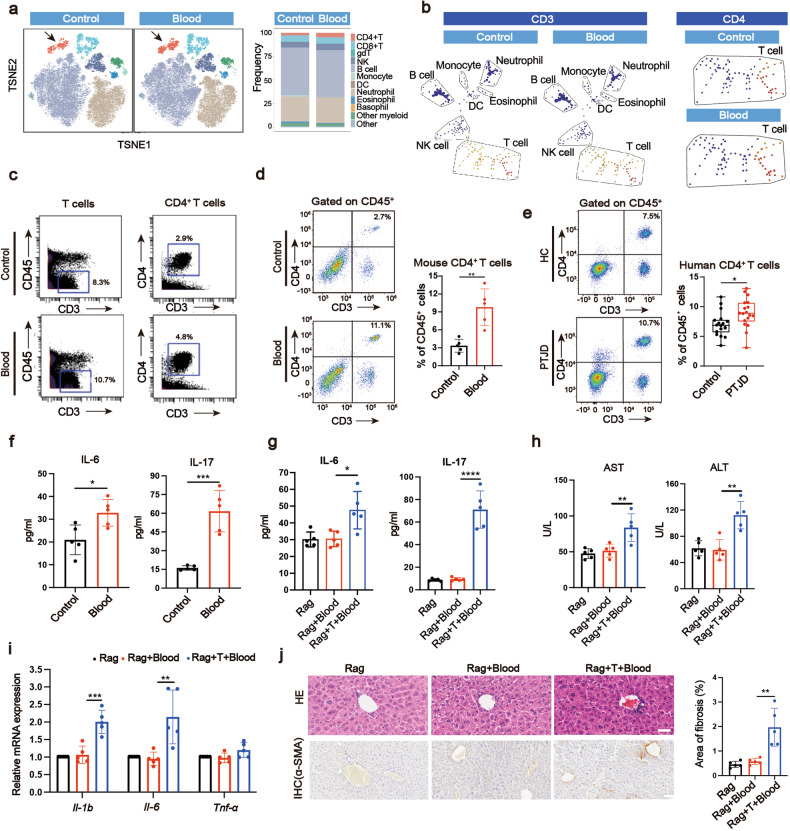
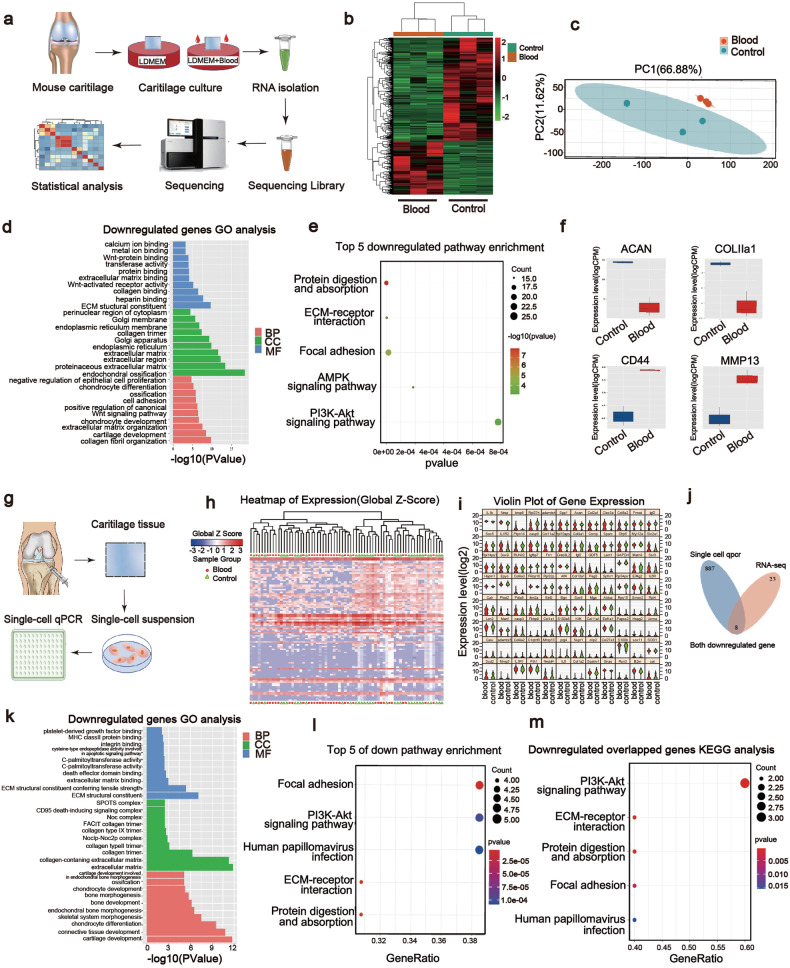
The knee joint has long been considered a closed system. The pathological effects of joint diseases on distant organs have not been investigated. Herein, our clinical data showed that post-traumatic joint damage, combined with joint bleeding (hemarthrosis), exhibits a worse liver function compared with healthy control. With mouse model, hemarthrosis induces both cartilage degeneration and remote liver damage. Next, we found that hemarthrosis induces the upregulation in ratio and differentiation towards Th17 cells of CD4+ T cells in peripheral blood and spleen. Deletion of CD4+ T cells reverses hemarthrosis-induced liver damage. Degeneration of cartilage matrix induced by hemarthrosis upregulates serological type II collagen (COL II), which activates CD4+ T cells. Systemic application of a COL II antibody blocks the activation. Furthermore, bulk RNAseq and single-cell qPCR analysis revealed that the cartilage Akt pathway is inhibited by blood treatment. Intra-articular application of Akt activator blocks the cartilage degeneration and thus protects against the liver impairment in mouse and pig models. Taken together, our study revealed a pathological joint-liver axis mediated by matrikine-activated CD4+ T cells, which refreshes the organ-crosstalk axis and provides a new treatment target for hemarthrosis-related disease. Intra-articular bleeding induces cartilage degradation through down-reulation of cartilage Akt pathway. During this process, the soluble COL II released from the damaged cartilage can activate peripheral CD4+ T cells, differention into Th17 cells and secretion of IL-17, which consequently induces liver impairment. Intra-articular application of sc79 (inhibitor of Akt pathway) can prevent the cartilage damage as well as its peripheral influences.


Conflict of interest statement

The authors declare no competing interests.

Figures

None
Intra-articular bleeding induces cartilage degradation through down-reulation of cartilage Akt pathway. During this process, the soluble COL II released from the damaged cartilage can activate peripheral CD4+ T cells, differention into Th17 cells and secretion of IL-17, which consequently induces liver impairment. Intra-articular application of sc79 (inhibitor of Akt pathway) can prevent the cartilage damage as well as its peripheral influences.
Fig. 1
Fig. 1
Post-traumatic joint damage (PTJD) patients show worse liver function. The serological markers of liver function, including a ALT (n = 102–109), b AST (n = 101–108), c ALP (n = 87–99), d GGT (n = 84–98), e TBIL (n = 101–109), f IBIL (n = 101–109), g TP (n = 102–109), h ALB (n = 102–109), i GLB (n = 102–109), and j A/G (n = 102–109) were showed by both pie charts for the ratios of normal values and bar plots for the absolute values. *P < 0.05, **P < 0.01, ***P < 0.001, ****P < 0.0001
Fig. 2
Fig. 2
A hemarthrosis mice model reveals both local cartilage and remote liver damage. a The experimental procedure for blood treatment in vivo. Mice were intra-articular injected with blood every week for four times. b SO staining of knee joints (scale bar, 100 µm). c Quantification of the SO staining with OARSI score (n = 5). d, e Immunofluorescence analysis of ACAN (green) and COL II (red) of articular cartilage treated with blood (scale bar, 65 µm) and the quantitation (n = 5). f After the IA blood treatment, calcification of meniscus and synovium were assayed by corresponding bone volume (BV) (scale bar, 800 µm) (n = 5). g SO staining of the collected synovium and corresponding Synovitis score (scale bar, 120 µm) (n = 5). h Hyperalgesia was assayed by Von Frey Test (n = 5). i IHC analysis on α-SMA of the collected liver (scale bar, 50 µm) and the fibrosis areas were quantified (n = 5). j HE staining of the collected liver (scale bar, 40 µm) (n = 5). k The liver mRNA expression of Il-1b, Il-6, and Tnf-α measured by qPCR (n = 5). l Serum biochemical analysis of AST and ALT (n = 5). m Heatmap of liver tissue from RNA-seq data (n = 3). n Kyoto Encyclopedia of Genes Genomes (KEGG) pathway analysis from upregulated genes of blood-treated liver tissue (n = 3). o Gene Set Enrichment Analysis (GSEA) of upregulated pathways in Blood group (n = 3). *P < 0.05, **P < 0.01, ***P < 0.001, ****P < 0.0001
Fig. 3
Fig. 3
CD4+ T cells mediate the cartilage-liver crosstalk. a TSNE analysis of CD45+ PBMCs from CyTOF data and its corresponding quantification. The arrows point out CD4+ T cells. b, c SPADE analysis of total cells highlighting relative location and content of CD3+ cells in them (left panel) and T cells highlighting CD4+ cells in them (right panel) and c corresponding quantification. d, e Flow cytometric measurement of the percentages of CD4+ T cells in mice and human (n = 5 for mice, n = 18 for human). f ELISA analysis of serum IL-6 and IL-17 protein levels in wild type mice of Blood and Control groups (n = 5). g ELISA analysis of serum IL-6 and IL-17 levels in Rag1−/− mice (n = 5). h Serum biochemical analysis of AST and ALT (n = 5). i The liver mRNA expression of Il-1b, Il-6, and Tnf-α measured by qPCR (n = 5). j HE staining (scale bar, 40 µm), IHC analysis (scale bar, 50 µm) of α-SMA protein and corresponding quantification of fibrosis areas in collected liver (n = 5). In CyTOF analysis, 136389 CD45+ cells from four donor mice in Control group and 147281 CD45+ cells from four donor mice in Blood group were measured. *P < 0.05, **P < 0.01, ***P < 0.001
Fig. 4
Fig. 4
Cartilage-derived sCOL II mediates the systemic activation of CD4 + T cells. a The group information for sCOL II detection in vitro. b sCOL II level in the supernatant of treated human and mice cartilage explants by ELISA assay (n = 5). c ELISA analysis of serological COL II level after 1, 3, 6, 24 hours of the 4-time blood treatment (n = 3). d ELISA analysis of serological COL II level after 1, 3, 5 days of the 4-time blood treatment (n = 3). e Flow cytometric measurement of the percentages of CD4+ T cells in peripheral blood (n = 6). f The shock times in a 10-minute treadmill running assay (n = 6). g ELISA analysis of serological IL-6 and IL-17 protein level (n = 6). h Serum biochemical analysis of AST and ALT (n = 6). i ELISA analysis of IL-17 protein level of cultural supernatant in “Mixed” group (mixed splenocytes) or “Only” group (only CD4+ T cells) (n = 5). j FACS analysis for Th17 and Treg cells in vitro and the corresponding quantitation (n = 5). *P < 0.05, **P < 0.01, ***P < 0.001
Fig. 5
Fig. 5
Transcriptomic analysis reveals the downregulation of cartilage Akt signaling pathway by blood. a The procedure of RNA-Seq analysis of mice cartilage explants. b Heatmap of the RNA-seq data (n = 3). c Principal component analysis (PCA) of the RNA-seq data (n = 3). d GO (Gene Ontology) analysis for biological pathway (BP), cellular components (CC) and molecular function (MF) of downregulated genes in Blood group from RNA-Seq data (n = 3). e KEGG pathway analysis of downregulated pathways in Blood group from RNA-seq data (n = 3). f Representative chondrogenic markers (Acan, Col IIa1, and Cd44) and destructive marker (Mmp13) expression from RNA-seq data (n = 3). g The procedure of single-cell qPCR of mice cartilage explants. h Heatmap showing the hierarchical clustering (HC) analysis including all the cells in single-cell qPCR. The orders of relative genes from top to bottom are the same as Supplementary Table 5. i Violin plot showing the expression of each single gene in single-cell qPCR data. j The overlapping of downregulated genes of Blood group from both RNA-seq and single-cell qPCR data. k GO analysis of downregulated genes in Blood group from single-cell qPCR data. l KEGG pathway analysis of downregulated genes in Blood group from single-cell qPCR data. m KEGG pathway analysis of overlapped downregulated genes in Blood group. In single-cell qPCR analysis, 36 blood-treated cells and 34 control cells were measured
Fig. 6
Fig. 6
Akt activator rescues cartilage degradation. a The experimental procedure for re-activating Akt in vitro. b Western blot analysis of p-Akt expression and quantification normalized by Tubulin (n = 3). c, d Immunofluorescence analysis of ACAN (green), COL II (red), C-caspase-3 (green) in the chondrocytes (scale bar, 100 µm). e ROS (FITC) level analysis with or without VitminE (VitE) scavenge. f Western blot analysis of p-Akt expression and quantification normalized by Tubulin on chondrocytes (n = 3). g The chondrocyte mRNA expression of Acan and Col II in each group was measured by qPCR (n = 4). h, i The quantitation of ACAN, COL II, C-caspase-3 protein level from (c, d), respectively (n = 4). j Chondrocyte viability by CCK-8 assay (n = 4). k The experimental procedure for re-activating Akt in vivo. l SO staining (scale bar, 100 µm) and corresponding OARSI quantification (n = 7). m, n Immunofluorescence analysis of ACAN (green) and COL II (red) in the collected knee joints treated with blood (scale bar, 65 µm) and the respective quantitation (n = 7). o The experimental procedure for sCOL II detection in vitro. In total, 5 μg/ml sc79 was added into the medium. p sCOL II level in the supernatant of treated human and mice cartilage explants by ELISA assay (n = 5). q Serum COL II level of mice in vivo (n = 5). *P < 0.05, **P < 0.01, ***P < 0.001, ****P < 0.0001
Fig. 7
Fig. 7
Intra-articular injection of Akt activator rescues systemic changes in mouse and pig model. a The evaluation procedure of mice liver and blood. b Flow cytometric measurement of the percentages of CD4+ T cells in peripheral blood, gated on CD45+ (n = 5). c Serum IL-6 and IL-17 levels detected by ELISA (n = 5). d HE staining (scale bar, 40 µm), IHC analysis (scale bar, 50 µm) on α-SMA protein and corresponding quantification of fibrosis areas of the collected liver (n = 5). e The liver mRNA expression of Il-1b, Il-6, and Tnf-α measured by qPCR (n = 5). f Heatmap of liver tissue from RNA-seq data (n = 3). g KEGG pathway analysis of downregulated genes in Blood+sc group of liver tissue (n = 3). h Serum biochemical analysis of AST and ALT (n = 5). i GSEA results of the RNA-seq data (n = 3). j The serological markers of liver function of pigs including ALT, AST, GGT, TP, ALB, and A/G (n = 4)

References

    1. Thomas AC, Hubbard-Turner T, Wikstrom EA, Palmieri-Smith RM. Epidemiology of posttraumatic osteoarthritis. J. Athl. Train. 2017;52:491–496. doi: 10.4085/1062-6050-51.5.08. - DOI - PMC - PubMed
    1. Lyons LP, Weinberg JB, Wittstein JR, McNulty AL. Blood in the joint: effects of hemarthrosis on meniscus health and repair techniques. Osteoarthr. Cartil. 2021;29:471–479. doi: 10.1016/j.joca.2020.11.008. - DOI - PMC - PubMed
    1. Gualtierotti R, Solimeno LP, Peyvandi F. Hemophilic arthropathy: current knowledge and future perspectives. J. Thromb. Haemost. 2021;19:2112–2121. doi: 10.1111/jth.15444. - DOI - PMC - PubMed
    1. Ravi B, Hosack L, Backstein D, Spangehl M. Recurrent hemarthrosis after total knee arthroplasty: evaluation and treatment. J. Am. Acad. Orthop. Surg. 2019;27:652–658. doi: 10.5435/JAAOS-D-18-00182. - DOI - PubMed
    1. Roosendaal G, et al. Iron deposits and catabolic properties of synovial tissue from patients with haemophilia. J. Bone Jt. Surg. Br. 1998;80:540–545. doi: 10.1302/0301-620X.80B3.0800540. - DOI - PubMed

Publication types