. 2024 May 7;7(1):527.
doi: 10.1038/s42003-024-06099-4.

E4BP4 in macrophages induces an anti-inflammatory phenotype that ameliorates the severity of colitis

Affiliations

E4BP4 in macrophages induces an anti-inflammatory phenotype that ameliorates the severity of colitis

Yasuko Kajimura et al. Commun Biol. .

Abstract

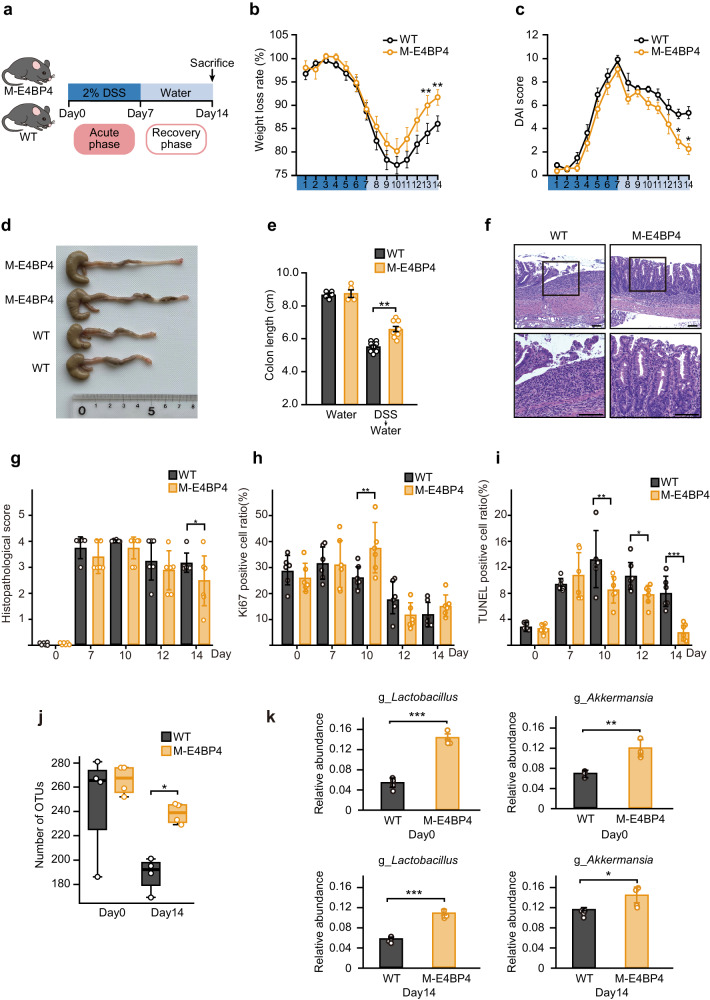
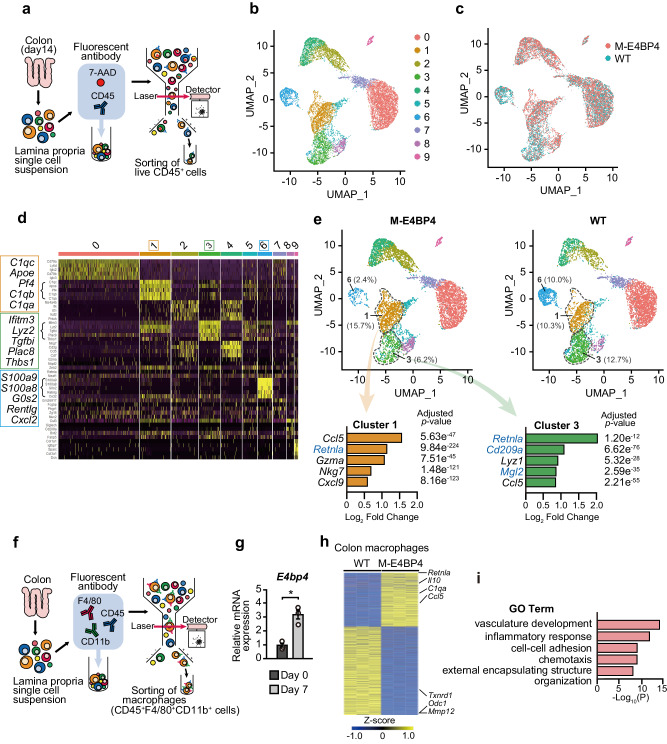
Macrophages are versatile cells of the innate immune system that work by altering their pro- or anti-inflammatory features. Their dysregulation leads to inflammatory disorders such as inflammatory bowel disease. We show that macrophage-specific upregulation of the clock output gene and transcription factor E4BP4 reduces the severity of colitis in mice. RNA-sequencing and single-cell analyses of macrophages revealed that increased expression of E4BP4 leads to an overall increase in expression of anti-inflammatory genes including Il4ra with a concomitant reduction in pro-inflammatory gene expression. In contrast, knockout of E4BP4 in macrophages leads to increased proinflammatory gene expression and decreased expression of anti-inflammatory genes. ChIP-seq and ATAC-seq analyses further identified Il4ra as a target of E4BP4, which drives anti-inflammatory polarization in macrophages. Together, these results reveal a critical role for E4BP4 in regulating macrophage inflammatory phenotypes and resolving inflammatory bowel diseases.


Conflict of interest statement

The authors declare no competing interests.

Figures

Fig. 1
Fig. 1. Macrophage-specific E4BP4 upregulation reduces the severity of dextran sulfate sodium (DSS)-induced colitis.
a Experimental timeline for the induction of colitis in mice. Mice were administered 2% (weight/volume) DSS in drinking water for 7 days to induce colitis, followed by regular drinking water for 7 days for recovery. b, c Daily time courses of body weight change and disease activity index (DAI) (n = 8). d Representative images of DSS-administered WT and M-E4BP4 mice colons on day 14. e Colon length on day 14 with and without 7 days’ DSS treatment (water: n = 5, DSS + water: n = 8). f Representative images of the H&E-stained longitudinal colonic sections on day 14. Scale bars: 100 μm. gi Histological score, Ki67, and TUNEL staining on days 0, 7, 10, 12 and, 14 (n = 6). j Alpha diversity of stool samples (n = 4). The line inside the box represents the median, while the whiskers represent the lowest and highest values within the 1.5 interquartile range (IQR). OTU operational taxonomic unit. k The relative abundances of genus Lactobacillus and Akkermansia in each individual sample obtained from the LEfSe analysis (n = 4). All values are expressed as means, error bars reflect SD. Significance was determined by two-way repeated-measures ANOVA, followed by Tukey’s post-test (*P < 0.05; **P < 0.01; ***P < 0.001).
Fig. 2
Fig. 2. Increased anti-inflammatory gene expression in M-E4BP4 mice colon macrophages.
a Schema for the isolation of CD45 positive cells of the lamina propria by flow cytometry and subsequent single-cell RNA-seq. Colon was dissected on day 14 (recovery phase). b A UMAP plot of 13,492 cells from WT (6466 cells) and M-E4BP4 (7,026 cells) colon. Clusters were determined using unsupervised clustering. Each point represents a single cell. c A UMAP plot of both WT and M-E4BP4 colon CD45+ cells. Color codes indicate library identity (WT or M-E4BP4). d Heatmap of the top five differentially expressed genes among each cluster. Gene groups involved in Cluster 1, 3, and 6 are shown in the expanded view. e UMAP plots of WT and M-E4BP4 colon CD45+ cells. Top five differentially upregulated genes in M-E4BP4 vs. WT in Cluster 1 and 3, respectively. Representative M2 macrophage marker genes are shown in blue. The relative frequency of each of Cluster 1 and 3 was calculated by the number of cells in that cluster compared to the total number of cells and is written in the graph. f Schematic overview of macrophage isolation by flow cytometry and subsequent RNA-seq (recovery phase). g Relative E4bp4 gene expression in colon macrophages at day 0 and day 7 (acute colitis phase) using quantitative real-time PCR analysis (n = 3). h Heatmap showing differentially expressed genes in WT or M-E4BP4 mice colon macrophages at day 14 (recovery phase) using RNA-seq (adjusted P value < 0.05). Data show three biological replicates. i Top 5 significantly enriched GO Biological Processes in obviously differentially expressed genes (absolute value of Log2 fold change >1). Gating strategies are shown in Supplementary Fig. 5a for (a), and Supplementary Fig. 5b for (f). All values are expressed as means, error bars reflect SD. Significance was determined by Welch’s t test for (b) (*P < 0.05).
Fig. 3
Fig. 3. Cell-based studies have revealed that E4BP4 promotes anti-inflammatory genes in macrophages.
a E4bp4 mRNA expression levels in GFP (CTRL) and E4BP4-expressing RAW264.7 cells (E4BP4-TG) (n = 3). Expression levels were expressed as TPM (transcripts per million) using RNA-seq. b Heatmap showing differentially regulated genes in CTRL and E4BP4-TG RAW264.7 cells using RNA-seq (adjusted P value < 0.05). Data show three biological replicates. c Cytokine measurements of cell culture supernatant from CTRL and E4BP4-TG RAW264.7 cells (n = 4). d Schema of CRISPR/Cas9 E4BP4 (exon 2) ablation in RAW264.7 cells. e Quantitative real-time PCR analyses of disrupted E4BP4 using the Q-PCR primer shown in Supplementary Fig. 3b (n = 7). f Heatmap showing differentially regulated genes in Cas9 only (CTRL) or E4BP4 knockout (E4BP4-KO) RAW264.7 cells using RNA-seq (adjusted P value < 0.05). Data show three biological replicates. g Venn diagram of shared and independent genes whose expression was increased by E4BP4-TG and genes whose expression was decreased by E4BP4-KO. h Transcription factor prediction analysis by TRRUST in 218 genes is shared in (g). All values are expressed as means, error bars reflect SD. Significance was determined by Welch’s t test (**P < 0.01, ***P < 0.001).
Fig. 4
Fig. 4. Macrophage E4BP4 binds to Il4ra and promotes its expression.
a Genomic distributions of E4BP4 ChIP-seq peaks in WT RAW264.7 cells. b IGV browser tracks of E4BP4 ChIP-seq in E4BP4-IP and input DNA (input) along the per1 gene. Maximum track heights within viewable windows are indicated to the right of each condition. c Significantly enriched GO Biological Processes in E4BP4 ChIP-seq peaks. d Genomic distributions of ATAC-seq peaks in CTRL and E4BP4-TG RAW264.7 cells along the Csf1r gene. e Representative IGV browser tracks ATAC-seq in control and E4BP4-TG RAW264.7 cells along the Csf1r gene. Maximum track heights within the viewable window are indicated to the right of each condition. f Top five motifs enriched within ATAC peaks in E4BP4-TG compared to CTRL. g Venn diagram showing overlapping genes with an increased peak at E4BP4-TG by ATAC-seq and E4BP4 ChIP-seq and increased expression by E4BP4-TG by RNA-seq in RAW264.7 cells. h Significantly enriched GO Biological Processes in the 27 overlapping genes in (g). i IGV browser tracks E4BP4 ChIP-seq, ATAC-seq in control and E4BP4-TG RAW264.7 cells along Il4ra. Maximum track heights within viewable windows are indicated to the right of each condition. j mRNA expression of Il4ra in CTRL (Cas9 only) or E4BP4-KO RAW264.7 cells (n = 4). Values are expressed as means, error bars reflect SD. Significance was determined by Welch’s t test (***P < 0.001). k mRNA expression of Il4ra in E4BP4-KO RAW264.7 cells and RAW264.7 cells overexpressing GFP or E4BP4 (n = 4). Values are expressed as means, error bars reflect SD. Significance was determined by Welch’s t test (**P < 0.01). l Experimental timeline of colitis induction and rescue in mice. Mice were treated with 2% (wt/vol) DSS in drinking water for 7 days to induce colitis and then recovered with normal drinking water for 7 days. Bone marrow-derived macrophage (BMDM) was infused via the tail vein on day 0 and day 7 (n = 4 for WT-BMDM, n = 5 for M-E4BP4 BMDM). m Daily time courses of disease activity index (DAI). Values are expressed as means, error bars reflect SD. Significance was determined by two-way repeated-measures ANOVA, followed by Tukey’s post-test (*P < 0.05, ***P < 0.001).

References

    1. Bain CC, Mowat AM. Macrophages in intestinal homeostasis and inflammation. Immunol. Rev. 2014;260:102–117. doi: 10.1111/imr.12192. - DOI - PMC - PubMed
    1. Zhou X, et al. YAP aggravates inflammatory bowel disease by regulating M1/M2 macrophage polarization and gut microbial homeostasis. Cell Rep. 2019;27:1176–1189.e1175. doi: 10.1016/j.celrep.2019.03.028. - DOI - PubMed
    1. Wang J, Chen WD, Wang YD. The relationship between gut microbiota and inflammatory diseases: the role of macrophages. Front. Microbiol. 2020;11:1065. doi: 10.3389/fmicb.2020.01065. - DOI - PMC - PubMed
    1. Koelink PJ, et al. Anti-TNF therapy in IBD exerts its therapeutic effect through macrophage IL-10 signalling. Gut. 2020;69:1053–1063. doi: 10.1136/gutjnl-2019-318264. - DOI - PMC - PubMed
    1. Krausgruber T, et al. IRF5 promotes inflammatory macrophage polarization and TH1-TH17 responses. Nat. Immunol. 2011;12:231–238. doi: 10.1038/ni.1990. - DOI - PubMed

Publication types

Substances