. 2024 May;56(5):877-888.
doi: 10.1038/s41588-024-01717-7. Epub 2024 May 7.

STR mutations on chromosome 15q cause thyrotropin resistance by activating a primate-specific enhancer of MIR7-2/MIR1179

Affiliations

STR mutations on chromosome 15q cause thyrotropin resistance by activating a primate-specific enhancer of MIR7-2/MIR1179

Helmut Grasberger et al. Nat Genet. 2024 May.

Abstract

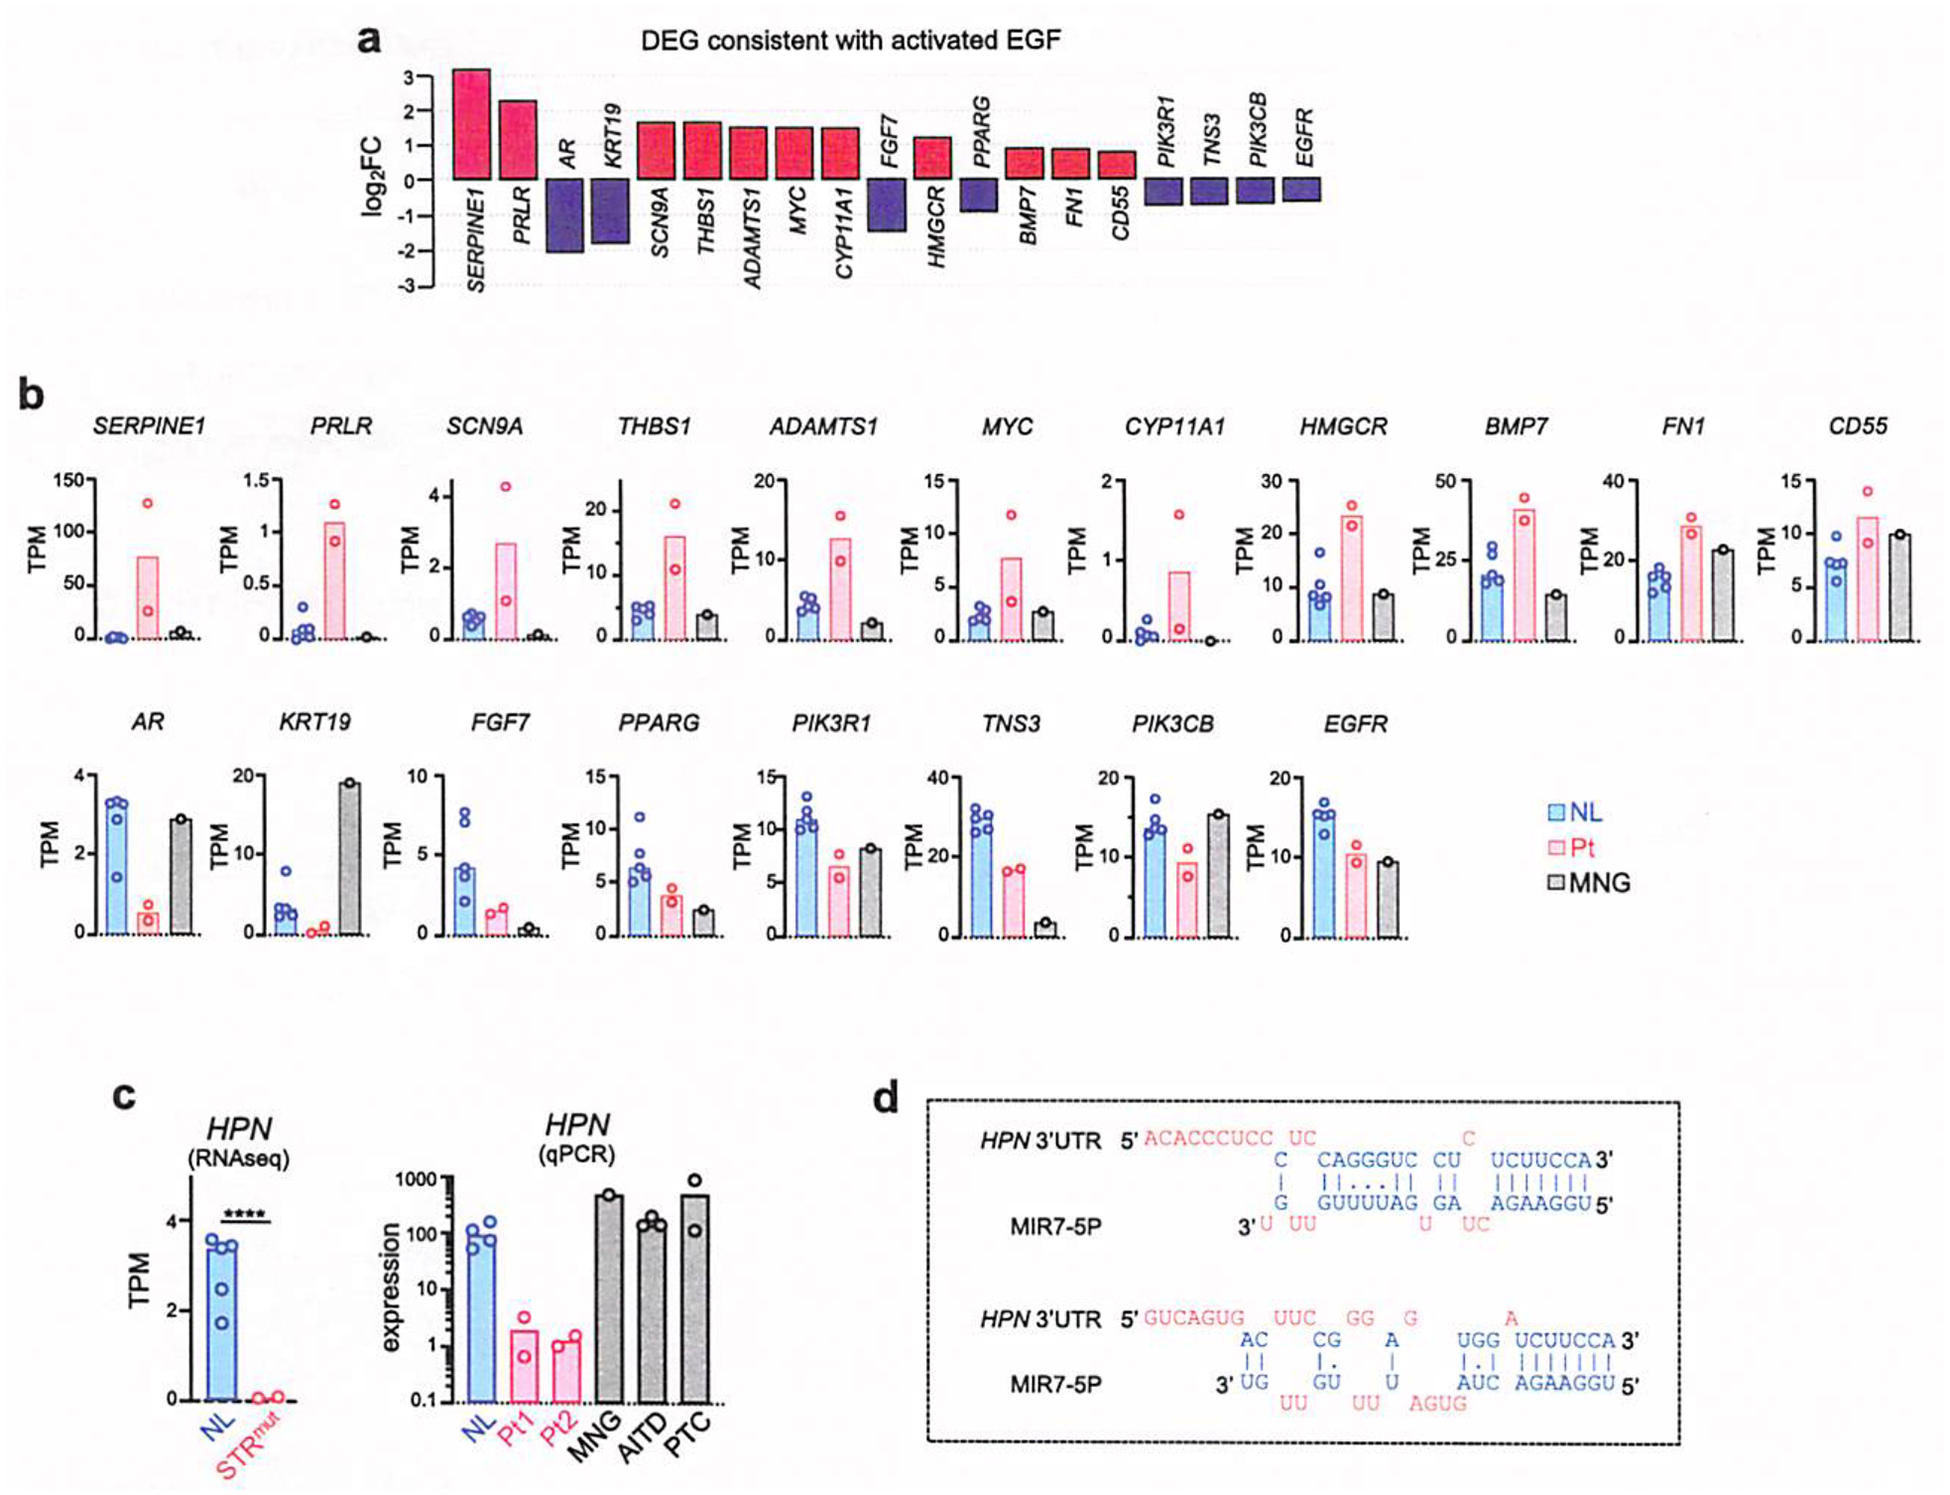
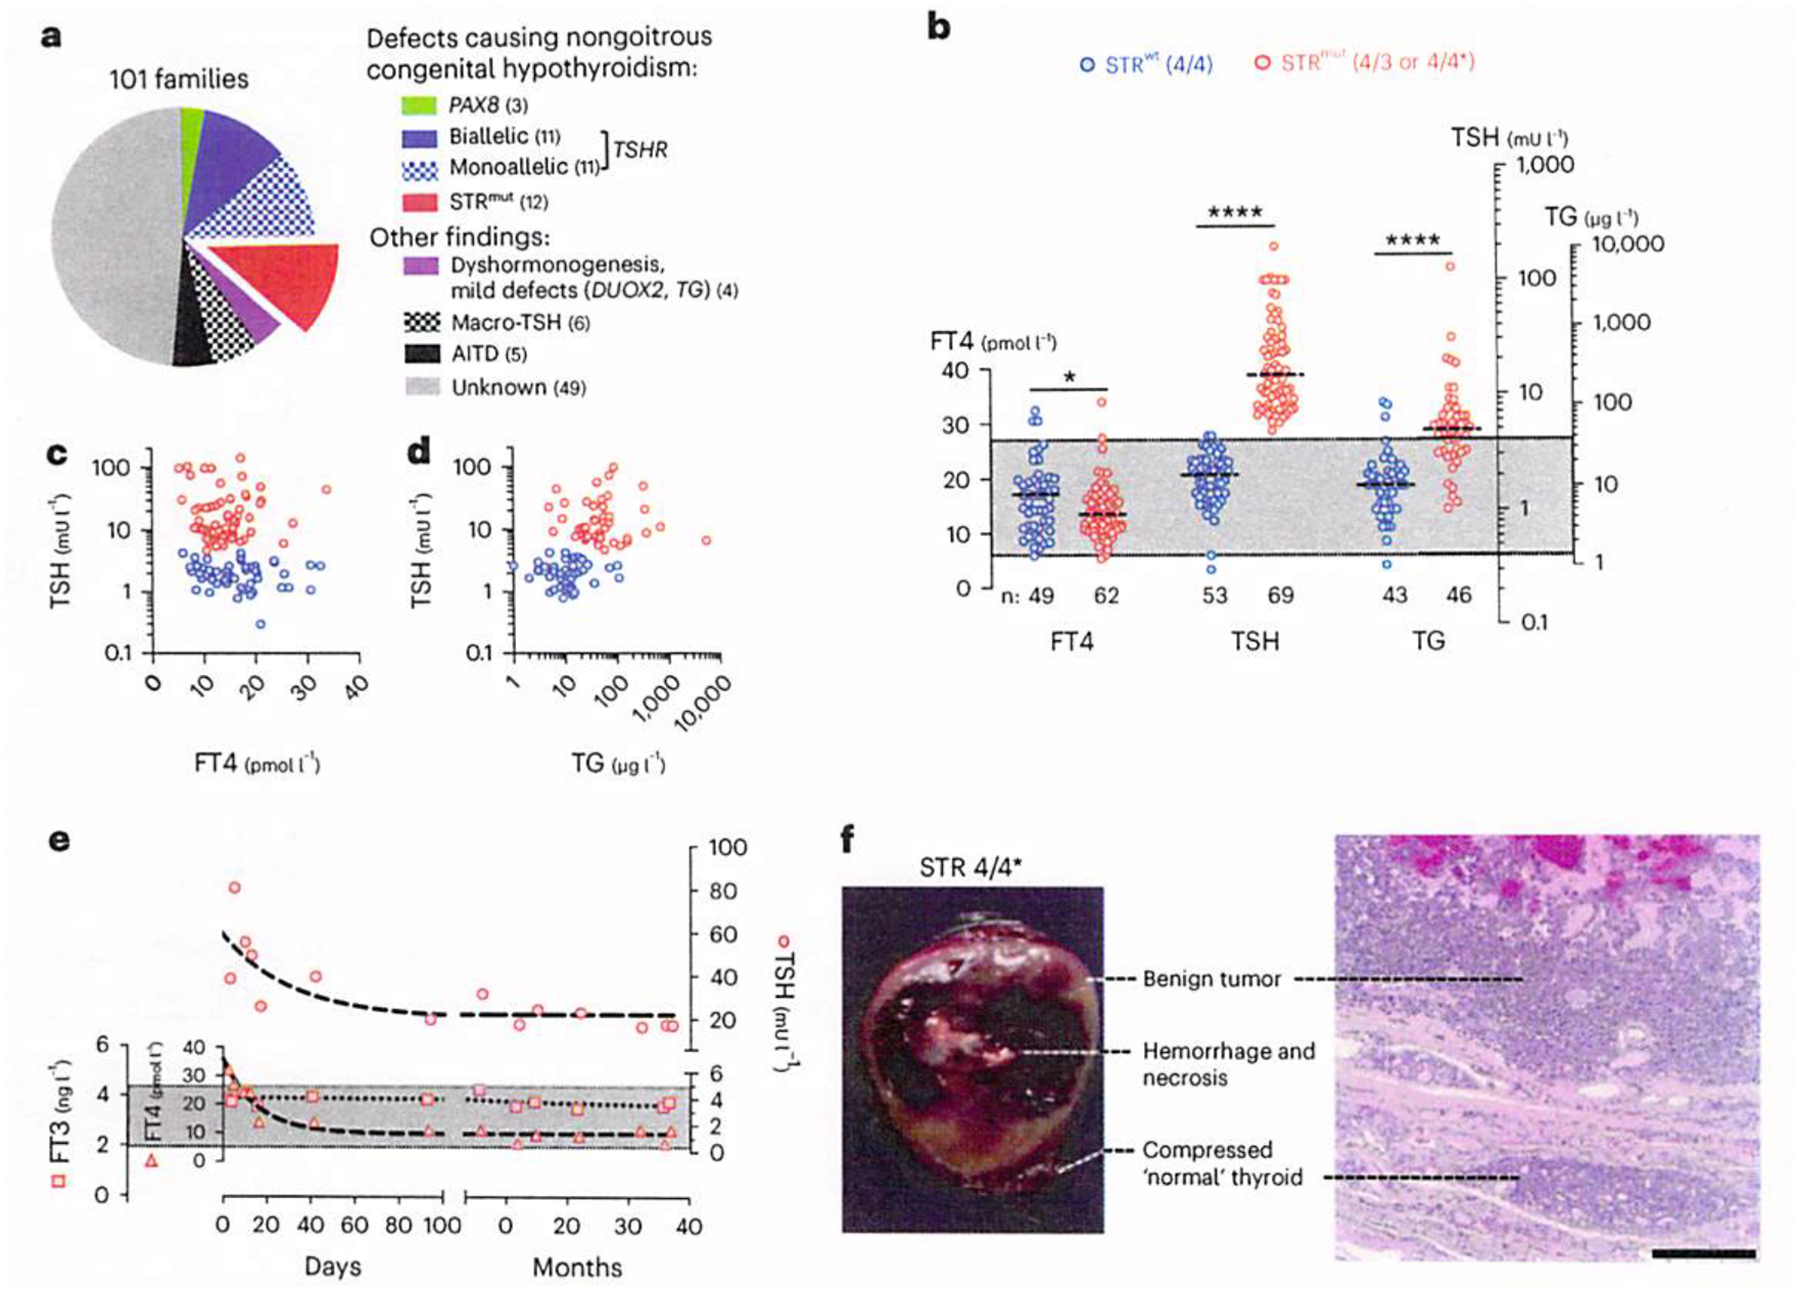
Thyrotropin (TSH) is the master regulator of thyroid gland growth and function. Resistance to TSH (RTSH) describes conditions with reduced sensitivity to TSH. Dominantly inherited RTSH has been linked to a locus on chromosome 15q, but its genetic basis has remained elusive. Here we show that non-coding mutations in a (TTTG)4 short tandem repeat (STR) underlie dominantly inherited RTSH in all 82 affected participants from 12 unrelated families. The STR is contained in a primate-specific Alu retrotransposon with thyroid-specific cis-regulatory chromatin features. Fiber-seq and RNA-seq studies revealed that the mutant STR activates a thyroid-specific enhancer cluster, leading to haplotype-specific upregulation of the bicistronic MIR7-2/MIR1179 locus 35 kb downstream and overexpression of its microRNA products in the participants' thyrocytes. An imbalance in signaling pathways targeted by these micro-RNAs provides a working model for this cause of RTSH. This finding broadens our current knowledge of genetic defects altering pituitary-thyroid feedback regulation.


Conflict of interest statement

Competing interests

A.B.S. is a co-inventor on a patent relating to the Fiber-seq method. The other authors declare no competing interests.

Figures

Extended Data Fig. 1 |
Extended Data Fig. 1 |. Alignment of the human STR (TTTG)4 with homolog sequences from other primates.
We searched 86 nonhuman primate genomes available in the NCBI databank (refseq_genomes; accessed 09/2023) by BLAST search with a 278 bp human sequence centered around the STR. Of 49 Old World Primates, 47 had a single match over the full sequence that was confirmed to be syntenic (that is, upstream of the MIR7–2 locus). All of these had a TTTG repeat sequence within the T-rich sequence (corresponding to the poly(A) tail of the AluSx1 retrotransposon). For the remaining two Old World Primate genomes (Rhinopithecus strykeri and Rhinopithecus bieti), we were not able to ascertain a clear homolog, although the homolog was present in another member of the same genus (R. roxellana). For the 37 other nonhuman primate genomes (including 13 New World Primates, 2 Tarsiiformes, 1 Chyromyiformes, 16 Lemuriformes, 5 Lorisiformes), only 4 of the New World Primate genomes (Cebus albifrons, Sapajus apella, Sanguinus midas, Aotus nancymaae) had a detectable syntenic homolog of the STR encompassing region, but their T-rich sequence was notably devoid of TTTG repeats. These data place the insertion of the AluSx1 retrotransposon into this locus before the split between New and Old World Primates, that is about 40 million years ago. This finding is consistent with data showing that the AluS subfamily arose from Aluj after the split between Strepsirrhini (Lemuriformes and Lorisiformes) from the common ancestors of Old and New World Primates,. Since essentially all extant members of the Old World Primate lineage seem to carry a TTTG repeat sequence in this interval, we postulate that it first evolved in the common ancestor of Old World Primates. Note that for genera with multiple representatives with virtually identical sequences, only a subset of species is shown.
Extended Data Fig. 2 |
Extended Data Fig. 2 |. Thyroid-specificity of the STR-associated cis-regulatory element.
Shown are snATAC-Seq peak data for different cell types. The STR maps to a predicted cis-regulatory element specifically active in thyroid follicular cells.
Extended Data Fig. 3 |
Extended Data Fig. 3 |. Fiber-seq chromatin accessibility at the STR site and miRNA locus.
a, Fiber-seq chromatin accessibility tracks showing the FIRE scores at the enhancer cluster surrounding the STR site in thyroid tissue from two individuals with RTSH, thyroid tissue from a healthy control individual, and MNG thyroid tissue. For the individuals with RTSH, FIRE signal is separated by haplotype. b, Bar plots showing the mean FIRE scores within the elements highlighted above across the samples shown in a. Of note, multi-nodular goiter (MNG) tissue showed selective activation of element 5 within this enhancer cluster, with elements 1–3 remaining silenced. c, DNase-seq signal at the miRNA locus from ENCODE, as well as haplotype-specific Fiber-seq chromatin accessibility in this region. Note that the miRNA promoter region selectively demonstrates haplotype-specific chromatin accessibility.
Extended Data Fig. 4 |
Extended Data Fig. 4 |. Relationship between CpG methylation and chromatin accessibility at the STR enhancer cluster.
For each Fiber-seq sequencing read at this site, shown is the per-molecule m6A-marked chromatin accessibility stencils (left), as well as the per-molecule methylation status of CpG dinucleotides (right) for the same reads. CpG methylation status is indicated using a color gradient from blue to red, with blue indicating unmethylated CpGs, and red indicating methylated CpGs, and the shading according to the precision of the methylation calls according to Primrose. Reads are separated out by sample, as well as by haplotype within the RTSH samples. Reads are then ranked based on the CpG methylation status surrounding the STR site, with hypo-CpG methylated reads being on top. This reveals that individual chromatin Fibers harboring chromatin accessibility at this enhancer cluster similarly had hypo-CpG methylation of the surrounding CpG dinucleotides. However, hypo-CpG methylation of the surrounding CpGs was similarly observed on fibers lacking chromatin accessibility at elements 1–3, indicating that hypo-CpG methylation is necessary, but not sufficient for actuating this codependent enhancer cluster.
Extended Data Fig. 5 |
Extended Data Fig. 5 |. Tissue-specific DNA hypomethylation of the STRmut allele.
a, Upper panel depicts selected CpG sites hypomethylated on the STRmut haplotype in thyroid (compare Fig. 1a). The tissue-specific methylation profiles of the STRwt allele were established by allele-specific amplification from bisulfite treated DNA from either thyroid tissue (from n = 10 individuals per CpG site), skin fibroblasts (n = 7) or leukocytes (n = 6). and the methylation status (%methylated; mean±SEM) of six CpG sites (m1, m3, m6, m7, m8, m9) quantified following digestion with methylation-sensitive restriction endonucleases. Three CpG sites (m7, m8, m9) close to the STRwt sequence were hypomethylated in thyroid compared to fibroblasts and leukocytes suggesting their relevance for thyroid-specific expression under normal conditions. b, Tissue-specific relative methylation of STRmut (vs STRwt) in thyroid tissue (from n = 2 participants with RTSH), cultured fibroblasts (n=3), and leukocytes (n = 4). On the chromosome harboring STRmut, m7 and m8 appear to be hypomethylated in fibroblasts albeit to lesser degree than in thyroid. In contrast, for the m9 site, hypomethylation of STRmut chromosomes appears to be restricted to thyroid. The latter site locates to a binding motif of C/EBPB and is hypermethylated in fibroblasts (both, STRwt and STRmut). These results could indicate that in fibroblasts, binding of a forkhead domain TF (other than FOXE1) at the STR region produces a limited increase in accessibility that does not extend to m9. In thyroid, FOXE1 produces more extensive accessibility followed by hypomethylation and binding of an additional TF, thatls.C/EBPB.
Extended Data Fig. 6 |
Extended Data Fig. 6 |. Transcriptional activity of the MIR7–2/MIR1179 locus indicating high thyroid specificity of mature miRNA expression.
a, Top panel: Sashimi plot visualizing coverage and splice junctions from aligned RNA-seq data from Pt1. The acute absence of reads overlapping with the localization of the miRNA stem loop sequences suggests efficient processing of the pri-MIR by the Microprocessor complex. Lower panel: annotation track showing the relative positions of relevant features including the MIR7–2 and MIR1179 stem loops, the major poly A site where most pri-MIR transcripts terminate, and spliced readthrough transcripts that connect to the first coding exon of AEN. LINC0158 is expressed on the opposite strand and overlaps with pri-MIR transcripts within the core of the bidirectional promoter (containing a CpG island). b, Tissue expression profiling of products from the miRNA locus. For each tissue, total RNA pooled from at least 3 individual donors was utilized (Ambion). Data (mean±SD; 3 replicate amplifications) were obtained by real-time reverse transcription PCR assays, normalized for either RNU44 (MIR7–5P and MIR1179)or UBE2D3 (spliced readthrough transcript,unprocessed MIR7–2 stem loop, LINC01586,AEN),.and expressed relative to the expression detected in thyroid tissue (set to 100%).
Extended Data Fig. 7 |
Extended Data Fig. 7 |. Data supporting activated EGF(-like) signaling activity.
a, Subset of DEGs (n = 2 STRmut vs n = 5 NLSTRwt thyroids) that were directionally consistent with EGF signaling activity (from the analysis shown in Fig. 7e). b, Expression values of DEGs shown in a. Gene expression profile of an STRwt (nontoxic) MNC is shown for comparison. c, Downregulation of HPN encoding an EGFR-inactivating protease. Specific suppression of HPN expression in STRmut thyroid glands by RNA-seq (n = 2 thyroids with STRmut and 5 NL with STRwt) and RT-qPCR. For RT-PCR, samples Included n = 4 NL thyroids (2 distinct from RNAseq samples), n=3 with AITD. n = 2 with PTC, and one with MNG (all STRwt). For both Pt1 and Pt2 with STRmut, two separate specimens from their excised thyroid glands were analyzed by qPCR.****, FDR = 2 × 10⁻²¹ (DESeq2). d, Alignment of MIR7–5P to predicted 3′-UTR target sites of HPN. Watson-Crick pairings are shown as vertical dashes and G:U wobble pairings by dots. TPM, transcripts per million.
Fig. 1|
Fig. 1|. STR variants in a primate-specific region of chr15.
a, Overview of the autosomal dominant RTSH locus (OMIM: 609893) mapped in five large pedigrees. b, Representative sequencing electropherograms of the WT STR 4/4, the heterozygous 3 repeat variant (STR 4/3) and the heterozygous T > G SNV in the third repeat (STR 4/4*). c, Sequences of the STR variants in Gorilla, homozygous (TTTG)4, and heterozygous and homozygous replacement of the second T with a C in the fourth repeat.
Fig. 2|
Fig. 2|. Pedigrees of families with STR mutations showing genotype-phenotype correlation.
The RTSH phenotype is indicated by the half-colored area in each symbol and the genotype aligned below each symbol. Genotypes in boxes correspond to participants screened by WGS. Of note, the haplotypes for family 14 indicate a de novo mutation.
Fig. 3|
Fig. 3|. Etiology of familial RTSH and thyroid phenotype in individuals with STRmut.
a, Findings in 101 RTSH families. All the probands had compensated RTSH. The number of families is indicated in parenthesis. b, FT4, TSH and TG concentr ations in serum of individuals with STRmut and their unaffected relatives. For participants on L-T4, treatment was discontinued for at least 6 weeks prior to thyroid evaluation. Note that scales were adjusted for the respective tests to produce a common reference range (shaded in gray). The TG value of 5,500 and one of 700 μg l−1 are from participants II-4 of family 60 and I-2 of family 30, both of whom developed goiters that were removed surgically. *P = 0.026; ****p < 0.0001 (two-tailed Mann-Whitney). c, Scatterplot of TSH versus FT4 for STRwt (n = 49; blue) and STRmut (n = 61; red). d, Scatterplot of TSH versus TG for STRwt (n = 43; blue) and STRmut (n = 45; red). e, The evolution of thyroid tests from birth in participant II-3 of family 94 (STR 4/3). Values follow the expected age-related changes except for the higher concentrations of TSH. f, Macroscopic and histological appearance of the excised thyroid gland of participant I-2 of family 30. Scale bar = 500 μm.
Fig. 4 |
Fig. 4 |. STRmut is associated with the activation of a codependent thyroid-specific enhancer cluster.
a, Fiber-seq was performed on thyroid tissue from a healthy control individual, as well as an individual with RTSH heterozygous for STRmut to obtain haploty pe-resolved chromatin and CpG methylation pattern. b, Genomic locus showing chromatin and RNA expression data from a healthy individual, STRwt. DNase-seq, ChIP-seq and RNA-seq data were obtained from ENCODE. c, Genomic locus showing Fiber-seq-derived chromatin data from an individual with RTSH (STR 4/3). Bottom left: genomic locus showing single-molecule chromatin architectures derived from Fiber-seq, with nucleosomes, internucleosomal linker regions and FIREs colored in gray, lavender and red, respectively. Aggregate single-molecule accessibility patterns are displayed above. d, Swarm plot showing the difference in promoter accessibility between he STRmut and STRwt haplotypes for all genes within 1 Mb of the STR. P values were calculated using a two-sided Fisher’s exact test. e, Network analysis showing the pairwise codependency between each of the five accessible elements shown in c. Blue lines indicate peaks that are preferentially accessible along the same molecule, and the thick lines indicate the strength of codependency. f, Essentiality analysis for each of the five regulatory elements within this codependent enhancer cluster. Left: five separate networks showing the pairwise codependency after removal of reads with an accessible FIRE overlapping the element with a red cross symbol over it. Right: bar plot showing the difference in codependency of this enhancer cluster after removal of each of the five elements. FIRE, Fiber-seq inferred regulatory element.
Fig.5|
Fig.5|. STRmut stabilizes TF-binding occupancy.
a, Single-molecule protein occupancy overlapping the STRwt and STRmut variant using Fiber-seq from thyroid tissue from an individual with RTSH (same as Fig. 4c). Predicted TF-binding elements using FIMO scans of JASPAR CORE elements are shown, with the GTEx RNA-seq expression level in the thyroid of each TF indicated by the color of the element (predicted binding elements for TFs with less than one TPM in thyroid were removed). m6A-MTase-modified bases along each fiber are indicated by purple marks. The region corresponding to a large protein footprint overlapping the STRwt and STRmut variants is indicated in blue. b, Bar plot showing the proportion of fibers along the STRwt and STRmut haplotype that demonstrate a protein occupancy event overlapping the STR site. ***P = 0.00039; two-sided Fisher’s exact test. c, Fiber-seq was performed on thyroid tissue from an individual with RTSH heterozygous for the STR4* variant. Shown are m6A-MTase-modified bases along each fiber from the STR4 and STR4* haplotypes, as well as a bar plot comparing protein occupancy at the STR site. ***P = 0.00097; two-sided Fisher’s exact test. d, Sequences of the STR4, STR3, STR4* and Gorilla (TTTG)3(TCTG)1 alleles, as well as the predicted location of FOXE1 binding elements along these alleles. TPM, transcript per million.
Fig. 6|
Fig. 6|. Allele-specific overexpression of a miRNA locus downstream of STRmut in the participants’ thyroid glands.
a, Mapping of RNA-seq paired-end reads identifies a ~13.5 kb ROI35 kb q-terminal of STRmut that comprisesMIR7–2 and MIR1179 and shows exceptionally high transcriptional activity in STRmut carriers. Boundaries of the ROI coincide with the major transcription start site (Supplementary Fig. 4) and a polyA site (chr15:88, 604, 683–88, 618, 202; hg38). b, Expression of the miRNA locus (ROI) in two thyroid samples representing the two different mutations (STR4/3 and 4/4*), five NL thyroids (STRwt) and one MNG (STRwt). ***P = 0.0003; two-tailed Student’s t test. c, Directional effect of STRmut on the expression of the miRNA locus. The relative expression of a spliced pri-MIR readthrough transcript and of a non-coding spliced RNA (LINC01586) expressed on the opposite strand from a common, bidirectionally active promoter region (Extended Data Fig. 6) is shown. The ratio values indicate the expression of readthrough transcripts versus LINC01586. For both Pt1 and Pt2, the data shown are from two separate specimens from their excised thyroid glands. d, Allelic imbalance of the miRNA locus consistent with cis-regulatory role of STRmut. Allelic expression of heterozygous SNVs on the pri-MIR using variant calling on RNA-seq data. Segregation of the red haplotype with either STR4* (Pt1) or STR3 (Pt2) was confirmed by genotyping the respective pedigrees. e, Apparent loss-of-heterozygosity at the pri-MIR locus is shown by amplification from STRmut thyroid cDNA. f, Mature miRNA profile in STRmut thyroids. PCA distinguishes STRmut from STRwt glands (either NL or MNG). g, MA plot of thyroidal miRNA expression (n = 2 STRmut versus n = 5 NL with STRwt). MiRNAs substantially upregulated or downregulated in STRmut (FDR < 0.05; |log2(FC)| > 0.58) are indicated by red or blue dots, respectively. CPM, TMM normalized counts per million of mature miRNAs. h and i, Real-time PCR assays for MIR7–5P and MIR1179. Data points represent individuals with NL (n = 4), AITD (n = 3), PTC (n = 2), MNG (n = 1) or STRmut (n = 2; mean values from two separate specimens). ***p = 0.0003; ***p < 0.0001; two-tailed Student’s t test.
Fig. 7|
Fig. 7|. Overexpression of MIR7–5P in STRmut thyroids is linked to altered proliferative signaling pathways.
a, PCA plot of thyroidal mRNA expression determined by paired-end RNA-seq. b, MA plot indicating DEGs (FDR < 0.05 with |log2(FC)| > 0.58; STRmut versus NL) by red (higher in STRmut) or blue (lower in STRmuI) dots. c. Evidence for higher MIR7–5P activity in STRmut thyroid glands. A total of 2,141 miRNA target gene sets (miRDB subset from MSigDB) were tested for their correlation with gene expression changes (STRmut versus NL) using gene set enrichment analysis. The MIR7–5P target gene set was found to have the most significant enrichment for genes downregulated in STRmut. d, Expression heatmaps of all DEG identified as MIR7–5P targets in MicroT-CDS (miTG score of >0.6). e, Prediction of EGF as activated upstream regulator (FDR = 0.059) by analyzing the differential expression of downstream genes (iPathwayGuide). The x axis position is the log of the unadjusted P value based on the activation z score, which is derived by comparison with a model that assigns random regulation. The y axis position is the log of the unadjusted overrepresentation P value based on the number of DE target genes consistent with the activation profile. The size of each dot represents the number of DEG directionally consistent with the regulator profile. f, Proposed working model for thyroid pathophysiology in STRmut. Abnormally high MIR7–5P level in thyrocytes impairs proliferative response compatible with the phenotype of non-goitrous congenital hyperthyrotropinemia. The predicted activation of EGF downstream signaling conceivably would promote proliferative lesions observed in a subset of adult participants. Potential mechanisms are an increased EGF tone because of an abnormal feedback response to suppressed IGFR signaling or reduced EGFR inactivation by HPN. FWER, family-wise error rate; NES, normalized enrichment score.

References

    1. Peters C, van Trotsenburg ASP & Schoenmakers N Diagnosis of endocrine disease: congenital hypothyroidism: update and perspectives. Eur. J. Endocrinol 179, R297–R317 (2018). - PubMed
    1. Boersma B, Otten BJ, Stoelinga GB & Wit JM Catch-up growth after prolonged hypothyroidism. Eur. J. Pediatr 155, 362–367 (1996). - PubMed
    1. Tenenbaum-Rakover Y et al. Long-term outcome of loss-of-function mutations in thyrotropin receptor gene. Thyroid 25, 292–299 (2015). - PMC - PubMed
    1. Persani L et al. Genetics and phenomics of hypothyroidism due to TSH resistance. Mol. Cell. Endocrinol 322, 72–82 (2010). - PubMed
    1. Stanbury JB, Rocmans P, Buhler UK & Ochi Y Congenital hypothyroidism with impaired thyroid response to thyrotropin. N. Engl. J. Med 279, 1132–1136 (1968). - PubMed

LinkOut - more resources